Free Statistics
of Irreproducible Research!
Description of Statistical Computation | |||||||||||||||||||||||||||||||||||||||
|---|---|---|---|---|---|---|---|---|---|---|---|---|---|---|---|---|---|---|---|---|---|---|---|---|---|---|---|---|---|---|---|---|---|---|---|---|---|---|---|
| Author's title | |||||||||||||||||||||||||||||||||||||||
| Author | *Unverified author* | ||||||||||||||||||||||||||||||||||||||
| R Software Module | rwasp_Tests to Compare Two Means.wasp | ||||||||||||||||||||||||||||||||||||||
| Title produced by software | T-Tests | ||||||||||||||||||||||||||||||||||||||
| Date of computation | Wed, 14 Mar 2012 09:25:27 -0400 | ||||||||||||||||||||||||||||||||||||||
| Cite this page as follows | Statistical Computations at FreeStatistics.org, Office for Research Development and Education, URL https://freestatistics.org/blog/index.php?v=date/2012/Mar/14/t13317316301lccdygj74o2vnq.htm/, Retrieved Tue, 30 Apr 2024 21:27:15 +0000 | ||||||||||||||||||||||||||||||||||||||
| Statistical Computations at FreeStatistics.org, Office for Research Development and Education, URL https://freestatistics.org/blog/index.php?pk=163969, Retrieved Tue, 30 Apr 2024 21:27:15 +0000 | |||||||||||||||||||||||||||||||||||||||
| QR Codes: | |||||||||||||||||||||||||||||||||||||||
|
| |||||||||||||||||||||||||||||||||||||||
| Original text written by user: | |||||||||||||||||||||||||||||||||||||||
| IsPrivate? | No (this computation is public) | ||||||||||||||||||||||||||||||||||||||
| User-defined keywords | |||||||||||||||||||||||||||||||||||||||
| Estimated Impact | 114 | ||||||||||||||||||||||||||||||||||||||
Tree of Dependent Computations | |||||||||||||||||||||||||||||||||||||||
| Family? (F = Feedback message, R = changed R code, M = changed R Module, P = changed Parameters, D = changed Data) | |||||||||||||||||||||||||||||||||||||||
| - [Aston University Statistical Software] [Test of Two Means] [2009-11-10 17:16:17] [98fd0e87c3eb04e0cc2efde01dbafab6] - R P [Aston University Statistical Software] [Compare Two Means] [2009-11-11 08:09:40] [74be16979710d4c4e7c6647856088456] - D [Aston University Statistical Software] [PY2236 Week 6 dat...] [2009-11-11 12:53:10] [74be16979710d4c4e7c6647856088456] - P [T-Tests] [Week 9 PY2236] [2010-11-24 14:41:08] [74be16979710d4c4e7c6647856088456] - D [T-Tests] [PY2236 Week 9 Dat...] [2010-11-30 18:04:40] [74be16979710d4c4e7c6647856088456] - RMPD [T-Tests] [] [2012-03-14 13:25:27] [d41d8cd98f00b204e9800998ecf8427e] [Current] | |||||||||||||||||||||||||||||||||||||||
| Feedback Forum | |||||||||||||||||||||||||||||||||||||||
Post a new message | |||||||||||||||||||||||||||||||||||||||
Dataset | |||||||||||||||||||||||||||||||||||||||
| Dataseries X: | |||||||||||||||||||||||||||||||||||||||
1650 1097 783 961 1607 1374 774 1729 653 1003 963 1170 1249 1075 974 1429 2781 1086 835 2788 1477 2575 759 1407 1806 1226 965 1359 695 1043 834 1195 1902 1817 2136 1324 928 2402 843 1199 2752 1204 949 1934 721 985 8423 1035 696 1152 857 1541 1583 2057 873 929 507 815 899 1232 687 1648 1445 737 633 676 581 698 550 618 633 827 770 712 853 541 858 461 524 1005 759 506 789 850 1244 936 1059 900 556 891 893 734 1050 857 611 963 1032 738 655 900 770 879 772 3007 784 949 1023 1645 1733 1345 924 957 800 1328 881 1473 950 1466 888 1054 1002 2110 1975 1081 | |||||||||||||||||||||||||||||||||||||||
Tables (Output of Computation) | |||||||||||||||||||||||||||||||||||||||
| |||||||||||||||||||||||||||||||||||||||
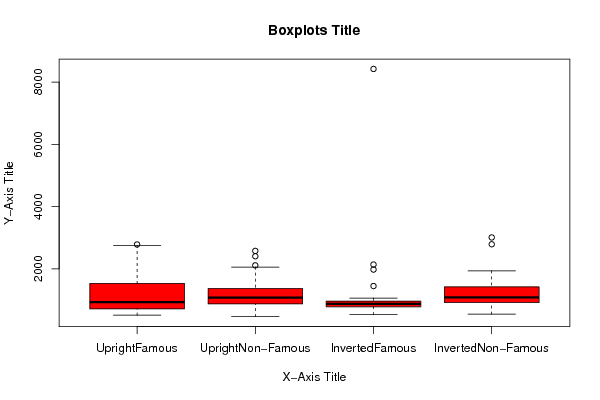
Figures (Output of Computation) | |||||||||||||||||||||||||||||||||||||||
Input Parameters & R Code | |||||||||||||||||||||||||||||||||||||||
| Parameters (Session): | |||||||||||||||||||||||||||||||||||||||
| par1 = two.sided ; par2 = 1 ; par3 = 3 ; par4 = Students T-Test ; par5 = paired ; par6 = 0.0 ; par8 = TRUE ; | |||||||||||||||||||||||||||||||||||||||
| Parameters (R input): | |||||||||||||||||||||||||||||||||||||||
| par1 = two.sided ; par2 = 1 ; par3 = 3 ; par4 = Students T-Test ; par5 = paired ; par6 = 0.0 ; par7 = ; par8 = TRUE ; | |||||||||||||||||||||||||||||||||||||||
| R code (references can be found in the software module): | |||||||||||||||||||||||||||||||||||||||
par2 <- as.numeric(par2) | |||||||||||||||||||||||||||||||||||||||