| Multiple Linear Regression - Estimated Regression Equation |
| TimeIn[t] = + 694.306022592399 + 0.402567652457246Sunset[t] + 0.923736305761433Temperature[t] -0.255747058486602Humidity[t] -13.8133649195182Rain[t] + e[t] |
| Multiple Linear Regression - Ordinary Least Squares | |||||
| Variable | Parameter | S.D. | T-STAT H0: parameter = 0 | 2-tail p-value | 1-tail p-value |
| (Intercept) | 694.306022592399 | 230.122348 | 3.0171 | 0.005269 | 0.002635 |
| Sunset | 0.402567652457246 | 0.204324 | 1.9702 | 0.058425 | 0.029213 |
| Temperature | 0.923736305761433 | 0.603461 | 1.5307 | 0.136672 | 0.068336 |
| Humidity | -0.255747058486602 | 0.171014 | -1.4955 | 0.145595 | 0.072797 |
| Rain | -13.8133649195182 | 7.541631 | -1.8316 | 0.077299 | 0.03865 |
| Multiple Linear Regression - Regression Statistics | |
| Multiple R | 0.706084256173618 |
| R-squared | 0.498554976816251 |
| Adjusted R-squared | 0.429390146032286 |
| F-TEST (value) | 7.20821508800441 |
| F-TEST (DF numerator) | 4 |
| F-TEST (DF denominator) | 29 |
| p-value | 0.00037032903933476 |
| Multiple Linear Regression - Residual Statistics | |
| Residual Standard Deviation | 14.7486053088366 |
| Sum Squared Residuals | 6308.11939811943 |
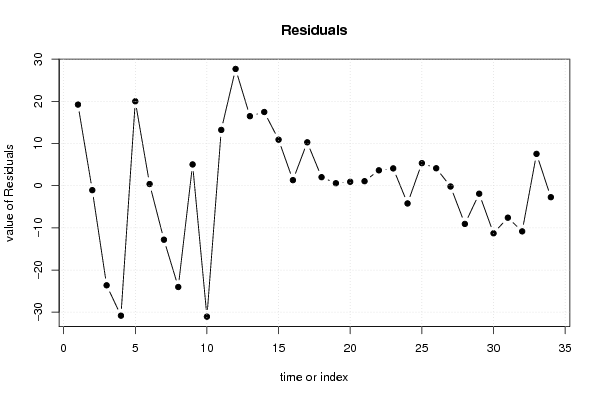
| Multiple Linear Regression - Actuals, Interpolation, and Residuals | |||
| Time or Index | Actuals | Interpolation Forecast | Residuals Prediction Error |
| 1 | 1217 | 1197.77284873691 | 19.227151263085 |
| 2 | 1202 | 1203.06845510891 | -1.06845510891278 |
| 3 | 1180 | 1203.6275504294 | -23.6275504293986 |
| 4 | 1167 | 1197.82530347746 | -30.8253034774567 |
| 5 | 1186 | 1165.99165541823 | 20.0083445817674 |
| 6 | 1168 | 1167.61780499704 | 0.382195002960078 |
| 7 | 1142 | 1154.81319283608 | -12.8131928360816 |
| 8 | 1147 | 1171.03032944889 | -24.0303294488864 |
| 9 | 1183 | 1177.96934463632 | 5.03065536368038 |
| 10 | 1149 | 1180.06086500942 | -31.0608650094182 |
| 11 | 1197 | 1183.78203760273 | 13.2179623972652 |
| 12 | 1210 | 1182.32266964576 | 27.6773303542369 |
| 13 | 1206 | 1189.52225289098 | 16.4777471090151 |
| 14 | 1196 | 1178.52850503226 | 17.4714949677406 |
| 15 | 1190 | 1179.09782176883 | 10.9021782311746 |
| 16 | 1175 | 1173.68923941115 | 1.31076058884796 |
| 17 | 1186 | 1175.71943452325 | 10.2805654767527 |
| 18 | 1172 | 1169.98892630906 | 2.0110736909449 |
| 19 | 1152 | 1151.42246496636 | 0.577535033641707 |
| 20 | 1154 | 1153.07837709457 | 0.921622905426048 |
| 21 | 1168 | 1166.9393432176 | 1.06065678239519 |
| 22 | 1180 | 1176.36409025215 | 3.63590974784562 |
| 23 | 1169 | 1164.90641694224 | 4.09358305775873 |
| 24 | 1166 | 1170.2165513876 | -4.21655138759886 |
| 25 | 1177 | 1171.66071740625 | 5.33928259375086 |
| 26 | 1168 | 1163.87179448684 | 4.12820551316208 |
| 27 | 1160 | 1160.20101933576 | -0.201019335756171 |
| 28 | 1147 | 1156.07650468771 | -9.07650468771363 |
| 29 | 1161 | 1162.90945764893 | -1.90945764893342 |
| 30 | 1143 | 1154.30087135125 | -11.3008713512478 |
| 31 | 1161 | 1168.59316867548 | -7.59316867548226 |
| 32 | 1161 | 1171.83592028198 | -10.8359202819783 |
| 33 | 1168 | 1160.45966024615 | 7.54033975385421 |
| 34 | 1172 | 1174.73540473644 | -2.73540473644049 |
| Goldfeld-Quandt test for Heteroskedasticity | |||
| p-values | Alternative Hypothesis | ||
| breakpoint index | greater | 2-sided | less |
| 8 | 0.407066172950948 | 0.814132345901896 | 0.592933827049052 |
| 9 | 0.982318295814896 | 0.035363408370208 | 0.017681704185104 |
| 10 | 0.999966277657282 | 6.74446854360432e-05 | 3.37223427180216e-05 |
| 11 | 0.999997519988618 | 4.96002276374875e-06 | 2.48001138187437e-06 |
| 12 | 0.999999696824286 | 6.06351428684862e-07 | 3.03175714342431e-07 |
| 13 | 0.999998586121377 | 2.82775724619403e-06 | 1.41387862309702e-06 |
| 14 | 0.999997453513394 | 5.09297321289104e-06 | 2.54648660644552e-06 |
| 15 | 0.999995152325601 | 9.69534879741558e-06 | 4.84767439870779e-06 |
| 16 | 0.999981467722651 | 3.70645546988736e-05 | 1.85322773494368e-05 |
| 17 | 0.9999704603251 | 5.90793498010933e-05 | 2.95396749005466e-05 |
| 18 | 0.99990393952339 | 0.000192120953220843 | 9.60604766104214e-05 |
| 19 | 0.999719737583744 | 0.000560524832511567 | 0.000280262416255783 |
| 20 | 0.99928111779294 | 0.00143776441411986 | 0.000718882207059929 |
| 21 | 0.998858122290059 | 0.00228375541988186 | 0.00114187770994093 |
| 22 | 0.99656095527344 | 0.00687808945312011 | 0.00343904472656006 |
| 23 | 0.989795545182368 | 0.0204089096352646 | 0.0102044548176323 |
| 24 | 0.989998509991615 | 0.0200029800167709 | 0.0100014900083855 |
| 25 | 0.973773467833153 | 0.0524530643336932 | 0.0262265321668466 |
| 26 | 0.925002020872196 | 0.149995958255608 | 0.0749979791278038 |
| Meta Analysis of Goldfeld-Quandt test for Heteroskedasticity | |||
| Description | # significant tests | % significant tests | OK/NOK |
| 1% type I error level | 13 | 0.684210526315789 | NOK |
| 5% type I error level | 16 | 0.842105263157895 | NOK |
| 10% type I error level | 17 | 0.894736842105263 | NOK |