| Multiple Linear Regression - Estimated Regression Equation |
| Time[t] = + 471.725413325326 + 0.524500107461251Sunset[t] -13.4669448927732Rain[t] + 6.33441483921043T[t] + 0.710215219254356H[t] -0.1216884573377`T^2`[t] -0.00910865774614004`H^2`[t] + e[t] |
| Multiple Linear Regression - Ordinary Least Squares | |||||
| Variable | Parameter | S.D. | T-STAT H0: parameter = 0 | 2-tail p-value | 1-tail p-value |
| (Intercept) | 471.725413325326 | 235.339505 | 2.0044 | 0.055146 | 0.027573 |
| Sunset | 0.524500107461251 | 0.19989 | 2.6239 | 0.014125 | 0.007063 |
| Rain | -13.4669448927732 | 7.49586 | -1.7966 | 0.083599 | 0.0418 |
| T | 6.33441483921043 | 2.735829 | 2.3154 | 0.028431 | 0.014216 |
| H | 0.710215219254356 | 0.869048 | 0.8172 | 0.420948 | 0.210474 |
| `T^2` | -0.1216884573377 | 0.059559 | -2.0432 | 0.050908 | 0.025454 |
| `H^2` | -0.00910865774614004 | 0.007281 | -1.2511 | 0.221638 | 0.110819 |
| Multiple Linear Regression - Regression Statistics | |
| Multiple R | 0.770138459397939 |
| R-squared | 0.59311324664383 |
| Adjusted R-squared | 0.502693968120237 |
| F-TEST (value) | 6.55958835691294 |
| F-TEST (DF numerator) | 6 |
| F-TEST (DF denominator) | 27 |
| p-value | 0.000232145878630852 |
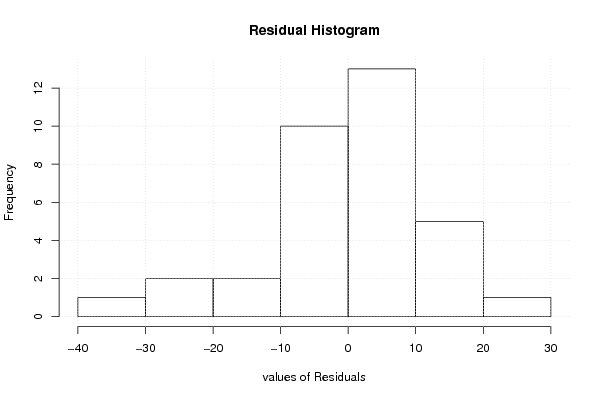
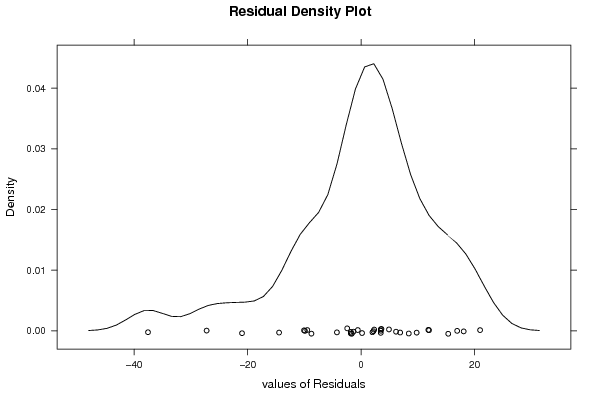
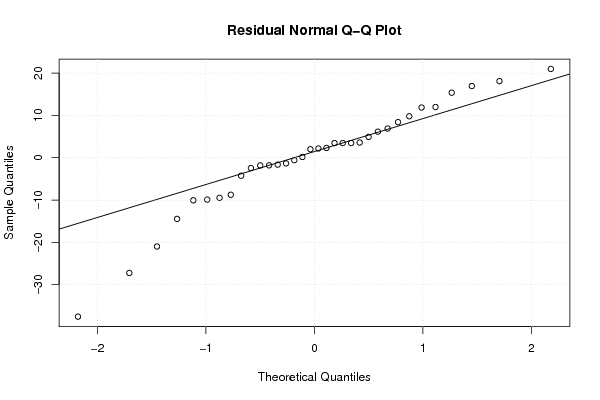
| Multiple Linear Regression - Residual Statistics | |
| Residual Standard Deviation | 13.7687077962109 |
| Sum Squared Residuals | 5118.58748819081 |
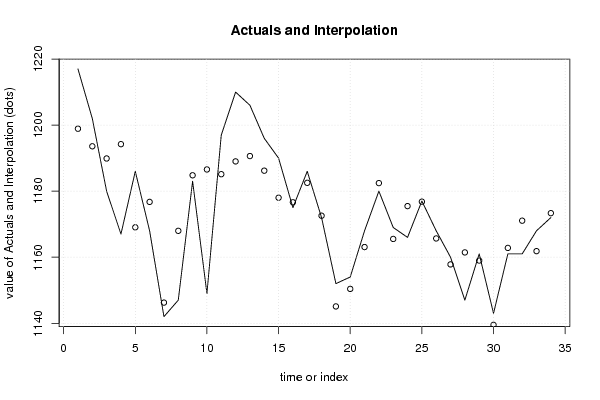
| Multiple Linear Regression - Actuals, Interpolation, and Residuals | |||
| Time or Index | Actuals | Interpolation Forecast | Residuals Prediction Error |
| 1 | 1217 | 1198.89877894454 | 18.1012210554633 |
| 2 | 1202 | 1193.58393738592 | 8.41606261408323 |
| 3 | 1180 | 1189.88733867339 | -9.88733867338617 |
| 4 | 1167 | 1194.22802278461 | -27.2280227846089 |
| 5 | 1186 | 1169.05054625262 | 16.9494537473832 |
| 6 | 1168 | 1176.74696940138 | -8.74696940138205 |
| 7 | 1142 | 1146.25036577079 | -4.2503657707863 |
| 8 | 1147 | 1167.9842315444 | -20.984231544397 |
| 9 | 1183 | 1184.80167766553 | -1.80167766553273 |
| 10 | 1149 | 1186.56209417393 | -37.5620941739279 |
| 11 | 1197 | 1185.12811633282 | 11.8718836671776 |
| 12 | 1210 | 1189.01177411632 | 20.9882258836779 |
| 13 | 1206 | 1190.62704874791 | 15.3729512520879 |
| 14 | 1196 | 1186.19313198255 | 9.80686801744578 |
| 15 | 1190 | 1178.01150646946 | 11.9884935305413 |
| 16 | 1175 | 1176.62991304667 | -1.62991304667293 |
| 17 | 1186 | 1182.52333515678 | 3.476664843221 |
| 18 | 1172 | 1172.56371389847 | -0.563713898472788 |
| 19 | 1152 | 1145.09788184302 | 6.90211815697789 |
| 20 | 1154 | 1150.40336516626 | 3.59663483374073 |
| 21 | 1168 | 1163.07346407338 | 4.92653592661806 |
| 22 | 1180 | 1182.4382606076 | -2.4382606075958 |
| 23 | 1169 | 1165.52280389219 | 3.47719610781178 |
| 24 | 1166 | 1175.47142207228 | -9.47142207227843 |
| 25 | 1177 | 1176.81925395654 | 0.180746043460023 |
| 26 | 1168 | 1165.68023787995 | 2.31976212004574 |
| 27 | 1160 | 1157.81648898001 | 2.18351101999223 |
| 28 | 1147 | 1161.45087156593 | -14.4508715659334 |
| 29 | 1161 | 1158.99056796184 | 2.00943203816043 |
| 30 | 1143 | 1139.52525102026 | 3.47474897973528 |
| 31 | 1161 | 1162.80709022385 | -1.80709022384737 |
| 32 | 1161 | 1171.05443430347 | -10.0544343034684 |
| 33 | 1168 | 1161.83217269522 | 6.16782730478245 |
| 34 | 1172 | 1173.33393141012 | -1.33393141011554 |
| Goldfeld-Quandt test for Heteroskedasticity | |||
| p-values | Alternative Hypothesis | ||
| breakpoint index | greater | 2-sided | less |
| 10 | 0.997912015118574 | 0.00417596976285132 | 0.00208798488142566 |
| 11 | 0.999973187069812 | 5.36258603761428e-05 | 2.68129301880714e-05 |
| 12 | 0.999984385574702 | 3.12288505953448e-05 | 1.56144252976724e-05 |
| 13 | 0.999974742481444 | 5.05150371127909e-05 | 2.52575185563955e-05 |
| 14 | 0.99996884324701 | 6.23135059801376e-05 | 3.11567529900688e-05 |
| 15 | 0.999966542719505 | 6.69145609905689e-05 | 3.34572804952844e-05 |
| 16 | 0.999929468887743 | 0.000141062224513326 | 7.05311122566629e-05 |
| 17 | 0.999857023379315 | 0.000285953241370285 | 0.000142976620685143 |
| 18 | 0.999519789520365 | 0.000960420959270848 | 0.000480210479635424 |
| 19 | 0.998470809937601 | 0.0030583801247972 | 0.0015291900623986 |
| 20 | 0.99815549983857 | 0.0036890003228608 | 0.0018445001614304 |
| 21 | 0.994235940730441 | 0.0115281185391174 | 0.00576405926955872 |
| 22 | 0.986637777902928 | 0.026724444194145 | 0.0133622220970725 |
| 23 | 0.974170981339099 | 0.0516580373218017 | 0.0258290186609009 |
| 24 | 0.97461696017531 | 0.0507660796493806 | 0.0253830398246903 |
| Meta Analysis of Goldfeld-Quandt test for Heteroskedasticity | |||
| Description | # significant tests | % significant tests | OK/NOK |
| 1% type I error level | 11 | 0.733333333333333 | NOK |
| 5% type I error level | 13 | 0.866666666666667 | NOK |
| 10% type I error level | 15 | 1 | NOK |