| Multiple Linear Regression - Estimated Regression Equation |
| Time[t] = + 334.098988484479 + 0.518791686932565Sunset[t] + 6.68021081402233T[t] + 1.480973757804H[t] -0.106900150895852`T^2`[t] -0.0140914830828158`H^2`[t] -2.03629874989499Dewpoint[t] + 4.19325585866879Pressure[t] + 0.0163565845795424TxH[t] -1.83300479004516Visibility[t] -13.740393697781Rain[t] + e[t] |
| Multiple Linear Regression - Ordinary Least Squares | |||||
| Variable | Parameter | S.D. | T-STAT H0: parameter = 0 | 2-tail p-value | 1-tail p-value |
| (Intercept) | 334.098988484479 | 618.211333 | 0.5404 | 0.594097 | 0.297048 |
| Sunset | 0.518791686932565 | 0.224312 | 2.3128 | 0.030027 | 0.015013 |
| T | 6.68021081402233 | 7.470964 | 0.8942 | 0.3805 | 0.19025 |
| H | 1.480973757804 | 2.279789 | 0.6496 | 0.52238 | 0.26119 |
| `T^2` | -0.106900150895852 | 0.090168 | -1.1856 | 0.247897 | 0.123949 |
| `H^2` | -0.0140914830828158 | 0.010065 | -1.4 | 0.17486 | 0.08743 |
| Dewpoint | -2.03629874989499 | 2.977672 | -0.6839 | 0.500899 | 0.250449 |
| Pressure | 4.19325585866879 | 15.017784 | 0.2792 | 0.782572 | 0.391286 |
| TxH | 0.0163565845795424 | 0.048117 | 0.3399 | 0.736991 | 0.368496 |
| Visibility | -1.83300479004516 | 2.893244 | -0.6335 | 0.532627 | 0.266313 |
| Rain | -13.740393697781 | 8.028928 | -1.7114 | 0.100469 | 0.050235 |
| Multiple Linear Regression - Regression Statistics | |
| Multiple R | 0.789376487884753 |
| R-squared | 0.623115239625268 |
| Adjusted R-squared | 0.459252300331906 |
| F-TEST (value) | 3.80266118935967 |
| F-TEST (DF numerator) | 10 |
| F-TEST (DF denominator) | 23 |
| p-value | 0.00389413488510493 |
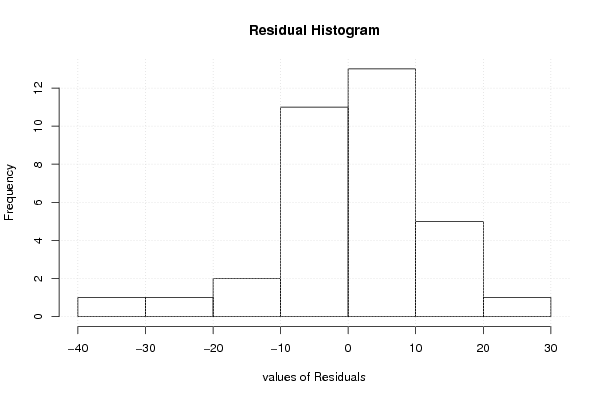
| Multiple Linear Regression - Residual Statistics | |
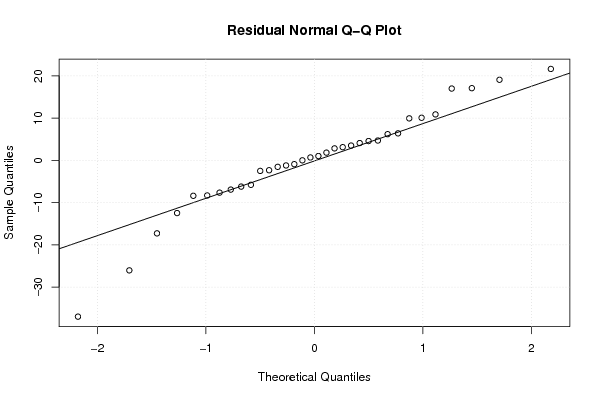
| Residual Standard Deviation | 14.3574945527332 |
| Sum Squared Residuals | 4741.16594613057 |
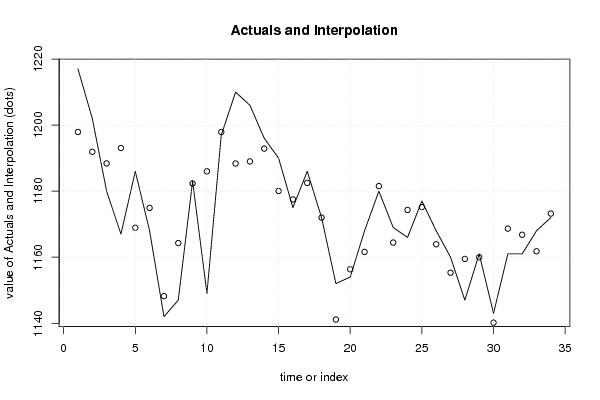
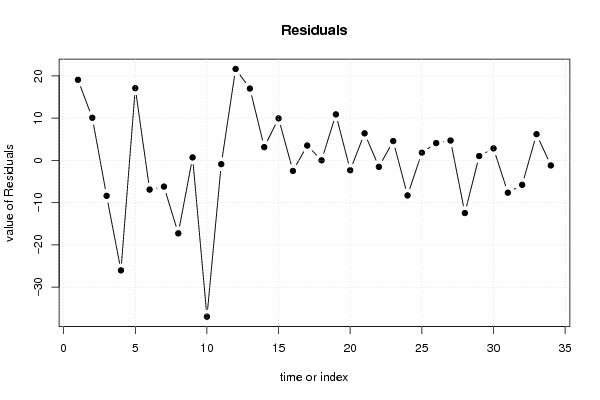
| Multiple Linear Regression - Actuals, Interpolation, and Residuals | |||
| Time or Index | Actuals | Interpolation Forecast | Residuals Prediction Error |
| 1 | 1217 | 1197.92893271441 | 19.0710672855877 |
| 2 | 1202 | 1191.91995395515 | 10.080046044853 |
| 3 | 1180 | 1188.39475239354 | -8.39475239353605 |
| 4 | 1167 | 1193.04400951491 | -26.044009514909 |
| 5 | 1186 | 1168.91778012607 | 17.0822198739253 |
| 6 | 1168 | 1174.92322778128 | -6.92322778127705 |
| 7 | 1142 | 1148.21642246116 | -6.21642246115539 |
| 8 | 1147 | 1164.28050408418 | -17.2805040841799 |
| 9 | 1183 | 1182.31847383982 | 0.681526160180086 |
| 10 | 1149 | 1186.00108675669 | -37.0010867566938 |
| 11 | 1197 | 1197.90745068825 | -0.907450688250221 |
| 12 | 1210 | 1188.36654281996 | 21.6334571800432 |
| 13 | 1206 | 1189.00390224585 | 16.9960977541508 |
| 14 | 1196 | 1192.88230125806 | 3.11769874193793 |
| 15 | 1190 | 1180.05802311127 | 9.94197688872947 |
| 16 | 1175 | 1177.50131770043 | -2.50131770042502 |
| 17 | 1186 | 1182.49800846857 | 3.50199153142783 |
| 18 | 1172 | 1171.99245876701 | 0.00754123298872701 |
| 19 | 1152 | 1141.12216893531 | 10.8778310646913 |
| 20 | 1154 | 1156.34366249853 | -2.34366249852765 |
| 21 | 1168 | 1161.60571238099 | 6.39428761901156 |
| 22 | 1180 | 1181.53875635784 | -1.53875635783599 |
| 23 | 1169 | 1164.43280312214 | 4.56719687785506 |
| 24 | 1166 | 1174.31421945278 | -8.3142194527777 |
| 25 | 1177 | 1175.17965298342 | 1.82034701658116 |
| 26 | 1168 | 1163.91226567988 | 4.08773432011619 |
| 27 | 1160 | 1155.30872651299 | 4.6912734870064 |
| 28 | 1147 | 1159.47673819766 | -12.4767381976565 |
| 29 | 1161 | 1159.98124429584 | 1.01875570416145 |
| 30 | 1143 | 1140.16763706247 | 2.83236293752661 |
| 31 | 1161 | 1168.65100070642 | -7.65100070641982 |
| 32 | 1161 | 1166.79446128859 | -5.79446128859303 |
| 33 | 1168 | 1161.80542632208 | 6.19457367791888 |
| 34 | 1172 | 1173.21037551646 | -1.21037551645543 |
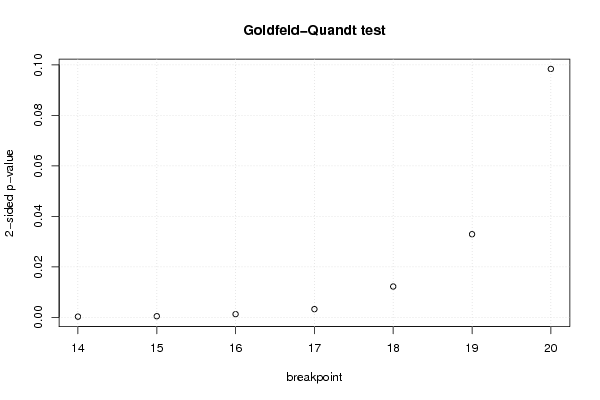
| Goldfeld-Quandt test for Heteroskedasticity | |||
| p-values | Alternative Hypothesis | ||
| breakpoint index | greater | 2-sided | less |
| 14 | 0.999865470157484 | 0.000269059685031802 | 0.000134529842515901 |
| 15 | 0.999780642249719 | 0.000438715500561694 | 0.000219357750280847 |
| 16 | 0.999372767479902 | 0.0012544650401959 | 0.000627232520097948 |
| 17 | 0.998377100529479 | 0.00324579894104253 | 0.00162289947052127 |
| 18 | 0.993899849581766 | 0.012200300836468 | 0.00610015041823399 |
| 19 | 0.983535330022557 | 0.0329293399548853 | 0.0164646699774427 |
| 20 | 0.95080878004846 | 0.098382439903079 | 0.0491912199515395 |
| Meta Analysis of Goldfeld-Quandt test for Heteroskedasticity | |||
| Description | # significant tests | % significant tests | OK/NOK |
| 1% type I error level | 4 | 0.571428571428571 | NOK |
| 5% type I error level | 6 | 0.857142857142857 | NOK |
| 10% type I error level | 7 | 1 | NOK |