Free Statistics

of Irreproducible Research!

Author's title

Author*Unverified author*
R Software Modulerwasp_centraltendency.wasp
Title produced by softwareCentral Tendency
Date of computationWed, 07 Mar 2012 11:45:51 -0500
Cite this page as followsStatistical Computations at FreeStatistics.org, Office for Research Development and Education, URL https://freestatistics.org/blog/index.php?v=date/2012/Mar/07/t1331138868i00yr0oe85uy5fz.htm/, Retrieved Sun, 28 Apr 2024 22:35:30 +0000
Statistical Computations at FreeStatistics.org, Office for Research Development and Education, URL https://freestatistics.org/blog/index.php?pk=163664, Retrieved Sun, 28 Apr 2024 22:35:30 +0000
QR Codes:

Original text written by user:
IsPrivate?No (this computation is public)
User-defined keywordsKDG2011W52a
Estimated Impact95
Family? (F = Feedback message, R = changed R code, M = changed R Module, P = changed Parameters, D = changed Data)
-     [Central Tendency] [Maximumprijs 2005...] [2012-03-07 15:51:50] [72f83af8b2d235eee2a77209b5e4ee2e]
-    D    [Central Tendency] [Centrummaten Niet...] [2012-03-07 16:45:51] [63e5472dd76b3a4c96d1871cde01ebd5] [Current]
Feedback Forum

Post a new message
Dataseries X:
125326
122716
116615
113719
110737
112093
143565
149946
149147
134339
122683
115614
116566
111272
104609
101802
94542
93051
124129
130374
123946
114971
105531
104919
104782
101281
94545
93248
84031
87486
115867
120327
117008
108811
104519
106758
109337
109078
108293
106534
99197
103493
130676
137448
134704
123725
118277
121225
120528
118240
112514
107304
100001
102082
130455
135574
132540
119920
112454
109415
109843
106365
102304
97968
92462
92286
120092
126656
124144
114045
108120
105698


Summary of computational transaction
Raw Inputview raw input (R code)
Raw Outputview raw output of R engine
Computing time1 seconds
R Server'Herman Ole Andreas Wold' @ wold.wessa.net

\begin{tabular}{lllllllll}
\hline
Summary of computational transaction \tabularnewline
Raw Input & view raw input (R code)  \tabularnewline
Raw Output & view raw output of R engine  \tabularnewline
Computing time & 1 seconds \tabularnewline
R Server & 'Herman Ole Andreas Wold' @ wold.wessa.net \tabularnewline
\hline
\end{tabular}
%Source: https://freestatistics.org/blog/index.php?pk=163664&T=0

[TABLE]
[ROW][C]Summary of computational transaction[/C][/ROW]
[ROW][C]Raw Input[/C][C]view raw input (R code) [/C][/ROW]
[ROW][C]Raw Output[/C][C]view raw output of R engine [/C][/ROW]
[ROW][C]Computing time[/C][C]1 seconds[/C][/ROW]
[ROW][C]R Server[/C][C]'Herman Ole Andreas Wold' @ wold.wessa.net[/C][/ROW]
[/TABLE]
Source: https://freestatistics.org/blog/index.php?pk=163664&T=0

Globally Unique Identifier (entire table): ba.freestatistics.org/blog/index.php?pk=163664&T=0

As an alternative you can also use a QR Code:  

The GUIDs for individual cells are displayed in the table below:

Summary of computational transaction
Raw Inputview raw input (R code)
Raw Outputview raw output of R engine
Computing time1 seconds
R Server'Herman Ole Andreas Wold' @ wold.wessa.net


Central Tendency - Ungrouped Data
MeasureValueS.E.Value/S.E.
Arithmetic Mean113664.8888888891652.5563310965868.7812492379394
Geometric Mean112824.357956476
Harmonic Mean111994.137038103
Quadratic Mean114514.644820967
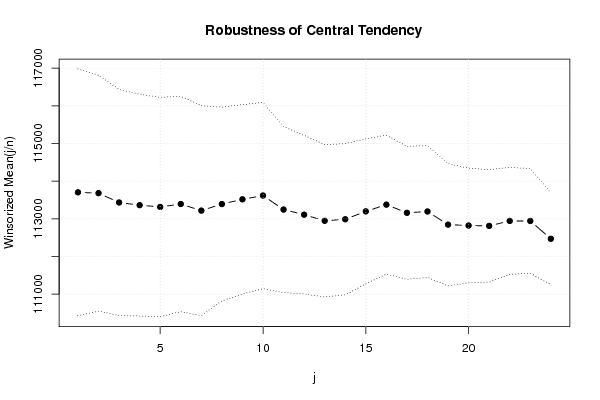
Winsorized Mean ( 1 / 24 )113701.7777777781637.6767337306769.4287067990289
Winsorized Mean ( 2 / 24 )113680.0555555561565.2168005058172.6289517968496
Winsorized Mean ( 3 / 24 )113432.5138888891500.6787767797375.5874712457127
Winsorized Mean ( 4 / 24 )113361.1251471.4701467501177.0393645092761
Winsorized Mean ( 5 / 24 )113314.3888888891456.1392223550977.8183755709976
Winsorized Mean ( 6 / 24 )113391.8055555561429.3701676437179.3299091602562
Winsorized Mean ( 7 / 24 )113217.1944444441394.1818522080181.2069058746808
Winsorized Mean ( 8 / 24 )113390.4166666671286.2021528488388.1590941326888
Winsorized Mean ( 9 / 24 )113516.4166666671255.6458564122990.4048033025912
Winsorized Mean ( 10 / 24 )113616.8333333331235.8687954542291.9327632117903
Winsorized Mean ( 11 / 24 )113244.3611111111102.52281820992102.713847950084
Winsorized Mean ( 12 / 24 )113109.5277777781052.18036046286107.500132133259
Winsorized Mean ( 13 / 24 )112946.6666666671010.40436287945111.783629224236
Winsorized Mean ( 14 / 24 )112986.9166666671003.44344706971112.599187325021
Winsorized Mean ( 15 / 24 )113196.5961.258780391368117.758612258307
Winsorized Mean ( 16 / 24 )113375.388888889921.858609332671122.985659342012
Winsorized Mean ( 17 / 24 )113158.402777778881.939005095484128.306381874477
Winsorized Mean ( 18 / 24 )113193.402777778874.797930984444129.39377057099
Winsorized Mean ( 19 / 24 )112844.805555556812.475204542536138.890153108233
Winsorized Mean ( 20 / 24 )112821.194444444761.456083585661148.16507068034
Winsorized Mean ( 21 / 24 )112811.277777778746.568688350221151.106361059784
Winsorized Mean ( 22 / 24 )112943.277777778709.38872306767159.212113338041
Winsorized Mean ( 23 / 24 )112942.319444444694.56881300852162.607818446722
Winsorized Mean ( 24 / 24 )112469.319444444609.146079954504184.634397471366
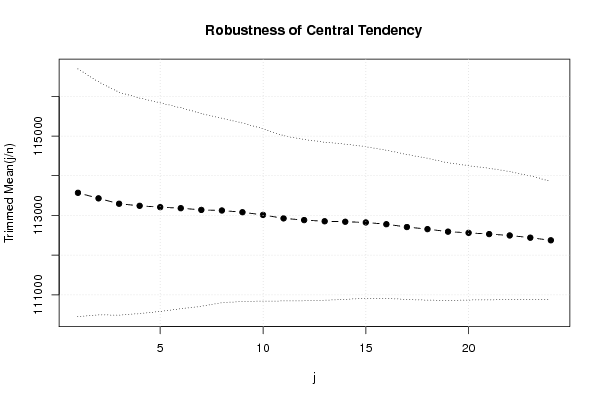
Trimmed Mean ( 1 / 24 )113569.9285714291560.7411888324772.7666632905267
Trimmed Mean ( 2 / 24 )113430.3235294121467.9810184761677.2696118694764
Trimmed Mean ( 3 / 24 )113294.1060606061404.4243820210880.6694240793277
Trimmed Mean ( 4 / 24 )113242.2031251358.766912282883.3418904311905
Trimmed Mean ( 5 / 24 )113207.6774193551314.7660632386386.1048064630552
Trimmed Mean ( 6 / 24 )113182.0666666671266.3710224856489.3751236067546
Trimmed Mean ( 7 / 24 )113138.6724137931215.1873646266193.1038913892565
Trimmed Mean ( 8 / 24 )113124.251162.1405128429697.3412842507849
Trimmed Mean ( 9 / 24 )113079.8888888891124.94665629154100.520223120325
Trimmed Mean ( 10 / 24 )113012.7307692311085.870384087104.075709610823
Trimmed Mean ( 11 / 24 )112925.741041.1756411688108.459836683494
Trimmed Mean ( 12 / 24 )112882.2916666671016.63988859558111.034686847283
Trimmed Mean ( 13 / 24 )112852.652173913996.138602882184113.290110279222
Trimmed Mean ( 14 / 24 )112840.818181818978.234871770319115.35145744458
Trimmed Mean ( 15 / 24 )112822.928571429955.476909574679118.080225111511
Trimmed Mean ( 16 / 24 )112778.1934.120091110016120.731907035621
Trimmed Mean ( 17 / 24 )112707.368421053913.385474365021123.395183725038
Trimmed Mean ( 18 / 24 )112654.305555556894.041222567456126.00571731138
Trimmed Mean ( 19 / 24 )112590.882352941867.539783452561129.781808858219
Trimmed Mean ( 20 / 24 )112560.8125846.607829761994132.95508090404
Trimmed Mean ( 21 / 24 )112529.566666667829.130017234286135.72004912092
Trimmed Mean ( 22 / 24 )112495.071428571805.555808859136139.649010275144
Trimmed Mean ( 23 / 24 )112438.653846154779.753201472813144.197745688992
Trimmed Mean ( 24 / 24 )112372.958333333742.438606936253151.356566433219
Median112273.5
Midrange116988.5
Midmean - Weighted Average at Xnp112436.864864865
Midmean - Weighted Average at X(n+1)p112654.305555556
Midmean - Empirical Distribution Function112436.864864865
Midmean - Empirical Distribution Function - Averaging112654.305555556
Midmean - Empirical Distribution Function - Interpolation112654.305555556
Midmean - Closest Observation112436.864864865
Midmean - True Basic - Statistics Graphics Toolkit112654.305555556
Midmean - MS Excel (old versions)112707.368421053
Number of observations72

\begin{tabular}{lllllllll}
\hline
Central Tendency - Ungrouped Data \tabularnewline
Measure & Value & S.E. & Value/S.E. \tabularnewline
Arithmetic Mean & 113664.888888889 & 1652.55633109658 & 68.7812492379394 \tabularnewline
Geometric Mean & 112824.357956476 &  &  \tabularnewline
Harmonic Mean & 111994.137038103 &  &  \tabularnewline
Quadratic Mean & 114514.644820967 &  &  \tabularnewline
Winsorized Mean ( 1 / 24 ) & 113701.777777778 & 1637.67673373067 & 69.4287067990289 \tabularnewline
Winsorized Mean ( 2 / 24 ) & 113680.055555556 & 1565.21680050581 & 72.6289517968496 \tabularnewline
Winsorized Mean ( 3 / 24 ) & 113432.513888889 & 1500.67877677973 & 75.5874712457127 \tabularnewline
Winsorized Mean ( 4 / 24 ) & 113361.125 & 1471.47014675011 & 77.0393645092761 \tabularnewline
Winsorized Mean ( 5 / 24 ) & 113314.388888889 & 1456.13922235509 & 77.8183755709976 \tabularnewline
Winsorized Mean ( 6 / 24 ) & 113391.805555556 & 1429.37016764371 & 79.3299091602562 \tabularnewline
Winsorized Mean ( 7 / 24 ) & 113217.194444444 & 1394.18185220801 & 81.2069058746808 \tabularnewline
Winsorized Mean ( 8 / 24 ) & 113390.416666667 & 1286.20215284883 & 88.1590941326888 \tabularnewline
Winsorized Mean ( 9 / 24 ) & 113516.416666667 & 1255.64585641229 & 90.4048033025912 \tabularnewline
Winsorized Mean ( 10 / 24 ) & 113616.833333333 & 1235.86879545422 & 91.9327632117903 \tabularnewline
Winsorized Mean ( 11 / 24 ) & 113244.361111111 & 1102.52281820992 & 102.713847950084 \tabularnewline
Winsorized Mean ( 12 / 24 ) & 113109.527777778 & 1052.18036046286 & 107.500132133259 \tabularnewline
Winsorized Mean ( 13 / 24 ) & 112946.666666667 & 1010.40436287945 & 111.783629224236 \tabularnewline
Winsorized Mean ( 14 / 24 ) & 112986.916666667 & 1003.44344706971 & 112.599187325021 \tabularnewline
Winsorized Mean ( 15 / 24 ) & 113196.5 & 961.258780391368 & 117.758612258307 \tabularnewline
Winsorized Mean ( 16 / 24 ) & 113375.388888889 & 921.858609332671 & 122.985659342012 \tabularnewline
Winsorized Mean ( 17 / 24 ) & 113158.402777778 & 881.939005095484 & 128.306381874477 \tabularnewline
Winsorized Mean ( 18 / 24 ) & 113193.402777778 & 874.797930984444 & 129.39377057099 \tabularnewline
Winsorized Mean ( 19 / 24 ) & 112844.805555556 & 812.475204542536 & 138.890153108233 \tabularnewline
Winsorized Mean ( 20 / 24 ) & 112821.194444444 & 761.456083585661 & 148.16507068034 \tabularnewline
Winsorized Mean ( 21 / 24 ) & 112811.277777778 & 746.568688350221 & 151.106361059784 \tabularnewline
Winsorized Mean ( 22 / 24 ) & 112943.277777778 & 709.38872306767 & 159.212113338041 \tabularnewline
Winsorized Mean ( 23 / 24 ) & 112942.319444444 & 694.56881300852 & 162.607818446722 \tabularnewline
Winsorized Mean ( 24 / 24 ) & 112469.319444444 & 609.146079954504 & 184.634397471366 \tabularnewline
Trimmed Mean ( 1 / 24 ) & 113569.928571429 & 1560.74118883247 & 72.7666632905267 \tabularnewline
Trimmed Mean ( 2 / 24 ) & 113430.323529412 & 1467.98101847616 & 77.2696118694764 \tabularnewline
Trimmed Mean ( 3 / 24 ) & 113294.106060606 & 1404.42438202108 & 80.6694240793277 \tabularnewline
Trimmed Mean ( 4 / 24 ) & 113242.203125 & 1358.7669122828 & 83.3418904311905 \tabularnewline
Trimmed Mean ( 5 / 24 ) & 113207.677419355 & 1314.76606323863 & 86.1048064630552 \tabularnewline
Trimmed Mean ( 6 / 24 ) & 113182.066666667 & 1266.37102248564 & 89.3751236067546 \tabularnewline
Trimmed Mean ( 7 / 24 ) & 113138.672413793 & 1215.18736462661 & 93.1038913892565 \tabularnewline
Trimmed Mean ( 8 / 24 ) & 113124.25 & 1162.14051284296 & 97.3412842507849 \tabularnewline
Trimmed Mean ( 9 / 24 ) & 113079.888888889 & 1124.94665629154 & 100.520223120325 \tabularnewline
Trimmed Mean ( 10 / 24 ) & 113012.730769231 & 1085.870384087 & 104.075709610823 \tabularnewline
Trimmed Mean ( 11 / 24 ) & 112925.74 & 1041.1756411688 & 108.459836683494 \tabularnewline
Trimmed Mean ( 12 / 24 ) & 112882.291666667 & 1016.63988859558 & 111.034686847283 \tabularnewline
Trimmed Mean ( 13 / 24 ) & 112852.652173913 & 996.138602882184 & 113.290110279222 \tabularnewline
Trimmed Mean ( 14 / 24 ) & 112840.818181818 & 978.234871770319 & 115.35145744458 \tabularnewline
Trimmed Mean ( 15 / 24 ) & 112822.928571429 & 955.476909574679 & 118.080225111511 \tabularnewline
Trimmed Mean ( 16 / 24 ) & 112778.1 & 934.120091110016 & 120.731907035621 \tabularnewline
Trimmed Mean ( 17 / 24 ) & 112707.368421053 & 913.385474365021 & 123.395183725038 \tabularnewline
Trimmed Mean ( 18 / 24 ) & 112654.305555556 & 894.041222567456 & 126.00571731138 \tabularnewline
Trimmed Mean ( 19 / 24 ) & 112590.882352941 & 867.539783452561 & 129.781808858219 \tabularnewline
Trimmed Mean ( 20 / 24 ) & 112560.8125 & 846.607829761994 & 132.95508090404 \tabularnewline
Trimmed Mean ( 21 / 24 ) & 112529.566666667 & 829.130017234286 & 135.72004912092 \tabularnewline
Trimmed Mean ( 22 / 24 ) & 112495.071428571 & 805.555808859136 & 139.649010275144 \tabularnewline
Trimmed Mean ( 23 / 24 ) & 112438.653846154 & 779.753201472813 & 144.197745688992 \tabularnewline
Trimmed Mean ( 24 / 24 ) & 112372.958333333 & 742.438606936253 & 151.356566433219 \tabularnewline
Median & 112273.5 &  &  \tabularnewline
Midrange & 116988.5 &  &  \tabularnewline
Midmean - Weighted Average at Xnp & 112436.864864865 &  &  \tabularnewline
Midmean - Weighted Average at X(n+1)p & 112654.305555556 &  &  \tabularnewline
Midmean - Empirical Distribution Function & 112436.864864865 &  &  \tabularnewline
Midmean - Empirical Distribution Function - Averaging & 112654.305555556 &  &  \tabularnewline
Midmean - Empirical Distribution Function - Interpolation & 112654.305555556 &  &  \tabularnewline
Midmean - Closest Observation & 112436.864864865 &  &  \tabularnewline
Midmean - True Basic - Statistics Graphics Toolkit & 112654.305555556 &  &  \tabularnewline
Midmean - MS Excel (old versions) & 112707.368421053 &  &  \tabularnewline
Number of observations & 72 &  &  \tabularnewline
\hline
\end{tabular}
%Source: https://freestatistics.org/blog/index.php?pk=163664&T=1

[TABLE]
[ROW][C]Central Tendency - Ungrouped Data[/C][/ROW]
[ROW][C]Measure[/C][C]Value[/C][C]S.E.[/C][C]Value/S.E.[/C][/ROW]
[ROW][C]Arithmetic Mean[/C][C]113664.888888889[/C][C]1652.55633109658[/C][C]68.7812492379394[/C][/ROW]
[ROW][C]Geometric Mean[/C][C]112824.357956476[/C][C][/C][C][/C][/ROW]
[ROW][C]Harmonic Mean[/C][C]111994.137038103[/C][C][/C][C][/C][/ROW]
[ROW][C]Quadratic Mean[/C][C]114514.644820967[/C][C][/C][C][/C][/ROW]
[ROW][C]Winsorized Mean ( 1 / 24 )[/C][C]113701.777777778[/C][C]1637.67673373067[/C][C]69.4287067990289[/C][/ROW]
[ROW][C]Winsorized Mean ( 2 / 24 )[/C][C]113680.055555556[/C][C]1565.21680050581[/C][C]72.6289517968496[/C][/ROW]
[ROW][C]Winsorized Mean ( 3 / 24 )[/C][C]113432.513888889[/C][C]1500.67877677973[/C][C]75.5874712457127[/C][/ROW]
[ROW][C]Winsorized Mean ( 4 / 24 )[/C][C]113361.125[/C][C]1471.47014675011[/C][C]77.0393645092761[/C][/ROW]
[ROW][C]Winsorized Mean ( 5 / 24 )[/C][C]113314.388888889[/C][C]1456.13922235509[/C][C]77.8183755709976[/C][/ROW]
[ROW][C]Winsorized Mean ( 6 / 24 )[/C][C]113391.805555556[/C][C]1429.37016764371[/C][C]79.3299091602562[/C][/ROW]
[ROW][C]Winsorized Mean ( 7 / 24 )[/C][C]113217.194444444[/C][C]1394.18185220801[/C][C]81.2069058746808[/C][/ROW]
[ROW][C]Winsorized Mean ( 8 / 24 )[/C][C]113390.416666667[/C][C]1286.20215284883[/C][C]88.1590941326888[/C][/ROW]
[ROW][C]Winsorized Mean ( 9 / 24 )[/C][C]113516.416666667[/C][C]1255.64585641229[/C][C]90.4048033025912[/C][/ROW]
[ROW][C]Winsorized Mean ( 10 / 24 )[/C][C]113616.833333333[/C][C]1235.86879545422[/C][C]91.9327632117903[/C][/ROW]
[ROW][C]Winsorized Mean ( 11 / 24 )[/C][C]113244.361111111[/C][C]1102.52281820992[/C][C]102.713847950084[/C][/ROW]
[ROW][C]Winsorized Mean ( 12 / 24 )[/C][C]113109.527777778[/C][C]1052.18036046286[/C][C]107.500132133259[/C][/ROW]
[ROW][C]Winsorized Mean ( 13 / 24 )[/C][C]112946.666666667[/C][C]1010.40436287945[/C][C]111.783629224236[/C][/ROW]
[ROW][C]Winsorized Mean ( 14 / 24 )[/C][C]112986.916666667[/C][C]1003.44344706971[/C][C]112.599187325021[/C][/ROW]
[ROW][C]Winsorized Mean ( 15 / 24 )[/C][C]113196.5[/C][C]961.258780391368[/C][C]117.758612258307[/C][/ROW]
[ROW][C]Winsorized Mean ( 16 / 24 )[/C][C]113375.388888889[/C][C]921.858609332671[/C][C]122.985659342012[/C][/ROW]
[ROW][C]Winsorized Mean ( 17 / 24 )[/C][C]113158.402777778[/C][C]881.939005095484[/C][C]128.306381874477[/C][/ROW]
[ROW][C]Winsorized Mean ( 18 / 24 )[/C][C]113193.402777778[/C][C]874.797930984444[/C][C]129.39377057099[/C][/ROW]
[ROW][C]Winsorized Mean ( 19 / 24 )[/C][C]112844.805555556[/C][C]812.475204542536[/C][C]138.890153108233[/C][/ROW]
[ROW][C]Winsorized Mean ( 20 / 24 )[/C][C]112821.194444444[/C][C]761.456083585661[/C][C]148.16507068034[/C][/ROW]
[ROW][C]Winsorized Mean ( 21 / 24 )[/C][C]112811.277777778[/C][C]746.568688350221[/C][C]151.106361059784[/C][/ROW]
[ROW][C]Winsorized Mean ( 22 / 24 )[/C][C]112943.277777778[/C][C]709.38872306767[/C][C]159.212113338041[/C][/ROW]
[ROW][C]Winsorized Mean ( 23 / 24 )[/C][C]112942.319444444[/C][C]694.56881300852[/C][C]162.607818446722[/C][/ROW]
[ROW][C]Winsorized Mean ( 24 / 24 )[/C][C]112469.319444444[/C][C]609.146079954504[/C][C]184.634397471366[/C][/ROW]
[ROW][C]Trimmed Mean ( 1 / 24 )[/C][C]113569.928571429[/C][C]1560.74118883247[/C][C]72.7666632905267[/C][/ROW]
[ROW][C]Trimmed Mean ( 2 / 24 )[/C][C]113430.323529412[/C][C]1467.98101847616[/C][C]77.2696118694764[/C][/ROW]
[ROW][C]Trimmed Mean ( 3 / 24 )[/C][C]113294.106060606[/C][C]1404.42438202108[/C][C]80.6694240793277[/C][/ROW]
[ROW][C]Trimmed Mean ( 4 / 24 )[/C][C]113242.203125[/C][C]1358.7669122828[/C][C]83.3418904311905[/C][/ROW]
[ROW][C]Trimmed Mean ( 5 / 24 )[/C][C]113207.677419355[/C][C]1314.76606323863[/C][C]86.1048064630552[/C][/ROW]
[ROW][C]Trimmed Mean ( 6 / 24 )[/C][C]113182.066666667[/C][C]1266.37102248564[/C][C]89.3751236067546[/C][/ROW]
[ROW][C]Trimmed Mean ( 7 / 24 )[/C][C]113138.672413793[/C][C]1215.18736462661[/C][C]93.1038913892565[/C][/ROW]
[ROW][C]Trimmed Mean ( 8 / 24 )[/C][C]113124.25[/C][C]1162.14051284296[/C][C]97.3412842507849[/C][/ROW]
[ROW][C]Trimmed Mean ( 9 / 24 )[/C][C]113079.888888889[/C][C]1124.94665629154[/C][C]100.520223120325[/C][/ROW]
[ROW][C]Trimmed Mean ( 10 / 24 )[/C][C]113012.730769231[/C][C]1085.870384087[/C][C]104.075709610823[/C][/ROW]
[ROW][C]Trimmed Mean ( 11 / 24 )[/C][C]112925.74[/C][C]1041.1756411688[/C][C]108.459836683494[/C][/ROW]
[ROW][C]Trimmed Mean ( 12 / 24 )[/C][C]112882.291666667[/C][C]1016.63988859558[/C][C]111.034686847283[/C][/ROW]
[ROW][C]Trimmed Mean ( 13 / 24 )[/C][C]112852.652173913[/C][C]996.138602882184[/C][C]113.290110279222[/C][/ROW]
[ROW][C]Trimmed Mean ( 14 / 24 )[/C][C]112840.818181818[/C][C]978.234871770319[/C][C]115.35145744458[/C][/ROW]
[ROW][C]Trimmed Mean ( 15 / 24 )[/C][C]112822.928571429[/C][C]955.476909574679[/C][C]118.080225111511[/C][/ROW]
[ROW][C]Trimmed Mean ( 16 / 24 )[/C][C]112778.1[/C][C]934.120091110016[/C][C]120.731907035621[/C][/ROW]
[ROW][C]Trimmed Mean ( 17 / 24 )[/C][C]112707.368421053[/C][C]913.385474365021[/C][C]123.395183725038[/C][/ROW]
[ROW][C]Trimmed Mean ( 18 / 24 )[/C][C]112654.305555556[/C][C]894.041222567456[/C][C]126.00571731138[/C][/ROW]
[ROW][C]Trimmed Mean ( 19 / 24 )[/C][C]112590.882352941[/C][C]867.539783452561[/C][C]129.781808858219[/C][/ROW]
[ROW][C]Trimmed Mean ( 20 / 24 )[/C][C]112560.8125[/C][C]846.607829761994[/C][C]132.95508090404[/C][/ROW]
[ROW][C]Trimmed Mean ( 21 / 24 )[/C][C]112529.566666667[/C][C]829.130017234286[/C][C]135.72004912092[/C][/ROW]
[ROW][C]Trimmed Mean ( 22 / 24 )[/C][C]112495.071428571[/C][C]805.555808859136[/C][C]139.649010275144[/C][/ROW]
[ROW][C]Trimmed Mean ( 23 / 24 )[/C][C]112438.653846154[/C][C]779.753201472813[/C][C]144.197745688992[/C][/ROW]
[ROW][C]Trimmed Mean ( 24 / 24 )[/C][C]112372.958333333[/C][C]742.438606936253[/C][C]151.356566433219[/C][/ROW]
[ROW][C]Median[/C][C]112273.5[/C][C][/C][C][/C][/ROW]
[ROW][C]Midrange[/C][C]116988.5[/C][C][/C][C][/C][/ROW]
[ROW][C]Midmean - Weighted Average at Xnp[/C][C]112436.864864865[/C][C][/C][C][/C][/ROW]
[ROW][C]Midmean - Weighted Average at X(n+1)p[/C][C]112654.305555556[/C][C][/C][C][/C][/ROW]
[ROW][C]Midmean - Empirical Distribution Function[/C][C]112436.864864865[/C][C][/C][C][/C][/ROW]
[ROW][C]Midmean - Empirical Distribution Function - Averaging[/C][C]112654.305555556[/C][C][/C][C][/C][/ROW]
[ROW][C]Midmean - Empirical Distribution Function - Interpolation[/C][C]112654.305555556[/C][C][/C][C][/C][/ROW]
[ROW][C]Midmean - Closest Observation[/C][C]112436.864864865[/C][C][/C][C][/C][/ROW]
[ROW][C]Midmean - True Basic - Statistics Graphics Toolkit[/C][C]112654.305555556[/C][C][/C][C][/C][/ROW]
[ROW][C]Midmean - MS Excel (old versions)[/C][C]112707.368421053[/C][C][/C][C][/C][/ROW]
[ROW][C]Number of observations[/C][C]72[/C][C][/C][C][/C][/ROW]
[/TABLE]
Source: https://freestatistics.org/blog/index.php?pk=163664&T=1

Globally Unique Identifier (entire table): ba.freestatistics.org/blog/index.php?pk=163664&T=1

As an alternative you can also use a QR Code:  

The GUIDs for individual cells are displayed in the table below:

Central Tendency - Ungrouped Data
MeasureValueS.E.Value/S.E.
Arithmetic Mean113664.8888888891652.5563310965868.7812492379394
Geometric Mean112824.357956476
Harmonic Mean111994.137038103
Quadratic Mean114514.644820967
Winsorized Mean ( 1 / 24 )113701.7777777781637.6767337306769.4287067990289
Winsorized Mean ( 2 / 24 )113680.0555555561565.2168005058172.6289517968496
Winsorized Mean ( 3 / 24 )113432.5138888891500.6787767797375.5874712457127
Winsorized Mean ( 4 / 24 )113361.1251471.4701467501177.0393645092761
Winsorized Mean ( 5 / 24 )113314.3888888891456.1392223550977.8183755709976
Winsorized Mean ( 6 / 24 )113391.8055555561429.3701676437179.3299091602562
Winsorized Mean ( 7 / 24 )113217.1944444441394.1818522080181.2069058746808
Winsorized Mean ( 8 / 24 )113390.4166666671286.2021528488388.1590941326888
Winsorized Mean ( 9 / 24 )113516.4166666671255.6458564122990.4048033025912
Winsorized Mean ( 10 / 24 )113616.8333333331235.8687954542291.9327632117903
Winsorized Mean ( 11 / 24 )113244.3611111111102.52281820992102.713847950084
Winsorized Mean ( 12 / 24 )113109.5277777781052.18036046286107.500132133259
Winsorized Mean ( 13 / 24 )112946.6666666671010.40436287945111.783629224236
Winsorized Mean ( 14 / 24 )112986.9166666671003.44344706971112.599187325021
Winsorized Mean ( 15 / 24 )113196.5961.258780391368117.758612258307
Winsorized Mean ( 16 / 24 )113375.388888889921.858609332671122.985659342012
Winsorized Mean ( 17 / 24 )113158.402777778881.939005095484128.306381874477
Winsorized Mean ( 18 / 24 )113193.402777778874.797930984444129.39377057099
Winsorized Mean ( 19 / 24 )112844.805555556812.475204542536138.890153108233
Winsorized Mean ( 20 / 24 )112821.194444444761.456083585661148.16507068034
Winsorized Mean ( 21 / 24 )112811.277777778746.568688350221151.106361059784
Winsorized Mean ( 22 / 24 )112943.277777778709.38872306767159.212113338041
Winsorized Mean ( 23 / 24 )112942.319444444694.56881300852162.607818446722
Winsorized Mean ( 24 / 24 )112469.319444444609.146079954504184.634397471366
Trimmed Mean ( 1 / 24 )113569.9285714291560.7411888324772.7666632905267
Trimmed Mean ( 2 / 24 )113430.3235294121467.9810184761677.2696118694764
Trimmed Mean ( 3 / 24 )113294.1060606061404.4243820210880.6694240793277
Trimmed Mean ( 4 / 24 )113242.2031251358.766912282883.3418904311905
Trimmed Mean ( 5 / 24 )113207.6774193551314.7660632386386.1048064630552
Trimmed Mean ( 6 / 24 )113182.0666666671266.3710224856489.3751236067546
Trimmed Mean ( 7 / 24 )113138.6724137931215.1873646266193.1038913892565
Trimmed Mean ( 8 / 24 )113124.251162.1405128429697.3412842507849
Trimmed Mean ( 9 / 24 )113079.8888888891124.94665629154100.520223120325
Trimmed Mean ( 10 / 24 )113012.7307692311085.870384087104.075709610823
Trimmed Mean ( 11 / 24 )112925.741041.1756411688108.459836683494
Trimmed Mean ( 12 / 24 )112882.2916666671016.63988859558111.034686847283
Trimmed Mean ( 13 / 24 )112852.652173913996.138602882184113.290110279222
Trimmed Mean ( 14 / 24 )112840.818181818978.234871770319115.35145744458
Trimmed Mean ( 15 / 24 )112822.928571429955.476909574679118.080225111511
Trimmed Mean ( 16 / 24 )112778.1934.120091110016120.731907035621
Trimmed Mean ( 17 / 24 )112707.368421053913.385474365021123.395183725038
Trimmed Mean ( 18 / 24 )112654.305555556894.041222567456126.00571731138
Trimmed Mean ( 19 / 24 )112590.882352941867.539783452561129.781808858219
Trimmed Mean ( 20 / 24 )112560.8125846.607829761994132.95508090404
Trimmed Mean ( 21 / 24 )112529.566666667829.130017234286135.72004912092
Trimmed Mean ( 22 / 24 )112495.071428571805.555808859136139.649010275144
Trimmed Mean ( 23 / 24 )112438.653846154779.753201472813144.197745688992
Trimmed Mean ( 24 / 24 )112372.958333333742.438606936253151.356566433219
Median112273.5
Midrange116988.5
Midmean - Weighted Average at Xnp112436.864864865
Midmean - Weighted Average at X(n+1)p112654.305555556
Midmean - Empirical Distribution Function112436.864864865
Midmean - Empirical Distribution Function - Averaging112654.305555556
Midmean - Empirical Distribution Function - Interpolation112654.305555556
Midmean - Closest Observation112436.864864865
Midmean - True Basic - Statistics Graphics Toolkit112654.305555556
Midmean - MS Excel (old versions)112707.368421053
Number of observations72


Parameters (Session):
Parameters (R input):
R code (references can be found in the software module):
geomean <- function(x) {
return(exp(mean(log(x))))
}
harmean <- function(x) {
return(1/mean(1/x))
}
quamean <- function(x) {
return(sqrt(mean(x*x)))
}
winmean <- function(x) {
x <-sort(x[!is.na(x)])
n<-length(x)
denom <- 3
nodenom <- n/denom
if (nodenom>40) denom <- n/40
sqrtn = sqrt(n)
roundnodenom = floor(nodenom)
win <- array(NA,dim=c(roundnodenom,2))
for (j in 1:roundnodenom) {
win[j,1] <- (j*x[j+1]+sum(x[(j+1):(n-j)])+j*x[n-j])/n
win[j,2] <- sd(c(rep(x[j+1],j),x[(j+1):(n-j)],rep(x[n-j],j)))/sqrtn
}
return(win)
}
trimean <- function(x) {
x <-sort(x[!is.na(x)])
n<-length(x)
denom <- 3
nodenom <- n/denom
if (nodenom>40) denom <- n/40
sqrtn = sqrt(n)
roundnodenom = floor(nodenom)
tri <- array(NA,dim=c(roundnodenom,2))
for (j in 1:roundnodenom) {
tri[j,1] <- mean(x,trim=j/n)
tri[j,2] <- sd(x[(j+1):(n-j)]) / sqrt(n-j*2)
}
return(tri)
}
midrange <- function(x) {
return((max(x)+min(x))/2)
}
q1 <- function(data,n,p,i,f) {
np <- n*p;
i <<- floor(np)
f <<- np - i
qvalue <- (1-f)*data[i] + f*data[i+1]
}
q2 <- function(data,n,p,i,f) {
np <- (n+1)*p
i <<- floor(np)
f <<- np - i
qvalue <- (1-f)*data[i] + f*data[i+1]
}
q3 <- function(data,n,p,i,f) {
np <- n*p
i <<- floor(np)
f <<- np - i
if (f==0) {
qvalue <- data[i]
} else {
qvalue <- data[i+1]
}
}
q4 <- function(data,n,p,i,f) {
np <- n*p
i <<- floor(np)
f <<- np - i
if (f==0) {
qvalue <- (data[i]+data[i+1])/2
} else {
qvalue <- data[i+1]
}
}
q5 <- function(data,n,p,i,f) {
np <- (n-1)*p
i <<- floor(np)
f <<- np - i
if (f==0) {
qvalue <- data[i+1]
} else {
qvalue <- data[i+1] + f*(data[i+2]-data[i+1])
}
}
q6 <- function(data,n,p,i,f) {
np <- n*p+0.5
i <<- floor(np)
f <<- np - i
qvalue <- data[i]
}
q7 <- function(data,n,p,i,f) {
np <- (n+1)*p
i <<- floor(np)
f <<- np - i
if (f==0) {
qvalue <- data[i]
} else {
qvalue <- f*data[i] + (1-f)*data[i+1]
}
}
q8 <- function(data,n,p,i,f) {
np <- (n+1)*p
i <<- floor(np)
f <<- np - i
if (f==0) {
qvalue <- data[i]
} else {
if (f == 0.5) {
qvalue <- (data[i]+data[i+1])/2
} else {
if (f < 0.5) {
qvalue <- data[i]
} else {
qvalue <- data[i+1]
}
}
}
}
midmean <- function(x,def) {
x <-sort(x[!is.na(x)])
n<-length(x)
if (def==1) {
qvalue1 <- q1(x,n,0.25,i,f)
qvalue3 <- q1(x,n,0.75,i,f)
}
if (def==2) {
qvalue1 <- q2(x,n,0.25,i,f)
qvalue3 <- q2(x,n,0.75,i,f)
}
if (def==3) {
qvalue1 <- q3(x,n,0.25,i,f)
qvalue3 <- q3(x,n,0.75,i,f)
}
if (def==4) {
qvalue1 <- q4(x,n,0.25,i,f)
qvalue3 <- q4(x,n,0.75,i,f)
}
if (def==5) {
qvalue1 <- q5(x,n,0.25,i,f)
qvalue3 <- q5(x,n,0.75,i,f)
}
if (def==6) {
qvalue1 <- q6(x,n,0.25,i,f)
qvalue3 <- q6(x,n,0.75,i,f)
}
if (def==7) {
qvalue1 <- q7(x,n,0.25,i,f)
qvalue3 <- q7(x,n,0.75,i,f)
}
if (def==8) {
qvalue1 <- q8(x,n,0.25,i,f)
qvalue3 <- q8(x,n,0.75,i,f)
}
midm <- 0
myn <- 0
roundno4 <- round(n/4)
round3no4 <- round(3*n/4)
for (i in 1:n) {
if ((x[i]>=qvalue1) & (x[i]<=qvalue3)){
midm = midm + x[i]
myn = myn + 1
}
}
midm = midm / myn
return(midm)
}
(arm <- mean(x))
sqrtn <- sqrt(length(x))
(armse <- sd(x) / sqrtn)
(armose <- arm / armse)
(geo <- geomean(x))
(har <- harmean(x))
(qua <- quamean(x))
(win <- winmean(x))
(tri <- trimean(x))
(midr <- midrange(x))
midm <- array(NA,dim=8)
for (j in 1:8) midm[j] <- midmean(x,j)
midm
bitmap(file='test1.png')
lb <- win[,1] - 2*win[,2]
ub <- win[,1] + 2*win[,2]
if ((ylimmin == '') | (ylimmax == '')) plot(win[,1],type='b',main=main, xlab='j', pch=19, ylab='Winsorized Mean(j/n)', ylim=c(min(lb),max(ub))) else plot(win[,1],type='l',main=main, xlab='j', pch=19, ylab='Winsorized Mean(j/n)', ylim=c(ylimmin,ylimmax))
lines(ub,lty=3)
lines(lb,lty=3)
grid()
dev.off()
bitmap(file='test2.png')
lb <- tri[,1] - 2*tri[,2]
ub <- tri[,1] + 2*tri[,2]
if ((ylimmin == '') | (ylimmax == '')) plot(tri[,1],type='b',main=main, xlab='j', pch=19, ylab='Trimmed Mean(j/n)', ylim=c(min(lb),max(ub))) else plot(tri[,1],type='l',main=main, xlab='j', pch=19, ylab='Trimmed Mean(j/n)', ylim=c(ylimmin,ylimmax))
lines(ub,lty=3)
lines(lb,lty=3)
grid()
dev.off()
load(file='createtable')
a<-table.start()
a<-table.row.start(a)
a<-table.element(a,'Central Tendency - Ungrouped Data',4,TRUE)
a<-table.row.end(a)
a<-table.row.start(a)
a<-table.element(a,'Measure',header=TRUE)
a<-table.element(a,'Value',header=TRUE)
a<-table.element(a,'S.E.',header=TRUE)
a<-table.element(a,'Value/S.E.',header=TRUE)
a<-table.row.end(a)
a<-table.row.start(a)
a<-table.element(a,hyperlink('arithmetic_mean.htm', 'Arithmetic Mean', 'click to view the definition of the Arithmetic Mean'),header=TRUE)
a<-table.element(a,arm)
a<-table.element(a,hyperlink('arithmetic_mean_standard_error.htm', armse, 'click to view the definition of the Standard Error of the Arithmetic Mean'))
a<-table.element(a,armose)
a<-table.row.end(a)
a<-table.row.start(a)
a<-table.element(a,hyperlink('geometric_mean.htm', 'Geometric Mean', 'click to view the definition of the Geometric Mean'),header=TRUE)
a<-table.element(a,geo)
a<-table.element(a,'')
a<-table.row.end(a)
a<-table.row.start(a)
a<-table.element(a,hyperlink('harmonic_mean.htm', 'Harmonic Mean', 'click to view the definition of the Harmonic Mean'),header=TRUE)
a<-table.element(a,har)
a<-table.element(a,'')
a<-table.row.end(a)
a<-table.row.start(a)
a<-table.element(a,hyperlink('quadratic_mean.htm', 'Quadratic Mean', 'click to view the definition of the Quadratic Mean'),header=TRUE)
a<-table.element(a,qua)
a<-table.element(a,'')
a<-table.row.end(a)
for (j in 1:length(win[,1])) {
a<-table.row.start(a)
mylabel <- paste('Winsorized Mean (',j)
mylabel <- paste(mylabel,'/')
mylabel <- paste(mylabel,length(win[,1]))
mylabel <- paste(mylabel,')')
a<-table.element(a,hyperlink('winsorized_mean.htm', mylabel, 'click to view the definition of the Winsorized Mean'),header=TRUE)
a<-table.element(a,win[j,1])
a<-table.element(a,win[j,2])
a<-table.element(a,win[j,1]/win[j,2])
a<-table.row.end(a)
}
for (j in 1:length(tri[,1])) {
a<-table.row.start(a)
mylabel <- paste('Trimmed Mean (',j)
mylabel <- paste(mylabel,'/')
mylabel <- paste(mylabel,length(tri[,1]))
mylabel <- paste(mylabel,')')
a<-table.element(a,hyperlink('arithmetic_mean.htm', mylabel, 'click to view the definition of the Trimmed Mean'),header=TRUE)
a<-table.element(a,tri[j,1])
a<-table.element(a,tri[j,2])
a<-table.element(a,tri[j,1]/tri[j,2])
a<-table.row.end(a)
}
a<-table.row.start(a)
a<-table.element(a,hyperlink('median_1.htm', 'Median', 'click to view the definition of the Median'),header=TRUE)
a<-table.element(a,median(x))
a<-table.element(a,'')
a<-table.row.end(a)
a<-table.row.start(a)
a<-table.element(a,hyperlink('midrange.htm', 'Midrange', 'click to view the definition of the Midrange'),header=TRUE)
a<-table.element(a,midr)
a<-table.element(a,'')
a<-table.row.end(a)
a<-table.row.start(a)
mymid <- hyperlink('midmean.htm', 'Midmean', 'click to view the definition of the Midmean')
mylabel <- paste(mymid,hyperlink('method_1.htm','Weighted Average at Xnp',''),sep=' - ')
a<-table.element(a,mylabel,header=TRUE)
a<-table.element(a,midm[1])
a<-table.element(a,'')
a<-table.row.end(a)
a<-table.row.start(a)
mymid <- hyperlink('midmean.htm', 'Midmean', 'click to view the definition of the Midmean')
mylabel <- paste(mymid,hyperlink('method_2.htm','Weighted Average at X(n+1)p',''),sep=' - ')
a<-table.element(a,mylabel,header=TRUE)
a<-table.element(a,midm[2])
a<-table.element(a,'')
a<-table.row.end(a)
a<-table.row.start(a)
mymid <- hyperlink('midmean.htm', 'Midmean', 'click to view the definition of the Midmean')
mylabel <- paste(mymid,hyperlink('method_3.htm','Empirical Distribution Function',''),sep=' - ')
a<-table.element(a,mylabel,header=TRUE)
a<-table.element(a,midm[3])
a<-table.element(a,'')
a<-table.row.end(a)
a<-table.row.start(a)
mymid <- hyperlink('midmean.htm', 'Midmean', 'click to view the definition of the Midmean')
mylabel <- paste(mymid,hyperlink('method_4.htm','Empirical Distribution Function - Averaging',''),sep=' - ')
a<-table.element(a,mylabel,header=TRUE)
a<-table.element(a,midm[4])
a<-table.element(a,'')
a<-table.row.end(a)
a<-table.row.start(a)
mymid <- hyperlink('midmean.htm', 'Midmean', 'click to view the definition of the Midmean')
mylabel <- paste(mymid,hyperlink('method_5.htm','Empirical Distribution Function - Interpolation',''),sep=' - ')
a<-table.element(a,mylabel,header=TRUE)
a<-table.element(a,midm[5])
a<-table.element(a,'')
a<-table.row.end(a)
a<-table.row.start(a)
mymid <- hyperlink('midmean.htm', 'Midmean', 'click to view the definition of the Midmean')
mylabel <- paste(mymid,hyperlink('method_6.htm','Closest Observation',''),sep=' - ')
a<-table.element(a,mylabel,header=TRUE)
a<-table.element(a,midm[6])
a<-table.element(a,'')
a<-table.row.end(a)
a<-table.row.start(a)
mymid <- hyperlink('midmean.htm', 'Midmean', 'click to view the definition of the Midmean')
mylabel <- paste(mymid,hyperlink('method_7.htm','True Basic - Statistics Graphics Toolkit',''),sep=' - ')
a<-table.element(a,mylabel,header=TRUE)
a<-table.element(a,midm[7])
a<-table.element(a,'')
a<-table.row.end(a)
a<-table.row.start(a)
mymid <- hyperlink('midmean.htm', 'Midmean', 'click to view the definition of the Midmean')
mylabel <- paste(mymid,hyperlink('method_8.htm','MS Excel (old versions)',''),sep=' - ')
a<-table.element(a,mylabel,header=TRUE)
a<-table.element(a,midm[8])
a<-table.element(a,'')
a<-table.row.end(a)
a<-table.row.start(a)
a<-table.element(a,'Number of observations',header=TRUE)
a<-table.element(a,length(x))
a<-table.element(a,'')
a<-table.row.end(a)
a<-table.end(a)
table.save(a,file='mytable.tab')