Free Statistics

of Irreproducible Research!

Author's title

Author*Unverified author*
R Software Modulerwasp_centraltendency.wasp
Title produced by softwareCentral Tendency
Date of computationWed, 07 Mar 2012 11:14:32 -0500
Cite this page as followsStatistical Computations at FreeStatistics.org, Office for Research Development and Education, URL https://freestatistics.org/blog/index.php?v=date/2012/Mar/07/t1331136895xx8b4zf0kz3q7ft.htm/, Retrieved Sun, 28 Apr 2024 20:59:28 +0000
Statistical Computations at FreeStatistics.org, Office for Research Development and Education, URL https://freestatistics.org/blog/index.php?pk=163656, Retrieved Sun, 28 Apr 2024 20:59:28 +0000
QR Codes:

Original text written by user:
IsPrivate?No (this computation is public)
User-defined keywords
Estimated Impact134
Family? (F = Feedback message, R = changed R code, M = changed R Module, P = changed Parameters, D = changed Data)
-       [Central Tendency] [Werkloosheid in B...] [2012-03-07 16:14:32] [50083fea611f0183deb36cab794727ad] [Current]
Feedback Forum

Post a new message
Dataseries X:
591
589
584
573
567
569
621
629
628
612
595
597
593
590
580
574
573
573
620
626
620
588
566
557
561
549
532
526
511
499
555
565
542
527
510
514
517
508
493
490
469
478
528
534
518
506
502
516
528
533
536
537
524
536
587
597
581
564
558
575
580
575
563
552
537
545
601
604
586
564
549
551
556
548
540
531
521
519
572
581
563
548
539
541


Summary of computational transaction
Raw Inputview raw input (R code)
Raw Outputview raw output of R engine
Computing time1 seconds
R Server'Gertrude Mary Cox' @ cox.wessa.net

\begin{tabular}{lllllllll}
\hline
Summary of computational transaction \tabularnewline
Raw Input & view raw input (R code)  \tabularnewline
Raw Output & view raw output of R engine  \tabularnewline
Computing time & 1 seconds \tabularnewline
R Server & 'Gertrude Mary Cox' @ cox.wessa.net \tabularnewline
\hline
\end{tabular}
%Source: https://freestatistics.org/blog/index.php?pk=163656&T=0

[TABLE]
[ROW][C]Summary of computational transaction[/C][/ROW]
[ROW][C]Raw Input[/C][C]view raw input (R code) [/C][/ROW]
[ROW][C]Raw Output[/C][C]view raw output of R engine [/C][/ROW]
[ROW][C]Computing time[/C][C]1 seconds[/C][/ROW]
[ROW][C]R Server[/C][C]'Gertrude Mary Cox' @ cox.wessa.net[/C][/ROW]
[/TABLE]
Source: https://freestatistics.org/blog/index.php?pk=163656&T=0

Globally Unique Identifier (entire table): ba.freestatistics.org/blog/index.php?pk=163656&T=0

As an alternative you can also use a QR Code:  

The GUIDs for individual cells are displayed in the table below:

Summary of computational transaction
Raw Inputview raw input (R code)
Raw Outputview raw output of R engine
Computing time1 seconds
R Server'Gertrude Mary Cox' @ cox.wessa.net


Central Tendency - Ungrouped Data
MeasureValueS.E.Value/S.E.
Arithmetic Mean555.7976190476193.96151088495964140.299404744228
Geometric Mean554.619726380343
Harmonic Mean553.435604064351
Quadratic Mean556.968185378491
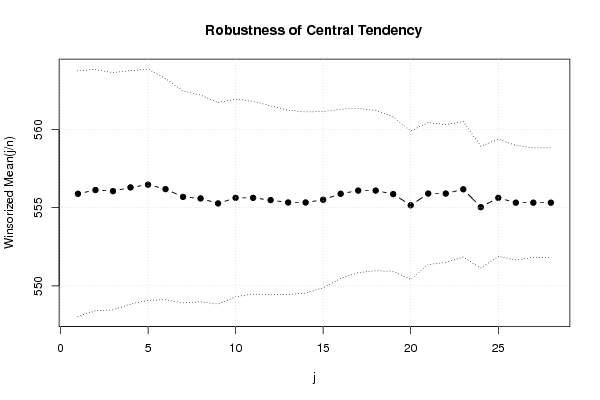
Winsorized Mean ( 1 / 28 )555.8928571428573.93193735220862141.378869332851
Winsorized Mean ( 2 / 28 )556.1309523809523.85783582273783144.156199987349
Winsorized Mean ( 3 / 28 )556.0595238095243.79816935063276146.401982764904
Winsorized Mean ( 4 / 28 )556.2976190476193.73335970512715149.007238248068
Winsorized Mean ( 5 / 28 )556.476190476193.70101303333084150.357803516129
Winsorized Mean ( 6 / 28 )556.1904761904763.53774322618077157.216180098781
Winsorized Mean ( 7 / 28 )555.6904761904763.38862530622671163.986993536694
Winsorized Mean ( 8 / 28 )555.5952380952383.30848970747515167.930169720623
Winsorized Mean ( 9 / 28 )555.273809523813.22183061920749172.347300386758
Winsorized Mean ( 10 / 28 )555.6309523809523.1639454335096175.613316998523
Winsorized Mean ( 11 / 28 )555.6309523809523.08210368071113180.276528612026
Winsorized Mean ( 12 / 28 )555.4880952380953.01666313466537184.139915675309
Winsorized Mean ( 13 / 28 )555.3333333333332.94719901318717188.427497039904
Winsorized Mean ( 14 / 28 )555.3333333333332.89772762640408191.644421053635
Winsorized Mean ( 15 / 28 )555.5119047619052.81874992371101197.077399484431
Winsorized Mean ( 16 / 28 )555.8928571428572.70880811093255205.216772239907
Winsorized Mean ( 17 / 28 )556.0952380952382.62330015162014211.983077022961
Winsorized Mean ( 18 / 28 )556.0952380952382.56357036459579216.922166746501
Winsorized Mean ( 19 / 28 )555.8690476190482.46988631895156225.058555672719
Winsorized Mean ( 20 / 28 )555.1547619047622.37398974785003233.848845559477
Winsorized Mean ( 21 / 28 )555.9047619047622.27275382280528244.595237868131
Winsorized Mean ( 22 / 28 )555.9047619047622.20367261436105252.262862587665
Winsorized Mean ( 23 / 28 )556.1785714285712.16814421006304256.5228681963
Winsorized Mean ( 24 / 28 )555.0357142857141.94808160107128284.913996405742
Winsorized Mean ( 25 / 28 )555.6309523809521.87173159478333296.853968768568
Winsorized Mean ( 26 / 28 )555.3214285714291.83343717806501302.885441189487
Winsorized Mean ( 27 / 28 )555.3214285714291.75354412975516316.685174412444
Winsorized Mean ( 28 / 28 )555.3214285714291.75354412975516316.685174412444
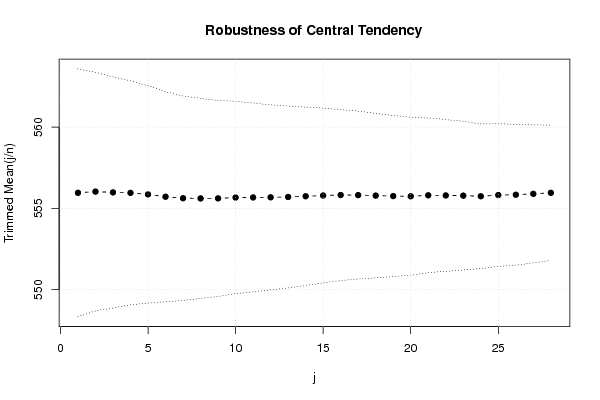
Trimmed Mean ( 1 / 28 )555.9634146341463.8120731331394145.842798712596
Trimmed Mean ( 2 / 28 )556.03753.6727892579815151.393793910623
Trimmed Mean ( 3 / 28 )555.9871794871793.55717739491519156.300099140947
Trimmed Mean ( 4 / 28 )555.9605263157893.44894801095515161.19713157457
Trimmed Mean ( 5 / 28 )555.8648648648653.34537451779596166.159233266082
Trimmed Mean ( 6 / 28 )555.7222222222223.23325239614965171.877154683009
Trimmed Mean ( 7 / 28 )555.6285714285713.14587846494086176.62111795505
Trimmed Mean ( 8 / 28 )555.6176470588243.07900288094987180.45376004566
Trimmed Mean ( 9 / 28 )555.6212121212123.01710470758924184.157086336314
Trimmed Mean ( 10 / 28 )555.6718752.96089381878196187.670314779674
Trimmed Mean ( 11 / 28 )555.6774193548392.90441540937244191.321605567058
Trimmed Mean ( 12 / 28 )555.6833333333332.85145335791313194.877230515184
Trimmed Mean ( 13 / 28 )555.7068965517242.79864808568267198.562620071674
Trimmed Mean ( 14 / 28 )555.752.74610113225486202.377834331129
Trimmed Mean ( 15 / 28 )555.7962962962962.68954801115047206.650446094305
Trimmed Mean ( 16 / 28 )555.8269230769232.63328290334601211.077557360303
Trimmed Mean ( 17 / 28 )555.822.58262483152473215.215153674432
Trimmed Mean ( 18 / 28 )555.7916666666672.53345668559338219.380765350046
Trimmed Mean ( 19 / 28 )555.7608695652172.48068573630906224.035177624763
Trimmed Mean ( 20 / 28 )555.752.42980197385205228.722342800204
Trimmed Mean ( 21 / 28 )555.8095238095242.38102206634376233.4331679097
Trimmed Mean ( 22 / 28 )555.82.33595091272626237.933081971886
Trimmed Mean ( 23 / 28 )555.7894736842112.28799759482736242.915235112451
Trimmed Mean ( 24 / 28 )555.752.22802318246182249.436363308362
Trimmed Mean ( 25 / 28 )555.8235294117652.19603864236937253.102800054589
Trimmed Mean ( 26 / 28 )555.843752.16511443441517256.727192412877
Trimmed Mean ( 27 / 28 )555.92.12448776787772261.663073991394
Trimmed Mean ( 28 / 28 )555.9642857142862.08197234456594267.03730583424
Median556.5
Midrange549
Midmean - Weighted Average at Xnp555.133333333333
Midmean - Weighted Average at X(n+1)p556.395348837209
Midmean - Empirical Distribution Function555.133333333333
Midmean - Empirical Distribution Function - Averaging556.395348837209
Midmean - Empirical Distribution Function - Interpolation556.395348837209
Midmean - Closest Observation555.133333333333
Midmean - True Basic - Statistics Graphics Toolkit556.395348837209
Midmean - MS Excel (old versions)555.133333333333
Number of observations84

\begin{tabular}{lllllllll}
\hline
Central Tendency - Ungrouped Data \tabularnewline
Measure & Value & S.E. & Value/S.E. \tabularnewline
Arithmetic Mean & 555.797619047619 & 3.96151088495964 & 140.299404744228 \tabularnewline
Geometric Mean & 554.619726380343 &  &  \tabularnewline
Harmonic Mean & 553.435604064351 &  &  \tabularnewline
Quadratic Mean & 556.968185378491 &  &  \tabularnewline
Winsorized Mean ( 1 / 28 ) & 555.892857142857 & 3.93193735220862 & 141.378869332851 \tabularnewline
Winsorized Mean ( 2 / 28 ) & 556.130952380952 & 3.85783582273783 & 144.156199987349 \tabularnewline
Winsorized Mean ( 3 / 28 ) & 556.059523809524 & 3.79816935063276 & 146.401982764904 \tabularnewline
Winsorized Mean ( 4 / 28 ) & 556.297619047619 & 3.73335970512715 & 149.007238248068 \tabularnewline
Winsorized Mean ( 5 / 28 ) & 556.47619047619 & 3.70101303333084 & 150.357803516129 \tabularnewline
Winsorized Mean ( 6 / 28 ) & 556.190476190476 & 3.53774322618077 & 157.216180098781 \tabularnewline
Winsorized Mean ( 7 / 28 ) & 555.690476190476 & 3.38862530622671 & 163.986993536694 \tabularnewline
Winsorized Mean ( 8 / 28 ) & 555.595238095238 & 3.30848970747515 & 167.930169720623 \tabularnewline
Winsorized Mean ( 9 / 28 ) & 555.27380952381 & 3.22183061920749 & 172.347300386758 \tabularnewline
Winsorized Mean ( 10 / 28 ) & 555.630952380952 & 3.1639454335096 & 175.613316998523 \tabularnewline
Winsorized Mean ( 11 / 28 ) & 555.630952380952 & 3.08210368071113 & 180.276528612026 \tabularnewline
Winsorized Mean ( 12 / 28 ) & 555.488095238095 & 3.01666313466537 & 184.139915675309 \tabularnewline
Winsorized Mean ( 13 / 28 ) & 555.333333333333 & 2.94719901318717 & 188.427497039904 \tabularnewline
Winsorized Mean ( 14 / 28 ) & 555.333333333333 & 2.89772762640408 & 191.644421053635 \tabularnewline
Winsorized Mean ( 15 / 28 ) & 555.511904761905 & 2.81874992371101 & 197.077399484431 \tabularnewline
Winsorized Mean ( 16 / 28 ) & 555.892857142857 & 2.70880811093255 & 205.216772239907 \tabularnewline
Winsorized Mean ( 17 / 28 ) & 556.095238095238 & 2.62330015162014 & 211.983077022961 \tabularnewline
Winsorized Mean ( 18 / 28 ) & 556.095238095238 & 2.56357036459579 & 216.922166746501 \tabularnewline
Winsorized Mean ( 19 / 28 ) & 555.869047619048 & 2.46988631895156 & 225.058555672719 \tabularnewline
Winsorized Mean ( 20 / 28 ) & 555.154761904762 & 2.37398974785003 & 233.848845559477 \tabularnewline
Winsorized Mean ( 21 / 28 ) & 555.904761904762 & 2.27275382280528 & 244.595237868131 \tabularnewline
Winsorized Mean ( 22 / 28 ) & 555.904761904762 & 2.20367261436105 & 252.262862587665 \tabularnewline
Winsorized Mean ( 23 / 28 ) & 556.178571428571 & 2.16814421006304 & 256.5228681963 \tabularnewline
Winsorized Mean ( 24 / 28 ) & 555.035714285714 & 1.94808160107128 & 284.913996405742 \tabularnewline
Winsorized Mean ( 25 / 28 ) & 555.630952380952 & 1.87173159478333 & 296.853968768568 \tabularnewline
Winsorized Mean ( 26 / 28 ) & 555.321428571429 & 1.83343717806501 & 302.885441189487 \tabularnewline
Winsorized Mean ( 27 / 28 ) & 555.321428571429 & 1.75354412975516 & 316.685174412444 \tabularnewline
Winsorized Mean ( 28 / 28 ) & 555.321428571429 & 1.75354412975516 & 316.685174412444 \tabularnewline
Trimmed Mean ( 1 / 28 ) & 555.963414634146 & 3.8120731331394 & 145.842798712596 \tabularnewline
Trimmed Mean ( 2 / 28 ) & 556.0375 & 3.6727892579815 & 151.393793910623 \tabularnewline
Trimmed Mean ( 3 / 28 ) & 555.987179487179 & 3.55717739491519 & 156.300099140947 \tabularnewline
Trimmed Mean ( 4 / 28 ) & 555.960526315789 & 3.44894801095515 & 161.19713157457 \tabularnewline
Trimmed Mean ( 5 / 28 ) & 555.864864864865 & 3.34537451779596 & 166.159233266082 \tabularnewline
Trimmed Mean ( 6 / 28 ) & 555.722222222222 & 3.23325239614965 & 171.877154683009 \tabularnewline
Trimmed Mean ( 7 / 28 ) & 555.628571428571 & 3.14587846494086 & 176.62111795505 \tabularnewline
Trimmed Mean ( 8 / 28 ) & 555.617647058824 & 3.07900288094987 & 180.45376004566 \tabularnewline
Trimmed Mean ( 9 / 28 ) & 555.621212121212 & 3.01710470758924 & 184.157086336314 \tabularnewline
Trimmed Mean ( 10 / 28 ) & 555.671875 & 2.96089381878196 & 187.670314779674 \tabularnewline
Trimmed Mean ( 11 / 28 ) & 555.677419354839 & 2.90441540937244 & 191.321605567058 \tabularnewline
Trimmed Mean ( 12 / 28 ) & 555.683333333333 & 2.85145335791313 & 194.877230515184 \tabularnewline
Trimmed Mean ( 13 / 28 ) & 555.706896551724 & 2.79864808568267 & 198.562620071674 \tabularnewline
Trimmed Mean ( 14 / 28 ) & 555.75 & 2.74610113225486 & 202.377834331129 \tabularnewline
Trimmed Mean ( 15 / 28 ) & 555.796296296296 & 2.68954801115047 & 206.650446094305 \tabularnewline
Trimmed Mean ( 16 / 28 ) & 555.826923076923 & 2.63328290334601 & 211.077557360303 \tabularnewline
Trimmed Mean ( 17 / 28 ) & 555.82 & 2.58262483152473 & 215.215153674432 \tabularnewline
Trimmed Mean ( 18 / 28 ) & 555.791666666667 & 2.53345668559338 & 219.380765350046 \tabularnewline
Trimmed Mean ( 19 / 28 ) & 555.760869565217 & 2.48068573630906 & 224.035177624763 \tabularnewline
Trimmed Mean ( 20 / 28 ) & 555.75 & 2.42980197385205 & 228.722342800204 \tabularnewline
Trimmed Mean ( 21 / 28 ) & 555.809523809524 & 2.38102206634376 & 233.4331679097 \tabularnewline
Trimmed Mean ( 22 / 28 ) & 555.8 & 2.33595091272626 & 237.933081971886 \tabularnewline
Trimmed Mean ( 23 / 28 ) & 555.789473684211 & 2.28799759482736 & 242.915235112451 \tabularnewline
Trimmed Mean ( 24 / 28 ) & 555.75 & 2.22802318246182 & 249.436363308362 \tabularnewline
Trimmed Mean ( 25 / 28 ) & 555.823529411765 & 2.19603864236937 & 253.102800054589 \tabularnewline
Trimmed Mean ( 26 / 28 ) & 555.84375 & 2.16511443441517 & 256.727192412877 \tabularnewline
Trimmed Mean ( 27 / 28 ) & 555.9 & 2.12448776787772 & 261.663073991394 \tabularnewline
Trimmed Mean ( 28 / 28 ) & 555.964285714286 & 2.08197234456594 & 267.03730583424 \tabularnewline
Median & 556.5 &  &  \tabularnewline
Midrange & 549 &  &  \tabularnewline
Midmean - Weighted Average at Xnp & 555.133333333333 &  &  \tabularnewline
Midmean - Weighted Average at X(n+1)p & 556.395348837209 &  &  \tabularnewline
Midmean - Empirical Distribution Function & 555.133333333333 &  &  \tabularnewline
Midmean - Empirical Distribution Function - Averaging & 556.395348837209 &  &  \tabularnewline
Midmean - Empirical Distribution Function - Interpolation & 556.395348837209 &  &  \tabularnewline
Midmean - Closest Observation & 555.133333333333 &  &  \tabularnewline
Midmean - True Basic - Statistics Graphics Toolkit & 556.395348837209 &  &  \tabularnewline
Midmean - MS Excel (old versions) & 555.133333333333 &  &  \tabularnewline
Number of observations & 84 &  &  \tabularnewline
\hline
\end{tabular}
%Source: https://freestatistics.org/blog/index.php?pk=163656&T=1

[TABLE]
[ROW][C]Central Tendency - Ungrouped Data[/C][/ROW]
[ROW][C]Measure[/C][C]Value[/C][C]S.E.[/C][C]Value/S.E.[/C][/ROW]
[ROW][C]Arithmetic Mean[/C][C]555.797619047619[/C][C]3.96151088495964[/C][C]140.299404744228[/C][/ROW]
[ROW][C]Geometric Mean[/C][C]554.619726380343[/C][C][/C][C][/C][/ROW]
[ROW][C]Harmonic Mean[/C][C]553.435604064351[/C][C][/C][C][/C][/ROW]
[ROW][C]Quadratic Mean[/C][C]556.968185378491[/C][C][/C][C][/C][/ROW]
[ROW][C]Winsorized Mean ( 1 / 28 )[/C][C]555.892857142857[/C][C]3.93193735220862[/C][C]141.378869332851[/C][/ROW]
[ROW][C]Winsorized Mean ( 2 / 28 )[/C][C]556.130952380952[/C][C]3.85783582273783[/C][C]144.156199987349[/C][/ROW]
[ROW][C]Winsorized Mean ( 3 / 28 )[/C][C]556.059523809524[/C][C]3.79816935063276[/C][C]146.401982764904[/C][/ROW]
[ROW][C]Winsorized Mean ( 4 / 28 )[/C][C]556.297619047619[/C][C]3.73335970512715[/C][C]149.007238248068[/C][/ROW]
[ROW][C]Winsorized Mean ( 5 / 28 )[/C][C]556.47619047619[/C][C]3.70101303333084[/C][C]150.357803516129[/C][/ROW]
[ROW][C]Winsorized Mean ( 6 / 28 )[/C][C]556.190476190476[/C][C]3.53774322618077[/C][C]157.216180098781[/C][/ROW]
[ROW][C]Winsorized Mean ( 7 / 28 )[/C][C]555.690476190476[/C][C]3.38862530622671[/C][C]163.986993536694[/C][/ROW]
[ROW][C]Winsorized Mean ( 8 / 28 )[/C][C]555.595238095238[/C][C]3.30848970747515[/C][C]167.930169720623[/C][/ROW]
[ROW][C]Winsorized Mean ( 9 / 28 )[/C][C]555.27380952381[/C][C]3.22183061920749[/C][C]172.347300386758[/C][/ROW]
[ROW][C]Winsorized Mean ( 10 / 28 )[/C][C]555.630952380952[/C][C]3.1639454335096[/C][C]175.613316998523[/C][/ROW]
[ROW][C]Winsorized Mean ( 11 / 28 )[/C][C]555.630952380952[/C][C]3.08210368071113[/C][C]180.276528612026[/C][/ROW]
[ROW][C]Winsorized Mean ( 12 / 28 )[/C][C]555.488095238095[/C][C]3.01666313466537[/C][C]184.139915675309[/C][/ROW]
[ROW][C]Winsorized Mean ( 13 / 28 )[/C][C]555.333333333333[/C][C]2.94719901318717[/C][C]188.427497039904[/C][/ROW]
[ROW][C]Winsorized Mean ( 14 / 28 )[/C][C]555.333333333333[/C][C]2.89772762640408[/C][C]191.644421053635[/C][/ROW]
[ROW][C]Winsorized Mean ( 15 / 28 )[/C][C]555.511904761905[/C][C]2.81874992371101[/C][C]197.077399484431[/C][/ROW]
[ROW][C]Winsorized Mean ( 16 / 28 )[/C][C]555.892857142857[/C][C]2.70880811093255[/C][C]205.216772239907[/C][/ROW]
[ROW][C]Winsorized Mean ( 17 / 28 )[/C][C]556.095238095238[/C][C]2.62330015162014[/C][C]211.983077022961[/C][/ROW]
[ROW][C]Winsorized Mean ( 18 / 28 )[/C][C]556.095238095238[/C][C]2.56357036459579[/C][C]216.922166746501[/C][/ROW]
[ROW][C]Winsorized Mean ( 19 / 28 )[/C][C]555.869047619048[/C][C]2.46988631895156[/C][C]225.058555672719[/C][/ROW]
[ROW][C]Winsorized Mean ( 20 / 28 )[/C][C]555.154761904762[/C][C]2.37398974785003[/C][C]233.848845559477[/C][/ROW]
[ROW][C]Winsorized Mean ( 21 / 28 )[/C][C]555.904761904762[/C][C]2.27275382280528[/C][C]244.595237868131[/C][/ROW]
[ROW][C]Winsorized Mean ( 22 / 28 )[/C][C]555.904761904762[/C][C]2.20367261436105[/C][C]252.262862587665[/C][/ROW]
[ROW][C]Winsorized Mean ( 23 / 28 )[/C][C]556.178571428571[/C][C]2.16814421006304[/C][C]256.5228681963[/C][/ROW]
[ROW][C]Winsorized Mean ( 24 / 28 )[/C][C]555.035714285714[/C][C]1.94808160107128[/C][C]284.913996405742[/C][/ROW]
[ROW][C]Winsorized Mean ( 25 / 28 )[/C][C]555.630952380952[/C][C]1.87173159478333[/C][C]296.853968768568[/C][/ROW]
[ROW][C]Winsorized Mean ( 26 / 28 )[/C][C]555.321428571429[/C][C]1.83343717806501[/C][C]302.885441189487[/C][/ROW]
[ROW][C]Winsorized Mean ( 27 / 28 )[/C][C]555.321428571429[/C][C]1.75354412975516[/C][C]316.685174412444[/C][/ROW]
[ROW][C]Winsorized Mean ( 28 / 28 )[/C][C]555.321428571429[/C][C]1.75354412975516[/C][C]316.685174412444[/C][/ROW]
[ROW][C]Trimmed Mean ( 1 / 28 )[/C][C]555.963414634146[/C][C]3.8120731331394[/C][C]145.842798712596[/C][/ROW]
[ROW][C]Trimmed Mean ( 2 / 28 )[/C][C]556.0375[/C][C]3.6727892579815[/C][C]151.393793910623[/C][/ROW]
[ROW][C]Trimmed Mean ( 3 / 28 )[/C][C]555.987179487179[/C][C]3.55717739491519[/C][C]156.300099140947[/C][/ROW]
[ROW][C]Trimmed Mean ( 4 / 28 )[/C][C]555.960526315789[/C][C]3.44894801095515[/C][C]161.19713157457[/C][/ROW]
[ROW][C]Trimmed Mean ( 5 / 28 )[/C][C]555.864864864865[/C][C]3.34537451779596[/C][C]166.159233266082[/C][/ROW]
[ROW][C]Trimmed Mean ( 6 / 28 )[/C][C]555.722222222222[/C][C]3.23325239614965[/C][C]171.877154683009[/C][/ROW]
[ROW][C]Trimmed Mean ( 7 / 28 )[/C][C]555.628571428571[/C][C]3.14587846494086[/C][C]176.62111795505[/C][/ROW]
[ROW][C]Trimmed Mean ( 8 / 28 )[/C][C]555.617647058824[/C][C]3.07900288094987[/C][C]180.45376004566[/C][/ROW]
[ROW][C]Trimmed Mean ( 9 / 28 )[/C][C]555.621212121212[/C][C]3.01710470758924[/C][C]184.157086336314[/C][/ROW]
[ROW][C]Trimmed Mean ( 10 / 28 )[/C][C]555.671875[/C][C]2.96089381878196[/C][C]187.670314779674[/C][/ROW]
[ROW][C]Trimmed Mean ( 11 / 28 )[/C][C]555.677419354839[/C][C]2.90441540937244[/C][C]191.321605567058[/C][/ROW]
[ROW][C]Trimmed Mean ( 12 / 28 )[/C][C]555.683333333333[/C][C]2.85145335791313[/C][C]194.877230515184[/C][/ROW]
[ROW][C]Trimmed Mean ( 13 / 28 )[/C][C]555.706896551724[/C][C]2.79864808568267[/C][C]198.562620071674[/C][/ROW]
[ROW][C]Trimmed Mean ( 14 / 28 )[/C][C]555.75[/C][C]2.74610113225486[/C][C]202.377834331129[/C][/ROW]
[ROW][C]Trimmed Mean ( 15 / 28 )[/C][C]555.796296296296[/C][C]2.68954801115047[/C][C]206.650446094305[/C][/ROW]
[ROW][C]Trimmed Mean ( 16 / 28 )[/C][C]555.826923076923[/C][C]2.63328290334601[/C][C]211.077557360303[/C][/ROW]
[ROW][C]Trimmed Mean ( 17 / 28 )[/C][C]555.82[/C][C]2.58262483152473[/C][C]215.215153674432[/C][/ROW]
[ROW][C]Trimmed Mean ( 18 / 28 )[/C][C]555.791666666667[/C][C]2.53345668559338[/C][C]219.380765350046[/C][/ROW]
[ROW][C]Trimmed Mean ( 19 / 28 )[/C][C]555.760869565217[/C][C]2.48068573630906[/C][C]224.035177624763[/C][/ROW]
[ROW][C]Trimmed Mean ( 20 / 28 )[/C][C]555.75[/C][C]2.42980197385205[/C][C]228.722342800204[/C][/ROW]
[ROW][C]Trimmed Mean ( 21 / 28 )[/C][C]555.809523809524[/C][C]2.38102206634376[/C][C]233.4331679097[/C][/ROW]
[ROW][C]Trimmed Mean ( 22 / 28 )[/C][C]555.8[/C][C]2.33595091272626[/C][C]237.933081971886[/C][/ROW]
[ROW][C]Trimmed Mean ( 23 / 28 )[/C][C]555.789473684211[/C][C]2.28799759482736[/C][C]242.915235112451[/C][/ROW]
[ROW][C]Trimmed Mean ( 24 / 28 )[/C][C]555.75[/C][C]2.22802318246182[/C][C]249.436363308362[/C][/ROW]
[ROW][C]Trimmed Mean ( 25 / 28 )[/C][C]555.823529411765[/C][C]2.19603864236937[/C][C]253.102800054589[/C][/ROW]
[ROW][C]Trimmed Mean ( 26 / 28 )[/C][C]555.84375[/C][C]2.16511443441517[/C][C]256.727192412877[/C][/ROW]
[ROW][C]Trimmed Mean ( 27 / 28 )[/C][C]555.9[/C][C]2.12448776787772[/C][C]261.663073991394[/C][/ROW]
[ROW][C]Trimmed Mean ( 28 / 28 )[/C][C]555.964285714286[/C][C]2.08197234456594[/C][C]267.03730583424[/C][/ROW]
[ROW][C]Median[/C][C]556.5[/C][C][/C][C][/C][/ROW]
[ROW][C]Midrange[/C][C]549[/C][C][/C][C][/C][/ROW]
[ROW][C]Midmean - Weighted Average at Xnp[/C][C]555.133333333333[/C][C][/C][C][/C][/ROW]
[ROW][C]Midmean - Weighted Average at X(n+1)p[/C][C]556.395348837209[/C][C][/C][C][/C][/ROW]
[ROW][C]Midmean - Empirical Distribution Function[/C][C]555.133333333333[/C][C][/C][C][/C][/ROW]
[ROW][C]Midmean - Empirical Distribution Function - Averaging[/C][C]556.395348837209[/C][C][/C][C][/C][/ROW]
[ROW][C]Midmean - Empirical Distribution Function - Interpolation[/C][C]556.395348837209[/C][C][/C][C][/C][/ROW]
[ROW][C]Midmean - Closest Observation[/C][C]555.133333333333[/C][C][/C][C][/C][/ROW]
[ROW][C]Midmean - True Basic - Statistics Graphics Toolkit[/C][C]556.395348837209[/C][C][/C][C][/C][/ROW]
[ROW][C]Midmean - MS Excel (old versions)[/C][C]555.133333333333[/C][C][/C][C][/C][/ROW]
[ROW][C]Number of observations[/C][C]84[/C][C][/C][C][/C][/ROW]
[/TABLE]
Source: https://freestatistics.org/blog/index.php?pk=163656&T=1

Globally Unique Identifier (entire table): ba.freestatistics.org/blog/index.php?pk=163656&T=1

As an alternative you can also use a QR Code:  

The GUIDs for individual cells are displayed in the table below:

Central Tendency - Ungrouped Data
MeasureValueS.E.Value/S.E.
Arithmetic Mean555.7976190476193.96151088495964140.299404744228
Geometric Mean554.619726380343
Harmonic Mean553.435604064351
Quadratic Mean556.968185378491
Winsorized Mean ( 1 / 28 )555.8928571428573.93193735220862141.378869332851
Winsorized Mean ( 2 / 28 )556.1309523809523.85783582273783144.156199987349
Winsorized Mean ( 3 / 28 )556.0595238095243.79816935063276146.401982764904
Winsorized Mean ( 4 / 28 )556.2976190476193.73335970512715149.007238248068
Winsorized Mean ( 5 / 28 )556.476190476193.70101303333084150.357803516129
Winsorized Mean ( 6 / 28 )556.1904761904763.53774322618077157.216180098781
Winsorized Mean ( 7 / 28 )555.6904761904763.38862530622671163.986993536694
Winsorized Mean ( 8 / 28 )555.5952380952383.30848970747515167.930169720623
Winsorized Mean ( 9 / 28 )555.273809523813.22183061920749172.347300386758
Winsorized Mean ( 10 / 28 )555.6309523809523.1639454335096175.613316998523
Winsorized Mean ( 11 / 28 )555.6309523809523.08210368071113180.276528612026
Winsorized Mean ( 12 / 28 )555.4880952380953.01666313466537184.139915675309
Winsorized Mean ( 13 / 28 )555.3333333333332.94719901318717188.427497039904
Winsorized Mean ( 14 / 28 )555.3333333333332.89772762640408191.644421053635
Winsorized Mean ( 15 / 28 )555.5119047619052.81874992371101197.077399484431
Winsorized Mean ( 16 / 28 )555.8928571428572.70880811093255205.216772239907
Winsorized Mean ( 17 / 28 )556.0952380952382.62330015162014211.983077022961
Winsorized Mean ( 18 / 28 )556.0952380952382.56357036459579216.922166746501
Winsorized Mean ( 19 / 28 )555.8690476190482.46988631895156225.058555672719
Winsorized Mean ( 20 / 28 )555.1547619047622.37398974785003233.848845559477
Winsorized Mean ( 21 / 28 )555.9047619047622.27275382280528244.595237868131
Winsorized Mean ( 22 / 28 )555.9047619047622.20367261436105252.262862587665
Winsorized Mean ( 23 / 28 )556.1785714285712.16814421006304256.5228681963
Winsorized Mean ( 24 / 28 )555.0357142857141.94808160107128284.913996405742
Winsorized Mean ( 25 / 28 )555.6309523809521.87173159478333296.853968768568
Winsorized Mean ( 26 / 28 )555.3214285714291.83343717806501302.885441189487
Winsorized Mean ( 27 / 28 )555.3214285714291.75354412975516316.685174412444
Winsorized Mean ( 28 / 28 )555.3214285714291.75354412975516316.685174412444
Trimmed Mean ( 1 / 28 )555.9634146341463.8120731331394145.842798712596
Trimmed Mean ( 2 / 28 )556.03753.6727892579815151.393793910623
Trimmed Mean ( 3 / 28 )555.9871794871793.55717739491519156.300099140947
Trimmed Mean ( 4 / 28 )555.9605263157893.44894801095515161.19713157457
Trimmed Mean ( 5 / 28 )555.8648648648653.34537451779596166.159233266082
Trimmed Mean ( 6 / 28 )555.7222222222223.23325239614965171.877154683009
Trimmed Mean ( 7 / 28 )555.6285714285713.14587846494086176.62111795505
Trimmed Mean ( 8 / 28 )555.6176470588243.07900288094987180.45376004566
Trimmed Mean ( 9 / 28 )555.6212121212123.01710470758924184.157086336314
Trimmed Mean ( 10 / 28 )555.6718752.96089381878196187.670314779674
Trimmed Mean ( 11 / 28 )555.6774193548392.90441540937244191.321605567058
Trimmed Mean ( 12 / 28 )555.6833333333332.85145335791313194.877230515184
Trimmed Mean ( 13 / 28 )555.7068965517242.79864808568267198.562620071674
Trimmed Mean ( 14 / 28 )555.752.74610113225486202.377834331129
Trimmed Mean ( 15 / 28 )555.7962962962962.68954801115047206.650446094305
Trimmed Mean ( 16 / 28 )555.8269230769232.63328290334601211.077557360303
Trimmed Mean ( 17 / 28 )555.822.58262483152473215.215153674432
Trimmed Mean ( 18 / 28 )555.7916666666672.53345668559338219.380765350046
Trimmed Mean ( 19 / 28 )555.7608695652172.48068573630906224.035177624763
Trimmed Mean ( 20 / 28 )555.752.42980197385205228.722342800204
Trimmed Mean ( 21 / 28 )555.8095238095242.38102206634376233.4331679097
Trimmed Mean ( 22 / 28 )555.82.33595091272626237.933081971886
Trimmed Mean ( 23 / 28 )555.7894736842112.28799759482736242.915235112451
Trimmed Mean ( 24 / 28 )555.752.22802318246182249.436363308362
Trimmed Mean ( 25 / 28 )555.8235294117652.19603864236937253.102800054589
Trimmed Mean ( 26 / 28 )555.843752.16511443441517256.727192412877
Trimmed Mean ( 27 / 28 )555.92.12448776787772261.663073991394
Trimmed Mean ( 28 / 28 )555.9642857142862.08197234456594267.03730583424
Median556.5
Midrange549
Midmean - Weighted Average at Xnp555.133333333333
Midmean - Weighted Average at X(n+1)p556.395348837209
Midmean - Empirical Distribution Function555.133333333333
Midmean - Empirical Distribution Function - Averaging556.395348837209
Midmean - Empirical Distribution Function - Interpolation556.395348837209
Midmean - Closest Observation555.133333333333
Midmean - True Basic - Statistics Graphics Toolkit556.395348837209
Midmean - MS Excel (old versions)555.133333333333
Number of observations84


Parameters (Session):
Parameters (R input):
R code (references can be found in the software module):
geomean <- function(x) {
return(exp(mean(log(x))))
}
harmean <- function(x) {
return(1/mean(1/x))
}
quamean <- function(x) {
return(sqrt(mean(x*x)))
}
winmean <- function(x) {
x <-sort(x[!is.na(x)])
n<-length(x)
denom <- 3
nodenom <- n/denom
if (nodenom>40) denom <- n/40
sqrtn = sqrt(n)
roundnodenom = floor(nodenom)
win <- array(NA,dim=c(roundnodenom,2))
for (j in 1:roundnodenom) {
win[j,1] <- (j*x[j+1]+sum(x[(j+1):(n-j)])+j*x[n-j])/n
win[j,2] <- sd(c(rep(x[j+1],j),x[(j+1):(n-j)],rep(x[n-j],j)))/sqrtn
}
return(win)
}
trimean <- function(x) {
x <-sort(x[!is.na(x)])
n<-length(x)
denom <- 3
nodenom <- n/denom
if (nodenom>40) denom <- n/40
sqrtn = sqrt(n)
roundnodenom = floor(nodenom)
tri <- array(NA,dim=c(roundnodenom,2))
for (j in 1:roundnodenom) {
tri[j,1] <- mean(x,trim=j/n)
tri[j,2] <- sd(x[(j+1):(n-j)]) / sqrt(n-j*2)
}
return(tri)
}
midrange <- function(x) {
return((max(x)+min(x))/2)
}
q1 <- function(data,n,p,i,f) {
np <- n*p;
i <<- floor(np)
f <<- np - i
qvalue <- (1-f)*data[i] + f*data[i+1]
}
q2 <- function(data,n,p,i,f) {
np <- (n+1)*p
i <<- floor(np)
f <<- np - i
qvalue <- (1-f)*data[i] + f*data[i+1]
}
q3 <- function(data,n,p,i,f) {
np <- n*p
i <<- floor(np)
f <<- np - i
if (f==0) {
qvalue <- data[i]
} else {
qvalue <- data[i+1]
}
}
q4 <- function(data,n,p,i,f) {
np <- n*p
i <<- floor(np)
f <<- np - i
if (f==0) {
qvalue <- (data[i]+data[i+1])/2
} else {
qvalue <- data[i+1]
}
}
q5 <- function(data,n,p,i,f) {
np <- (n-1)*p
i <<- floor(np)
f <<- np - i
if (f==0) {
qvalue <- data[i+1]
} else {
qvalue <- data[i+1] + f*(data[i+2]-data[i+1])
}
}
q6 <- function(data,n,p,i,f) {
np <- n*p+0.5
i <<- floor(np)
f <<- np - i
qvalue <- data[i]
}
q7 <- function(data,n,p,i,f) {
np <- (n+1)*p
i <<- floor(np)
f <<- np - i
if (f==0) {
qvalue <- data[i]
} else {
qvalue <- f*data[i] + (1-f)*data[i+1]
}
}
q8 <- function(data,n,p,i,f) {
np <- (n+1)*p
i <<- floor(np)
f <<- np - i
if (f==0) {
qvalue <- data[i]
} else {
if (f == 0.5) {
qvalue <- (data[i]+data[i+1])/2
} else {
if (f < 0.5) {
qvalue <- data[i]
} else {
qvalue <- data[i+1]
}
}
}
}
midmean <- function(x,def) {
x <-sort(x[!is.na(x)])
n<-length(x)
if (def==1) {
qvalue1 <- q1(x,n,0.25,i,f)
qvalue3 <- q1(x,n,0.75,i,f)
}
if (def==2) {
qvalue1 <- q2(x,n,0.25,i,f)
qvalue3 <- q2(x,n,0.75,i,f)
}
if (def==3) {
qvalue1 <- q3(x,n,0.25,i,f)
qvalue3 <- q3(x,n,0.75,i,f)
}
if (def==4) {
qvalue1 <- q4(x,n,0.25,i,f)
qvalue3 <- q4(x,n,0.75,i,f)
}
if (def==5) {
qvalue1 <- q5(x,n,0.25,i,f)
qvalue3 <- q5(x,n,0.75,i,f)
}
if (def==6) {
qvalue1 <- q6(x,n,0.25,i,f)
qvalue3 <- q6(x,n,0.75,i,f)
}
if (def==7) {
qvalue1 <- q7(x,n,0.25,i,f)
qvalue3 <- q7(x,n,0.75,i,f)
}
if (def==8) {
qvalue1 <- q8(x,n,0.25,i,f)
qvalue3 <- q8(x,n,0.75,i,f)
}
midm <- 0
myn <- 0
roundno4 <- round(n/4)
round3no4 <- round(3*n/4)
for (i in 1:n) {
if ((x[i]>=qvalue1) & (x[i]<=qvalue3)){
midm = midm + x[i]
myn = myn + 1
}
}
midm = midm / myn
return(midm)
}
(arm <- mean(x))
sqrtn <- sqrt(length(x))
(armse <- sd(x) / sqrtn)
(armose <- arm / armse)
(geo <- geomean(x))
(har <- harmean(x))
(qua <- quamean(x))
(win <- winmean(x))
(tri <- trimean(x))
(midr <- midrange(x))
midm <- array(NA,dim=8)
for (j in 1:8) midm[j] <- midmean(x,j)
midm
bitmap(file='test1.png')
lb <- win[,1] - 2*win[,2]
ub <- win[,1] + 2*win[,2]
if ((ylimmin == '') | (ylimmax == '')) plot(win[,1],type='b',main=main, xlab='j', pch=19, ylab='Winsorized Mean(j/n)', ylim=c(min(lb),max(ub))) else plot(win[,1],type='l',main=main, xlab='j', pch=19, ylab='Winsorized Mean(j/n)', ylim=c(ylimmin,ylimmax))
lines(ub,lty=3)
lines(lb,lty=3)
grid()
dev.off()
bitmap(file='test2.png')
lb <- tri[,1] - 2*tri[,2]
ub <- tri[,1] + 2*tri[,2]
if ((ylimmin == '') | (ylimmax == '')) plot(tri[,1],type='b',main=main, xlab='j', pch=19, ylab='Trimmed Mean(j/n)', ylim=c(min(lb),max(ub))) else plot(tri[,1],type='l',main=main, xlab='j', pch=19, ylab='Trimmed Mean(j/n)', ylim=c(ylimmin,ylimmax))
lines(ub,lty=3)
lines(lb,lty=3)
grid()
dev.off()
load(file='createtable')
a<-table.start()
a<-table.row.start(a)
a<-table.element(a,'Central Tendency - Ungrouped Data',4,TRUE)
a<-table.row.end(a)
a<-table.row.start(a)
a<-table.element(a,'Measure',header=TRUE)
a<-table.element(a,'Value',header=TRUE)
a<-table.element(a,'S.E.',header=TRUE)
a<-table.element(a,'Value/S.E.',header=TRUE)
a<-table.row.end(a)
a<-table.row.start(a)
a<-table.element(a,hyperlink('arithmetic_mean.htm', 'Arithmetic Mean', 'click to view the definition of the Arithmetic Mean'),header=TRUE)
a<-table.element(a,arm)
a<-table.element(a,hyperlink('arithmetic_mean_standard_error.htm', armse, 'click to view the definition of the Standard Error of the Arithmetic Mean'))
a<-table.element(a,armose)
a<-table.row.end(a)
a<-table.row.start(a)
a<-table.element(a,hyperlink('geometric_mean.htm', 'Geometric Mean', 'click to view the definition of the Geometric Mean'),header=TRUE)
a<-table.element(a,geo)
a<-table.element(a,'')
a<-table.row.end(a)
a<-table.row.start(a)
a<-table.element(a,hyperlink('harmonic_mean.htm', 'Harmonic Mean', 'click to view the definition of the Harmonic Mean'),header=TRUE)
a<-table.element(a,har)
a<-table.element(a,'')
a<-table.row.end(a)
a<-table.row.start(a)
a<-table.element(a,hyperlink('quadratic_mean.htm', 'Quadratic Mean', 'click to view the definition of the Quadratic Mean'),header=TRUE)
a<-table.element(a,qua)
a<-table.element(a,'')
a<-table.row.end(a)
for (j in 1:length(win[,1])) {
a<-table.row.start(a)
mylabel <- paste('Winsorized Mean (',j)
mylabel <- paste(mylabel,'/')
mylabel <- paste(mylabel,length(win[,1]))
mylabel <- paste(mylabel,')')
a<-table.element(a,hyperlink('winsorized_mean.htm', mylabel, 'click to view the definition of the Winsorized Mean'),header=TRUE)
a<-table.element(a,win[j,1])
a<-table.element(a,win[j,2])
a<-table.element(a,win[j,1]/win[j,2])
a<-table.row.end(a)
}
for (j in 1:length(tri[,1])) {
a<-table.row.start(a)
mylabel <- paste('Trimmed Mean (',j)
mylabel <- paste(mylabel,'/')
mylabel <- paste(mylabel,length(tri[,1]))
mylabel <- paste(mylabel,')')
a<-table.element(a,hyperlink('arithmetic_mean.htm', mylabel, 'click to view the definition of the Trimmed Mean'),header=TRUE)
a<-table.element(a,tri[j,1])
a<-table.element(a,tri[j,2])
a<-table.element(a,tri[j,1]/tri[j,2])
a<-table.row.end(a)
}
a<-table.row.start(a)
a<-table.element(a,hyperlink('median_1.htm', 'Median', 'click to view the definition of the Median'),header=TRUE)
a<-table.element(a,median(x))
a<-table.element(a,'')
a<-table.row.end(a)
a<-table.row.start(a)
a<-table.element(a,hyperlink('midrange.htm', 'Midrange', 'click to view the definition of the Midrange'),header=TRUE)
a<-table.element(a,midr)
a<-table.element(a,'')
a<-table.row.end(a)
a<-table.row.start(a)
mymid <- hyperlink('midmean.htm', 'Midmean', 'click to view the definition of the Midmean')
mylabel <- paste(mymid,hyperlink('method_1.htm','Weighted Average at Xnp',''),sep=' - ')
a<-table.element(a,mylabel,header=TRUE)
a<-table.element(a,midm[1])
a<-table.element(a,'')
a<-table.row.end(a)
a<-table.row.start(a)
mymid <- hyperlink('midmean.htm', 'Midmean', 'click to view the definition of the Midmean')
mylabel <- paste(mymid,hyperlink('method_2.htm','Weighted Average at X(n+1)p',''),sep=' - ')
a<-table.element(a,mylabel,header=TRUE)
a<-table.element(a,midm[2])
a<-table.element(a,'')
a<-table.row.end(a)
a<-table.row.start(a)
mymid <- hyperlink('midmean.htm', 'Midmean', 'click to view the definition of the Midmean')
mylabel <- paste(mymid,hyperlink('method_3.htm','Empirical Distribution Function',''),sep=' - ')
a<-table.element(a,mylabel,header=TRUE)
a<-table.element(a,midm[3])
a<-table.element(a,'')
a<-table.row.end(a)
a<-table.row.start(a)
mymid <- hyperlink('midmean.htm', 'Midmean', 'click to view the definition of the Midmean')
mylabel <- paste(mymid,hyperlink('method_4.htm','Empirical Distribution Function - Averaging',''),sep=' - ')
a<-table.element(a,mylabel,header=TRUE)
a<-table.element(a,midm[4])
a<-table.element(a,'')
a<-table.row.end(a)
a<-table.row.start(a)
mymid <- hyperlink('midmean.htm', 'Midmean', 'click to view the definition of the Midmean')
mylabel <- paste(mymid,hyperlink('method_5.htm','Empirical Distribution Function - Interpolation',''),sep=' - ')
a<-table.element(a,mylabel,header=TRUE)
a<-table.element(a,midm[5])
a<-table.element(a,'')
a<-table.row.end(a)
a<-table.row.start(a)
mymid <- hyperlink('midmean.htm', 'Midmean', 'click to view the definition of the Midmean')
mylabel <- paste(mymid,hyperlink('method_6.htm','Closest Observation',''),sep=' - ')
a<-table.element(a,mylabel,header=TRUE)
a<-table.element(a,midm[6])
a<-table.element(a,'')
a<-table.row.end(a)
a<-table.row.start(a)
mymid <- hyperlink('midmean.htm', 'Midmean', 'click to view the definition of the Midmean')
mylabel <- paste(mymid,hyperlink('method_7.htm','True Basic - Statistics Graphics Toolkit',''),sep=' - ')
a<-table.element(a,mylabel,header=TRUE)
a<-table.element(a,midm[7])
a<-table.element(a,'')
a<-table.row.end(a)
a<-table.row.start(a)
mymid <- hyperlink('midmean.htm', 'Midmean', 'click to view the definition of the Midmean')
mylabel <- paste(mymid,hyperlink('method_8.htm','MS Excel (old versions)',''),sep=' - ')
a<-table.element(a,mylabel,header=TRUE)
a<-table.element(a,midm[8])
a<-table.element(a,'')
a<-table.row.end(a)
a<-table.row.start(a)
a<-table.element(a,'Number of observations',header=TRUE)
a<-table.element(a,length(x))
a<-table.element(a,'')
a<-table.row.end(a)
a<-table.end(a)
table.save(a,file='mytable.tab')