Free Statistics

of Irreproducible Research!

Author's title

Author*Unverified author*
R Software Modulerwasp_centraltendency.wasp
Title produced by softwareCentral Tendency
Date of computationWed, 07 Mar 2012 09:40:52 -0500
Cite this page as followsStatistical Computations at FreeStatistics.org, Office for Research Development and Education, URL https://freestatistics.org/blog/index.php?v=date/2012/Mar/07/t1331131514jll2sv5v58xgdy4.htm/, Retrieved Sun, 28 Apr 2024 23:27:18 +0000
Statistical Computations at FreeStatistics.org, Office for Research Development and Education, URL https://freestatistics.org/blog/index.php?pk=163610, Retrieved Sun, 28 Apr 2024 23:27:18 +0000
QR Codes:

Original text written by user:
IsPrivate?No (this computation is public)
User-defined keywordsKDG2011W52a
Estimated Impact145
Family? (F = Feedback message, R = changed R code, M = changed R Module, P = changed Parameters, D = changed Data)
-       [Central Tendency] [Robustness of Cen...] [2012-03-07 14:40:52] [ef02148344264346fe23a57cc665e979] [Current]
Feedback Forum

Post a new message
Dataseries X:
78,7
75,7
77,1
86,1
86,8
86,3
91,5
90,7
78,2
73
73,7
77,3
67,5
72,7
76,6
82,4
82,3
86,3
93
88,8
96,9
103,9
115,7
112,8
114,7
118
129,3
137
156
166,2
167,8
144,3
126
90,4
67,5
52,4
54,6
52,9
59,1
63,3
73,8
87,6
81,8
90,7
86,3
93,6
98
94,3
97,6
94,2
100,2
106,7
95,7
94,6
94,7
96,2
96,3
103,3
106,8
113,7
117,4
123,6
137,6
147,4
137,2
133,8
136,7
127,3
128,7
127
133,7
132


Summary of computational transaction
Raw Inputview raw input (R code)
Raw Outputview raw output of R engine
Computing time1 seconds
R Server'Gertrude Mary Cox' @ cox.wessa.net

\begin{tabular}{lllllllll}
\hline
Summary of computational transaction \tabularnewline
Raw Input & view raw input (R code)  \tabularnewline
Raw Output & view raw output of R engine  \tabularnewline
Computing time & 1 seconds \tabularnewline
R Server & 'Gertrude Mary Cox' @ cox.wessa.net \tabularnewline
\hline
\end{tabular}
%Source: https://freestatistics.org/blog/index.php?pk=163610&T=0

[TABLE]
[ROW][C]Summary of computational transaction[/C][/ROW]
[ROW][C]Raw Input[/C][C]view raw input (R code) [/C][/ROW]
[ROW][C]Raw Output[/C][C]view raw output of R engine [/C][/ROW]
[ROW][C]Computing time[/C][C]1 seconds[/C][/ROW]
[ROW][C]R Server[/C][C]'Gertrude Mary Cox' @ cox.wessa.net[/C][/ROW]
[/TABLE]
Source: https://freestatistics.org/blog/index.php?pk=163610&T=0

Globally Unique Identifier (entire table): ba.freestatistics.org/blog/index.php?pk=163610&T=0

As an alternative you can also use a QR Code:  

The GUIDs for individual cells are displayed in the table below:

Summary of computational transaction
Raw Inputview raw input (R code)
Raw Outputview raw output of R engine
Computing time1 seconds
R Server'Gertrude Mary Cox' @ cox.wessa.net


Central Tendency - Ungrouped Data
MeasureValueS.E.Value/S.E.
Arithmetic Mean100.5833333333333.173410782382331.6956550005243
Geometric Mean97.0860755061532
Harmonic Mean93.6405413164596
Quadratic Mean104.07696671214
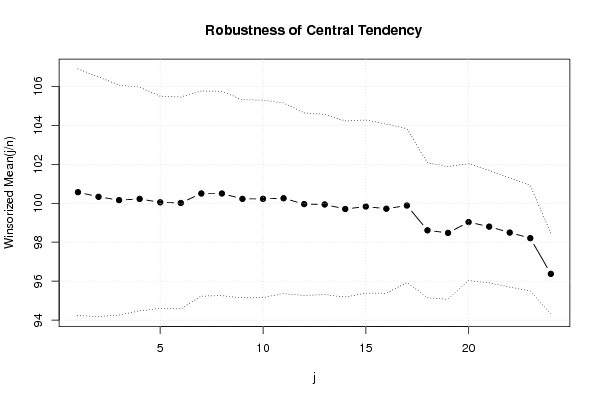
Winsorized Mean ( 1 / 24 )100.5680555555563.1653721262944931.7713215201918
Winsorized Mean ( 2 / 24 )100.3319444444443.0778887511207732.5976513634256
Winsorized Mean ( 3 / 24 )100.1611111111112.9537816637654533.9094498214965
Winsorized Mean ( 4 / 24 )100.2222222222222.8717658697345234.8991619680636
Winsorized Mean ( 5 / 24 )100.0486111111112.7252011691947536.712376408041
Winsorized Mean ( 6 / 24 )100.0152777777782.7187559722181636.7871477984021
Winsorized Mean ( 7 / 24 )100.5013888888892.6347618199061638.1443924568743
Winsorized Mean ( 8 / 24 )100.5013888888892.6233329851396338.3105726410632
Winsorized Mean ( 9 / 24 )100.2263888888892.5414682775306639.4364115322623
Winsorized Mean ( 10 / 24 )100.2263888888892.536845842240139.5082693713806
Winsorized Mean ( 11 / 24 )100.2569444444442.4471573576247340.9687362899115
Winsorized Mean ( 12 / 24 )99.95694444444442.3452477724533842.6210593262301
Winsorized Mean ( 13 / 24 )99.93888888888892.3136100986125643.1960808559839
Winsorized Mean ( 14 / 24 )99.70555555555552.2609591294429244.098787216964
Winsorized Mean ( 15 / 24 )99.83055555555562.2242832529588444.8821234538167
Winsorized Mean ( 16 / 24 )99.71944444444442.1710362573452645.9317268917385
Winsorized Mean ( 17 / 24 )99.88472222222221.9776862238902350.5058492169415
Winsorized Mean ( 18 / 24 )98.60972222222221.7322587854289356.9255142774786
Winsorized Mean ( 19 / 24 )98.47777777777781.7038909056617557.7958233420652
Winsorized Mean ( 20 / 24 )99.03333333333331.4988610699602166.0723901088195
Winsorized Mean ( 21 / 24 )98.81.4463420483460268.3102590517807
Winsorized Mean ( 22 / 24 )98.49444444444451.3992996360309370.3883870961485
Winsorized Mean ( 23 / 24 )98.20694444444441.3554984623132972.4507973818318
Winsorized Mean ( 24 / 24 )96.37361111111111.0402784045914392.6421337651066
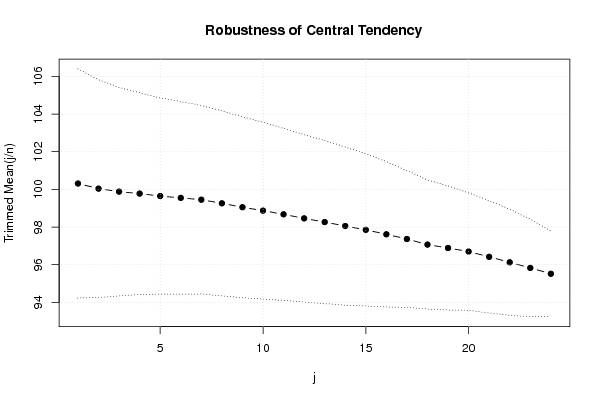
Trimmed Mean ( 1 / 24 )100.3114285714293.0399578718729832.9976377302968
Trimmed Mean ( 2 / 24 )100.0397058823532.8895957439128334.6206579564268
Trimmed Mean ( 3 / 24 )99.8803030303032.7669176337687536.0980398589815
Trimmed Mean ( 4 / 24 )99.7752.6782514359126737.2537838166041
Trimmed Mean ( 5 / 24 )99.64516129032262.6021039339797738.2940742639442
Trimmed Mean ( 6 / 24 )99.54833333333332.556329788352338.9418977891338
Trimmed Mean ( 7 / 24 )99.4517241379312.5015412567619139.7561798627559
Trimmed Mean ( 8 / 24 )99.25892857142862.4548107774641240.4344520085436
Trimmed Mean ( 9 / 24 )99.05185185185192.3986584020166241.2946886345201
Trimmed Mean ( 10 / 24 )98.87115384615382.3475257931406242.1171746589757
Trimmed Mean ( 11 / 24 )98.6762.2831531365412143.2191772074851
Trimmed Mean ( 12 / 24 )98.46041666666672.2212220687215544.3271377739087
Trimmed Mean ( 13 / 24 )98.26521739130432.1647153250631745.3940600196181
Trimmed Mean ( 14 / 24 )98.05454545454542.0974928518815146.7484527380333
Trimmed Mean ( 15 / 24 )97.8523809523812.0213788778675248.4087283308371
Trimmed Mean ( 16 / 24 )97.6151.9278643358483250.6337495771175
Trimmed Mean ( 17 / 24 )97.36578947368421.8150911412005553.642369390489
Trimmed Mean ( 18 / 24 )97.06944444444441.7132667183846556.6575206316773
Trimmed Mean ( 19 / 24 )96.88823529411761.6463418352843858.8506185153109
Trimmed Mean ( 20 / 24 )96.71.5584512059382362.0487825551035
Trimmed Mean ( 21 / 24 )96.421.4908255832055764.6755737801855
Trimmed Mean ( 22 / 24 )96.12857142857141.4060889615527468.3659242459433
Trimmed Mean ( 23 / 24 )95.83076923076921.2931865143693574.1043679051225
Trimmed Mean ( 24 / 24 )95.52083333333331.1308580038533784.467575069415
Median94.65
Midrange110.1
Midmean - Weighted Average at Xnp96.6567567567567
Midmean - Weighted Average at X(n+1)p97.0694444444444
Midmean - Empirical Distribution Function96.6567567567567
Midmean - Empirical Distribution Function - Averaging97.0694444444444
Midmean - Empirical Distribution Function - Interpolation97.0694444444444
Midmean - Closest Observation96.6567567567567
Midmean - True Basic - Statistics Graphics Toolkit97.0694444444444
Midmean - MS Excel (old versions)97.3657894736842
Number of observations72

\begin{tabular}{lllllllll}
\hline
Central Tendency - Ungrouped Data \tabularnewline
Measure & Value & S.E. & Value/S.E. \tabularnewline
Arithmetic Mean & 100.583333333333 & 3.1734107823823 & 31.6956550005243 \tabularnewline
Geometric Mean & 97.0860755061532 &  &  \tabularnewline
Harmonic Mean & 93.6405413164596 &  &  \tabularnewline
Quadratic Mean & 104.07696671214 &  &  \tabularnewline
Winsorized Mean ( 1 / 24 ) & 100.568055555556 & 3.16537212629449 & 31.7713215201918 \tabularnewline
Winsorized Mean ( 2 / 24 ) & 100.331944444444 & 3.07788875112077 & 32.5976513634256 \tabularnewline
Winsorized Mean ( 3 / 24 ) & 100.161111111111 & 2.95378166376545 & 33.9094498214965 \tabularnewline
Winsorized Mean ( 4 / 24 ) & 100.222222222222 & 2.87176586973452 & 34.8991619680636 \tabularnewline
Winsorized Mean ( 5 / 24 ) & 100.048611111111 & 2.72520116919475 & 36.712376408041 \tabularnewline
Winsorized Mean ( 6 / 24 ) & 100.015277777778 & 2.71875597221816 & 36.7871477984021 \tabularnewline
Winsorized Mean ( 7 / 24 ) & 100.501388888889 & 2.63476181990616 & 38.1443924568743 \tabularnewline
Winsorized Mean ( 8 / 24 ) & 100.501388888889 & 2.62333298513963 & 38.3105726410632 \tabularnewline
Winsorized Mean ( 9 / 24 ) & 100.226388888889 & 2.54146827753066 & 39.4364115322623 \tabularnewline
Winsorized Mean ( 10 / 24 ) & 100.226388888889 & 2.5368458422401 & 39.5082693713806 \tabularnewline
Winsorized Mean ( 11 / 24 ) & 100.256944444444 & 2.44715735762473 & 40.9687362899115 \tabularnewline
Winsorized Mean ( 12 / 24 ) & 99.9569444444444 & 2.34524777245338 & 42.6210593262301 \tabularnewline
Winsorized Mean ( 13 / 24 ) & 99.9388888888889 & 2.31361009861256 & 43.1960808559839 \tabularnewline
Winsorized Mean ( 14 / 24 ) & 99.7055555555555 & 2.26095912944292 & 44.098787216964 \tabularnewline
Winsorized Mean ( 15 / 24 ) & 99.8305555555556 & 2.22428325295884 & 44.8821234538167 \tabularnewline
Winsorized Mean ( 16 / 24 ) & 99.7194444444444 & 2.17103625734526 & 45.9317268917385 \tabularnewline
Winsorized Mean ( 17 / 24 ) & 99.8847222222222 & 1.97768622389023 & 50.5058492169415 \tabularnewline
Winsorized Mean ( 18 / 24 ) & 98.6097222222222 & 1.73225878542893 & 56.9255142774786 \tabularnewline
Winsorized Mean ( 19 / 24 ) & 98.4777777777778 & 1.70389090566175 & 57.7958233420652 \tabularnewline
Winsorized Mean ( 20 / 24 ) & 99.0333333333333 & 1.49886106996021 & 66.0723901088195 \tabularnewline
Winsorized Mean ( 21 / 24 ) & 98.8 & 1.44634204834602 & 68.3102590517807 \tabularnewline
Winsorized Mean ( 22 / 24 ) & 98.4944444444445 & 1.39929963603093 & 70.3883870961485 \tabularnewline
Winsorized Mean ( 23 / 24 ) & 98.2069444444444 & 1.35549846231329 & 72.4507973818318 \tabularnewline
Winsorized Mean ( 24 / 24 ) & 96.3736111111111 & 1.04027840459143 & 92.6421337651066 \tabularnewline
Trimmed Mean ( 1 / 24 ) & 100.311428571429 & 3.03995787187298 & 32.9976377302968 \tabularnewline
Trimmed Mean ( 2 / 24 ) & 100.039705882353 & 2.88959574391283 & 34.6206579564268 \tabularnewline
Trimmed Mean ( 3 / 24 ) & 99.880303030303 & 2.76691763376875 & 36.0980398589815 \tabularnewline
Trimmed Mean ( 4 / 24 ) & 99.775 & 2.67825143591267 & 37.2537838166041 \tabularnewline
Trimmed Mean ( 5 / 24 ) & 99.6451612903226 & 2.60210393397977 & 38.2940742639442 \tabularnewline
Trimmed Mean ( 6 / 24 ) & 99.5483333333333 & 2.5563297883523 & 38.9418977891338 \tabularnewline
Trimmed Mean ( 7 / 24 ) & 99.451724137931 & 2.50154125676191 & 39.7561798627559 \tabularnewline
Trimmed Mean ( 8 / 24 ) & 99.2589285714286 & 2.45481077746412 & 40.4344520085436 \tabularnewline
Trimmed Mean ( 9 / 24 ) & 99.0518518518519 & 2.39865840201662 & 41.2946886345201 \tabularnewline
Trimmed Mean ( 10 / 24 ) & 98.8711538461538 & 2.34752579314062 & 42.1171746589757 \tabularnewline
Trimmed Mean ( 11 / 24 ) & 98.676 & 2.28315313654121 & 43.2191772074851 \tabularnewline
Trimmed Mean ( 12 / 24 ) & 98.4604166666667 & 2.22122206872155 & 44.3271377739087 \tabularnewline
Trimmed Mean ( 13 / 24 ) & 98.2652173913043 & 2.16471532506317 & 45.3940600196181 \tabularnewline
Trimmed Mean ( 14 / 24 ) & 98.0545454545454 & 2.09749285188151 & 46.7484527380333 \tabularnewline
Trimmed Mean ( 15 / 24 ) & 97.852380952381 & 2.02137887786752 & 48.4087283308371 \tabularnewline
Trimmed Mean ( 16 / 24 ) & 97.615 & 1.92786433584832 & 50.6337495771175 \tabularnewline
Trimmed Mean ( 17 / 24 ) & 97.3657894736842 & 1.81509114120055 & 53.642369390489 \tabularnewline
Trimmed Mean ( 18 / 24 ) & 97.0694444444444 & 1.71326671838465 & 56.6575206316773 \tabularnewline
Trimmed Mean ( 19 / 24 ) & 96.8882352941176 & 1.64634183528438 & 58.8506185153109 \tabularnewline
Trimmed Mean ( 20 / 24 ) & 96.7 & 1.55845120593823 & 62.0487825551035 \tabularnewline
Trimmed Mean ( 21 / 24 ) & 96.42 & 1.49082558320557 & 64.6755737801855 \tabularnewline
Trimmed Mean ( 22 / 24 ) & 96.1285714285714 & 1.40608896155274 & 68.3659242459433 \tabularnewline
Trimmed Mean ( 23 / 24 ) & 95.8307692307692 & 1.29318651436935 & 74.1043679051225 \tabularnewline
Trimmed Mean ( 24 / 24 ) & 95.5208333333333 & 1.13085800385337 & 84.467575069415 \tabularnewline
Median & 94.65 &  &  \tabularnewline
Midrange & 110.1 &  &  \tabularnewline
Midmean - Weighted Average at Xnp & 96.6567567567567 &  &  \tabularnewline
Midmean - Weighted Average at X(n+1)p & 97.0694444444444 &  &  \tabularnewline
Midmean - Empirical Distribution Function & 96.6567567567567 &  &  \tabularnewline
Midmean - Empirical Distribution Function - Averaging & 97.0694444444444 &  &  \tabularnewline
Midmean - Empirical Distribution Function - Interpolation & 97.0694444444444 &  &  \tabularnewline
Midmean - Closest Observation & 96.6567567567567 &  &  \tabularnewline
Midmean - True Basic - Statistics Graphics Toolkit & 97.0694444444444 &  &  \tabularnewline
Midmean - MS Excel (old versions) & 97.3657894736842 &  &  \tabularnewline
Number of observations & 72 &  &  \tabularnewline
\hline
\end{tabular}
%Source: https://freestatistics.org/blog/index.php?pk=163610&T=1

[TABLE]
[ROW][C]Central Tendency - Ungrouped Data[/C][/ROW]
[ROW][C]Measure[/C][C]Value[/C][C]S.E.[/C][C]Value/S.E.[/C][/ROW]
[ROW][C]Arithmetic Mean[/C][C]100.583333333333[/C][C]3.1734107823823[/C][C]31.6956550005243[/C][/ROW]
[ROW][C]Geometric Mean[/C][C]97.0860755061532[/C][C][/C][C][/C][/ROW]
[ROW][C]Harmonic Mean[/C][C]93.6405413164596[/C][C][/C][C][/C][/ROW]
[ROW][C]Quadratic Mean[/C][C]104.07696671214[/C][C][/C][C][/C][/ROW]
[ROW][C]Winsorized Mean ( 1 / 24 )[/C][C]100.568055555556[/C][C]3.16537212629449[/C][C]31.7713215201918[/C][/ROW]
[ROW][C]Winsorized Mean ( 2 / 24 )[/C][C]100.331944444444[/C][C]3.07788875112077[/C][C]32.5976513634256[/C][/ROW]
[ROW][C]Winsorized Mean ( 3 / 24 )[/C][C]100.161111111111[/C][C]2.95378166376545[/C][C]33.9094498214965[/C][/ROW]
[ROW][C]Winsorized Mean ( 4 / 24 )[/C][C]100.222222222222[/C][C]2.87176586973452[/C][C]34.8991619680636[/C][/ROW]
[ROW][C]Winsorized Mean ( 5 / 24 )[/C][C]100.048611111111[/C][C]2.72520116919475[/C][C]36.712376408041[/C][/ROW]
[ROW][C]Winsorized Mean ( 6 / 24 )[/C][C]100.015277777778[/C][C]2.71875597221816[/C][C]36.7871477984021[/C][/ROW]
[ROW][C]Winsorized Mean ( 7 / 24 )[/C][C]100.501388888889[/C][C]2.63476181990616[/C][C]38.1443924568743[/C][/ROW]
[ROW][C]Winsorized Mean ( 8 / 24 )[/C][C]100.501388888889[/C][C]2.62333298513963[/C][C]38.3105726410632[/C][/ROW]
[ROW][C]Winsorized Mean ( 9 / 24 )[/C][C]100.226388888889[/C][C]2.54146827753066[/C][C]39.4364115322623[/C][/ROW]
[ROW][C]Winsorized Mean ( 10 / 24 )[/C][C]100.226388888889[/C][C]2.5368458422401[/C][C]39.5082693713806[/C][/ROW]
[ROW][C]Winsorized Mean ( 11 / 24 )[/C][C]100.256944444444[/C][C]2.44715735762473[/C][C]40.9687362899115[/C][/ROW]
[ROW][C]Winsorized Mean ( 12 / 24 )[/C][C]99.9569444444444[/C][C]2.34524777245338[/C][C]42.6210593262301[/C][/ROW]
[ROW][C]Winsorized Mean ( 13 / 24 )[/C][C]99.9388888888889[/C][C]2.31361009861256[/C][C]43.1960808559839[/C][/ROW]
[ROW][C]Winsorized Mean ( 14 / 24 )[/C][C]99.7055555555555[/C][C]2.26095912944292[/C][C]44.098787216964[/C][/ROW]
[ROW][C]Winsorized Mean ( 15 / 24 )[/C][C]99.8305555555556[/C][C]2.22428325295884[/C][C]44.8821234538167[/C][/ROW]
[ROW][C]Winsorized Mean ( 16 / 24 )[/C][C]99.7194444444444[/C][C]2.17103625734526[/C][C]45.9317268917385[/C][/ROW]
[ROW][C]Winsorized Mean ( 17 / 24 )[/C][C]99.8847222222222[/C][C]1.97768622389023[/C][C]50.5058492169415[/C][/ROW]
[ROW][C]Winsorized Mean ( 18 / 24 )[/C][C]98.6097222222222[/C][C]1.73225878542893[/C][C]56.9255142774786[/C][/ROW]
[ROW][C]Winsorized Mean ( 19 / 24 )[/C][C]98.4777777777778[/C][C]1.70389090566175[/C][C]57.7958233420652[/C][/ROW]
[ROW][C]Winsorized Mean ( 20 / 24 )[/C][C]99.0333333333333[/C][C]1.49886106996021[/C][C]66.0723901088195[/C][/ROW]
[ROW][C]Winsorized Mean ( 21 / 24 )[/C][C]98.8[/C][C]1.44634204834602[/C][C]68.3102590517807[/C][/ROW]
[ROW][C]Winsorized Mean ( 22 / 24 )[/C][C]98.4944444444445[/C][C]1.39929963603093[/C][C]70.3883870961485[/C][/ROW]
[ROW][C]Winsorized Mean ( 23 / 24 )[/C][C]98.2069444444444[/C][C]1.35549846231329[/C][C]72.4507973818318[/C][/ROW]
[ROW][C]Winsorized Mean ( 24 / 24 )[/C][C]96.3736111111111[/C][C]1.04027840459143[/C][C]92.6421337651066[/C][/ROW]
[ROW][C]Trimmed Mean ( 1 / 24 )[/C][C]100.311428571429[/C][C]3.03995787187298[/C][C]32.9976377302968[/C][/ROW]
[ROW][C]Trimmed Mean ( 2 / 24 )[/C][C]100.039705882353[/C][C]2.88959574391283[/C][C]34.6206579564268[/C][/ROW]
[ROW][C]Trimmed Mean ( 3 / 24 )[/C][C]99.880303030303[/C][C]2.76691763376875[/C][C]36.0980398589815[/C][/ROW]
[ROW][C]Trimmed Mean ( 4 / 24 )[/C][C]99.775[/C][C]2.67825143591267[/C][C]37.2537838166041[/C][/ROW]
[ROW][C]Trimmed Mean ( 5 / 24 )[/C][C]99.6451612903226[/C][C]2.60210393397977[/C][C]38.2940742639442[/C][/ROW]
[ROW][C]Trimmed Mean ( 6 / 24 )[/C][C]99.5483333333333[/C][C]2.5563297883523[/C][C]38.9418977891338[/C][/ROW]
[ROW][C]Trimmed Mean ( 7 / 24 )[/C][C]99.451724137931[/C][C]2.50154125676191[/C][C]39.7561798627559[/C][/ROW]
[ROW][C]Trimmed Mean ( 8 / 24 )[/C][C]99.2589285714286[/C][C]2.45481077746412[/C][C]40.4344520085436[/C][/ROW]
[ROW][C]Trimmed Mean ( 9 / 24 )[/C][C]99.0518518518519[/C][C]2.39865840201662[/C][C]41.2946886345201[/C][/ROW]
[ROW][C]Trimmed Mean ( 10 / 24 )[/C][C]98.8711538461538[/C][C]2.34752579314062[/C][C]42.1171746589757[/C][/ROW]
[ROW][C]Trimmed Mean ( 11 / 24 )[/C][C]98.676[/C][C]2.28315313654121[/C][C]43.2191772074851[/C][/ROW]
[ROW][C]Trimmed Mean ( 12 / 24 )[/C][C]98.4604166666667[/C][C]2.22122206872155[/C][C]44.3271377739087[/C][/ROW]
[ROW][C]Trimmed Mean ( 13 / 24 )[/C][C]98.2652173913043[/C][C]2.16471532506317[/C][C]45.3940600196181[/C][/ROW]
[ROW][C]Trimmed Mean ( 14 / 24 )[/C][C]98.0545454545454[/C][C]2.09749285188151[/C][C]46.7484527380333[/C][/ROW]
[ROW][C]Trimmed Mean ( 15 / 24 )[/C][C]97.852380952381[/C][C]2.02137887786752[/C][C]48.4087283308371[/C][/ROW]
[ROW][C]Trimmed Mean ( 16 / 24 )[/C][C]97.615[/C][C]1.92786433584832[/C][C]50.6337495771175[/C][/ROW]
[ROW][C]Trimmed Mean ( 17 / 24 )[/C][C]97.3657894736842[/C][C]1.81509114120055[/C][C]53.642369390489[/C][/ROW]
[ROW][C]Trimmed Mean ( 18 / 24 )[/C][C]97.0694444444444[/C][C]1.71326671838465[/C][C]56.6575206316773[/C][/ROW]
[ROW][C]Trimmed Mean ( 19 / 24 )[/C][C]96.8882352941176[/C][C]1.64634183528438[/C][C]58.8506185153109[/C][/ROW]
[ROW][C]Trimmed Mean ( 20 / 24 )[/C][C]96.7[/C][C]1.55845120593823[/C][C]62.0487825551035[/C][/ROW]
[ROW][C]Trimmed Mean ( 21 / 24 )[/C][C]96.42[/C][C]1.49082558320557[/C][C]64.6755737801855[/C][/ROW]
[ROW][C]Trimmed Mean ( 22 / 24 )[/C][C]96.1285714285714[/C][C]1.40608896155274[/C][C]68.3659242459433[/C][/ROW]
[ROW][C]Trimmed Mean ( 23 / 24 )[/C][C]95.8307692307692[/C][C]1.29318651436935[/C][C]74.1043679051225[/C][/ROW]
[ROW][C]Trimmed Mean ( 24 / 24 )[/C][C]95.5208333333333[/C][C]1.13085800385337[/C][C]84.467575069415[/C][/ROW]
[ROW][C]Median[/C][C]94.65[/C][C][/C][C][/C][/ROW]
[ROW][C]Midrange[/C][C]110.1[/C][C][/C][C][/C][/ROW]
[ROW][C]Midmean - Weighted Average at Xnp[/C][C]96.6567567567567[/C][C][/C][C][/C][/ROW]
[ROW][C]Midmean - Weighted Average at X(n+1)p[/C][C]97.0694444444444[/C][C][/C][C][/C][/ROW]
[ROW][C]Midmean - Empirical Distribution Function[/C][C]96.6567567567567[/C][C][/C][C][/C][/ROW]
[ROW][C]Midmean - Empirical Distribution Function - Averaging[/C][C]97.0694444444444[/C][C][/C][C][/C][/ROW]
[ROW][C]Midmean - Empirical Distribution Function - Interpolation[/C][C]97.0694444444444[/C][C][/C][C][/C][/ROW]
[ROW][C]Midmean - Closest Observation[/C][C]96.6567567567567[/C][C][/C][C][/C][/ROW]
[ROW][C]Midmean - True Basic - Statistics Graphics Toolkit[/C][C]97.0694444444444[/C][C][/C][C][/C][/ROW]
[ROW][C]Midmean - MS Excel (old versions)[/C][C]97.3657894736842[/C][C][/C][C][/C][/ROW]
[ROW][C]Number of observations[/C][C]72[/C][C][/C][C][/C][/ROW]
[/TABLE]
Source: https://freestatistics.org/blog/index.php?pk=163610&T=1

Globally Unique Identifier (entire table): ba.freestatistics.org/blog/index.php?pk=163610&T=1

As an alternative you can also use a QR Code:  

The GUIDs for individual cells are displayed in the table below:

Central Tendency - Ungrouped Data
MeasureValueS.E.Value/S.E.
Arithmetic Mean100.5833333333333.173410782382331.6956550005243
Geometric Mean97.0860755061532
Harmonic Mean93.6405413164596
Quadratic Mean104.07696671214
Winsorized Mean ( 1 / 24 )100.5680555555563.1653721262944931.7713215201918
Winsorized Mean ( 2 / 24 )100.3319444444443.0778887511207732.5976513634256
Winsorized Mean ( 3 / 24 )100.1611111111112.9537816637654533.9094498214965
Winsorized Mean ( 4 / 24 )100.2222222222222.8717658697345234.8991619680636
Winsorized Mean ( 5 / 24 )100.0486111111112.7252011691947536.712376408041
Winsorized Mean ( 6 / 24 )100.0152777777782.7187559722181636.7871477984021
Winsorized Mean ( 7 / 24 )100.5013888888892.6347618199061638.1443924568743
Winsorized Mean ( 8 / 24 )100.5013888888892.6233329851396338.3105726410632
Winsorized Mean ( 9 / 24 )100.2263888888892.5414682775306639.4364115322623
Winsorized Mean ( 10 / 24 )100.2263888888892.536845842240139.5082693713806
Winsorized Mean ( 11 / 24 )100.2569444444442.4471573576247340.9687362899115
Winsorized Mean ( 12 / 24 )99.95694444444442.3452477724533842.6210593262301
Winsorized Mean ( 13 / 24 )99.93888888888892.3136100986125643.1960808559839
Winsorized Mean ( 14 / 24 )99.70555555555552.2609591294429244.098787216964
Winsorized Mean ( 15 / 24 )99.83055555555562.2242832529588444.8821234538167
Winsorized Mean ( 16 / 24 )99.71944444444442.1710362573452645.9317268917385
Winsorized Mean ( 17 / 24 )99.88472222222221.9776862238902350.5058492169415
Winsorized Mean ( 18 / 24 )98.60972222222221.7322587854289356.9255142774786
Winsorized Mean ( 19 / 24 )98.47777777777781.7038909056617557.7958233420652
Winsorized Mean ( 20 / 24 )99.03333333333331.4988610699602166.0723901088195
Winsorized Mean ( 21 / 24 )98.81.4463420483460268.3102590517807
Winsorized Mean ( 22 / 24 )98.49444444444451.3992996360309370.3883870961485
Winsorized Mean ( 23 / 24 )98.20694444444441.3554984623132972.4507973818318
Winsorized Mean ( 24 / 24 )96.37361111111111.0402784045914392.6421337651066
Trimmed Mean ( 1 / 24 )100.3114285714293.0399578718729832.9976377302968
Trimmed Mean ( 2 / 24 )100.0397058823532.8895957439128334.6206579564268
Trimmed Mean ( 3 / 24 )99.8803030303032.7669176337687536.0980398589815
Trimmed Mean ( 4 / 24 )99.7752.6782514359126737.2537838166041
Trimmed Mean ( 5 / 24 )99.64516129032262.6021039339797738.2940742639442
Trimmed Mean ( 6 / 24 )99.54833333333332.556329788352338.9418977891338
Trimmed Mean ( 7 / 24 )99.4517241379312.5015412567619139.7561798627559
Trimmed Mean ( 8 / 24 )99.25892857142862.4548107774641240.4344520085436
Trimmed Mean ( 9 / 24 )99.05185185185192.3986584020166241.2946886345201
Trimmed Mean ( 10 / 24 )98.87115384615382.3475257931406242.1171746589757
Trimmed Mean ( 11 / 24 )98.6762.2831531365412143.2191772074851
Trimmed Mean ( 12 / 24 )98.46041666666672.2212220687215544.3271377739087
Trimmed Mean ( 13 / 24 )98.26521739130432.1647153250631745.3940600196181
Trimmed Mean ( 14 / 24 )98.05454545454542.0974928518815146.7484527380333
Trimmed Mean ( 15 / 24 )97.8523809523812.0213788778675248.4087283308371
Trimmed Mean ( 16 / 24 )97.6151.9278643358483250.6337495771175
Trimmed Mean ( 17 / 24 )97.36578947368421.8150911412005553.642369390489
Trimmed Mean ( 18 / 24 )97.06944444444441.7132667183846556.6575206316773
Trimmed Mean ( 19 / 24 )96.88823529411761.6463418352843858.8506185153109
Trimmed Mean ( 20 / 24 )96.71.5584512059382362.0487825551035
Trimmed Mean ( 21 / 24 )96.421.4908255832055764.6755737801855
Trimmed Mean ( 22 / 24 )96.12857142857141.4060889615527468.3659242459433
Trimmed Mean ( 23 / 24 )95.83076923076921.2931865143693574.1043679051225
Trimmed Mean ( 24 / 24 )95.52083333333331.1308580038533784.467575069415
Median94.65
Midrange110.1
Midmean - Weighted Average at Xnp96.6567567567567
Midmean - Weighted Average at X(n+1)p97.0694444444444
Midmean - Empirical Distribution Function96.6567567567567
Midmean - Empirical Distribution Function - Averaging97.0694444444444
Midmean - Empirical Distribution Function - Interpolation97.0694444444444
Midmean - Closest Observation96.6567567567567
Midmean - True Basic - Statistics Graphics Toolkit97.0694444444444
Midmean - MS Excel (old versions)97.3657894736842
Number of observations72


Parameters (Session):
Parameters (R input):
R code (references can be found in the software module):
geomean <- function(x) {
return(exp(mean(log(x))))
}
harmean <- function(x) {
return(1/mean(1/x))
}
quamean <- function(x) {
return(sqrt(mean(x*x)))
}
winmean <- function(x) {
x <-sort(x[!is.na(x)])
n<-length(x)
denom <- 3
nodenom <- n/denom
if (nodenom>40) denom <- n/40
sqrtn = sqrt(n)
roundnodenom = floor(nodenom)
win <- array(NA,dim=c(roundnodenom,2))
for (j in 1:roundnodenom) {
win[j,1] <- (j*x[j+1]+sum(x[(j+1):(n-j)])+j*x[n-j])/n
win[j,2] <- sd(c(rep(x[j+1],j),x[(j+1):(n-j)],rep(x[n-j],j)))/sqrtn
}
return(win)
}
trimean <- function(x) {
x <-sort(x[!is.na(x)])
n<-length(x)
denom <- 3
nodenom <- n/denom
if (nodenom>40) denom <- n/40
sqrtn = sqrt(n)
roundnodenom = floor(nodenom)
tri <- array(NA,dim=c(roundnodenom,2))
for (j in 1:roundnodenom) {
tri[j,1] <- mean(x,trim=j/n)
tri[j,2] <- sd(x[(j+1):(n-j)]) / sqrt(n-j*2)
}
return(tri)
}
midrange <- function(x) {
return((max(x)+min(x))/2)
}
q1 <- function(data,n,p,i,f) {
np <- n*p;
i <<- floor(np)
f <<- np - i
qvalue <- (1-f)*data[i] + f*data[i+1]
}
q2 <- function(data,n,p,i,f) {
np <- (n+1)*p
i <<- floor(np)
f <<- np - i
qvalue <- (1-f)*data[i] + f*data[i+1]
}
q3 <- function(data,n,p,i,f) {
np <- n*p
i <<- floor(np)
f <<- np - i
if (f==0) {
qvalue <- data[i]
} else {
qvalue <- data[i+1]
}
}
q4 <- function(data,n,p,i,f) {
np <- n*p
i <<- floor(np)
f <<- np - i
if (f==0) {
qvalue <- (data[i]+data[i+1])/2
} else {
qvalue <- data[i+1]
}
}
q5 <- function(data,n,p,i,f) {
np <- (n-1)*p
i <<- floor(np)
f <<- np - i
if (f==0) {
qvalue <- data[i+1]
} else {
qvalue <- data[i+1] + f*(data[i+2]-data[i+1])
}
}
q6 <- function(data,n,p,i,f) {
np <- n*p+0.5
i <<- floor(np)
f <<- np - i
qvalue <- data[i]
}
q7 <- function(data,n,p,i,f) {
np <- (n+1)*p
i <<- floor(np)
f <<- np - i
if (f==0) {
qvalue <- data[i]
} else {
qvalue <- f*data[i] + (1-f)*data[i+1]
}
}
q8 <- function(data,n,p,i,f) {
np <- (n+1)*p
i <<- floor(np)
f <<- np - i
if (f==0) {
qvalue <- data[i]
} else {
if (f == 0.5) {
qvalue <- (data[i]+data[i+1])/2
} else {
if (f < 0.5) {
qvalue <- data[i]
} else {
qvalue <- data[i+1]
}
}
}
}
midmean <- function(x,def) {
x <-sort(x[!is.na(x)])
n<-length(x)
if (def==1) {
qvalue1 <- q1(x,n,0.25,i,f)
qvalue3 <- q1(x,n,0.75,i,f)
}
if (def==2) {
qvalue1 <- q2(x,n,0.25,i,f)
qvalue3 <- q2(x,n,0.75,i,f)
}
if (def==3) {
qvalue1 <- q3(x,n,0.25,i,f)
qvalue3 <- q3(x,n,0.75,i,f)
}
if (def==4) {
qvalue1 <- q4(x,n,0.25,i,f)
qvalue3 <- q4(x,n,0.75,i,f)
}
if (def==5) {
qvalue1 <- q5(x,n,0.25,i,f)
qvalue3 <- q5(x,n,0.75,i,f)
}
if (def==6) {
qvalue1 <- q6(x,n,0.25,i,f)
qvalue3 <- q6(x,n,0.75,i,f)
}
if (def==7) {
qvalue1 <- q7(x,n,0.25,i,f)
qvalue3 <- q7(x,n,0.75,i,f)
}
if (def==8) {
qvalue1 <- q8(x,n,0.25,i,f)
qvalue3 <- q8(x,n,0.75,i,f)
}
midm <- 0
myn <- 0
roundno4 <- round(n/4)
round3no4 <- round(3*n/4)
for (i in 1:n) {
if ((x[i]>=qvalue1) & (x[i]<=qvalue3)){
midm = midm + x[i]
myn = myn + 1
}
}
midm = midm / myn
return(midm)
}
(arm <- mean(x))
sqrtn <- sqrt(length(x))
(armse <- sd(x) / sqrtn)
(armose <- arm / armse)
(geo <- geomean(x))
(har <- harmean(x))
(qua <- quamean(x))
(win <- winmean(x))
(tri <- trimean(x))
(midr <- midrange(x))
midm <- array(NA,dim=8)
for (j in 1:8) midm[j] <- midmean(x,j)
midm
bitmap(file='test1.png')
lb <- win[,1] - 2*win[,2]
ub <- win[,1] + 2*win[,2]
if ((ylimmin == '') | (ylimmax == '')) plot(win[,1],type='b',main=main, xlab='j', pch=19, ylab='Winsorized Mean(j/n)', ylim=c(min(lb),max(ub))) else plot(win[,1],type='l',main=main, xlab='j', pch=19, ylab='Winsorized Mean(j/n)', ylim=c(ylimmin,ylimmax))
lines(ub,lty=3)
lines(lb,lty=3)
grid()
dev.off()
bitmap(file='test2.png')
lb <- tri[,1] - 2*tri[,2]
ub <- tri[,1] + 2*tri[,2]
if ((ylimmin == '') | (ylimmax == '')) plot(tri[,1],type='b',main=main, xlab='j', pch=19, ylab='Trimmed Mean(j/n)', ylim=c(min(lb),max(ub))) else plot(tri[,1],type='l',main=main, xlab='j', pch=19, ylab='Trimmed Mean(j/n)', ylim=c(ylimmin,ylimmax))
lines(ub,lty=3)
lines(lb,lty=3)
grid()
dev.off()
load(file='createtable')
a<-table.start()
a<-table.row.start(a)
a<-table.element(a,'Central Tendency - Ungrouped Data',4,TRUE)
a<-table.row.end(a)
a<-table.row.start(a)
a<-table.element(a,'Measure',header=TRUE)
a<-table.element(a,'Value',header=TRUE)
a<-table.element(a,'S.E.',header=TRUE)
a<-table.element(a,'Value/S.E.',header=TRUE)
a<-table.row.end(a)
a<-table.row.start(a)
a<-table.element(a,hyperlink('arithmetic_mean.htm', 'Arithmetic Mean', 'click to view the definition of the Arithmetic Mean'),header=TRUE)
a<-table.element(a,arm)
a<-table.element(a,hyperlink('arithmetic_mean_standard_error.htm', armse, 'click to view the definition of the Standard Error of the Arithmetic Mean'))
a<-table.element(a,armose)
a<-table.row.end(a)
a<-table.row.start(a)
a<-table.element(a,hyperlink('geometric_mean.htm', 'Geometric Mean', 'click to view the definition of the Geometric Mean'),header=TRUE)
a<-table.element(a,geo)
a<-table.element(a,'')
a<-table.row.end(a)
a<-table.row.start(a)
a<-table.element(a,hyperlink('harmonic_mean.htm', 'Harmonic Mean', 'click to view the definition of the Harmonic Mean'),header=TRUE)
a<-table.element(a,har)
a<-table.element(a,'')
a<-table.row.end(a)
a<-table.row.start(a)
a<-table.element(a,hyperlink('quadratic_mean.htm', 'Quadratic Mean', 'click to view the definition of the Quadratic Mean'),header=TRUE)
a<-table.element(a,qua)
a<-table.element(a,'')
a<-table.row.end(a)
for (j in 1:length(win[,1])) {
a<-table.row.start(a)
mylabel <- paste('Winsorized Mean (',j)
mylabel <- paste(mylabel,'/')
mylabel <- paste(mylabel,length(win[,1]))
mylabel <- paste(mylabel,')')
a<-table.element(a,hyperlink('winsorized_mean.htm', mylabel, 'click to view the definition of the Winsorized Mean'),header=TRUE)
a<-table.element(a,win[j,1])
a<-table.element(a,win[j,2])
a<-table.element(a,win[j,1]/win[j,2])
a<-table.row.end(a)
}
for (j in 1:length(tri[,1])) {
a<-table.row.start(a)
mylabel <- paste('Trimmed Mean (',j)
mylabel <- paste(mylabel,'/')
mylabel <- paste(mylabel,length(tri[,1]))
mylabel <- paste(mylabel,')')
a<-table.element(a,hyperlink('arithmetic_mean.htm', mylabel, 'click to view the definition of the Trimmed Mean'),header=TRUE)
a<-table.element(a,tri[j,1])
a<-table.element(a,tri[j,2])
a<-table.element(a,tri[j,1]/tri[j,2])
a<-table.row.end(a)
}
a<-table.row.start(a)
a<-table.element(a,hyperlink('median_1.htm', 'Median', 'click to view the definition of the Median'),header=TRUE)
a<-table.element(a,median(x))
a<-table.element(a,'')
a<-table.row.end(a)
a<-table.row.start(a)
a<-table.element(a,hyperlink('midrange.htm', 'Midrange', 'click to view the definition of the Midrange'),header=TRUE)
a<-table.element(a,midr)
a<-table.element(a,'')
a<-table.row.end(a)
a<-table.row.start(a)
mymid <- hyperlink('midmean.htm', 'Midmean', 'click to view the definition of the Midmean')
mylabel <- paste(mymid,hyperlink('method_1.htm','Weighted Average at Xnp',''),sep=' - ')
a<-table.element(a,mylabel,header=TRUE)
a<-table.element(a,midm[1])
a<-table.element(a,'')
a<-table.row.end(a)
a<-table.row.start(a)
mymid <- hyperlink('midmean.htm', 'Midmean', 'click to view the definition of the Midmean')
mylabel <- paste(mymid,hyperlink('method_2.htm','Weighted Average at X(n+1)p',''),sep=' - ')
a<-table.element(a,mylabel,header=TRUE)
a<-table.element(a,midm[2])
a<-table.element(a,'')
a<-table.row.end(a)
a<-table.row.start(a)
mymid <- hyperlink('midmean.htm', 'Midmean', 'click to view the definition of the Midmean')
mylabel <- paste(mymid,hyperlink('method_3.htm','Empirical Distribution Function',''),sep=' - ')
a<-table.element(a,mylabel,header=TRUE)
a<-table.element(a,midm[3])
a<-table.element(a,'')
a<-table.row.end(a)
a<-table.row.start(a)
mymid <- hyperlink('midmean.htm', 'Midmean', 'click to view the definition of the Midmean')
mylabel <- paste(mymid,hyperlink('method_4.htm','Empirical Distribution Function - Averaging',''),sep=' - ')
a<-table.element(a,mylabel,header=TRUE)
a<-table.element(a,midm[4])
a<-table.element(a,'')
a<-table.row.end(a)
a<-table.row.start(a)
mymid <- hyperlink('midmean.htm', 'Midmean', 'click to view the definition of the Midmean')
mylabel <- paste(mymid,hyperlink('method_5.htm','Empirical Distribution Function - Interpolation',''),sep=' - ')
a<-table.element(a,mylabel,header=TRUE)
a<-table.element(a,midm[5])
a<-table.element(a,'')
a<-table.row.end(a)
a<-table.row.start(a)
mymid <- hyperlink('midmean.htm', 'Midmean', 'click to view the definition of the Midmean')
mylabel <- paste(mymid,hyperlink('method_6.htm','Closest Observation',''),sep=' - ')
a<-table.element(a,mylabel,header=TRUE)
a<-table.element(a,midm[6])
a<-table.element(a,'')
a<-table.row.end(a)
a<-table.row.start(a)
mymid <- hyperlink('midmean.htm', 'Midmean', 'click to view the definition of the Midmean')
mylabel <- paste(mymid,hyperlink('method_7.htm','True Basic - Statistics Graphics Toolkit',''),sep=' - ')
a<-table.element(a,mylabel,header=TRUE)
a<-table.element(a,midm[7])
a<-table.element(a,'')
a<-table.row.end(a)
a<-table.row.start(a)
mymid <- hyperlink('midmean.htm', 'Midmean', 'click to view the definition of the Midmean')
mylabel <- paste(mymid,hyperlink('method_8.htm','MS Excel (old versions)',''),sep=' - ')
a<-table.element(a,mylabel,header=TRUE)
a<-table.element(a,midm[8])
a<-table.element(a,'')
a<-table.row.end(a)
a<-table.row.start(a)
a<-table.element(a,'Number of observations',header=TRUE)
a<-table.element(a,length(x))
a<-table.element(a,'')
a<-table.row.end(a)
a<-table.end(a)
table.save(a,file='mytable.tab')