| Multiple Linear Regression - Estimated Regression Equation |
| 15thbird[t] = + 153.350106858084 + 0.501760860337412Sunset[t] + 8.115864513067Temp[t] + 2.45122086910853humidity[t] -0.112231299515803`Temp^2`[t] -0.0193099449016803`Hum^2`[t] -2.40327308613827Dew[t] + 8.8544644198632pressure[t] + e[t] |
| Multiple Linear Regression - Ordinary Least Squares | |||||
| Variable | Parameter | S.D. | T-STAT H0: parameter = 0 | 2-tail p-value | 1-tail p-value |
| (Intercept) | 153.350106858084 | 504.816193 | 0.3038 | 0.763718 | 0.381859 |
| Sunset | 0.501760860337412 | 0.208293 | 2.4089 | 0.023382 | 0.011691 |
| Temp | 8.115864513067 | 4.043759 | 2.007 | 0.055251 | 0.027625 |
| humidity | 2.45122086910853 | 1.447612 | 1.6933 | 0.102351 | 0.051175 |
| `Temp^2` | -0.112231299515803 | 0.062643 | -1.7916 | 0.084847 | 0.042423 |
| `Hum^2` | -0.0193099449016803 | 0.00869 | -2.2221 | 0.035187 | 0.017593 |
| Dew | -2.40327308613827 | 2.749252 | -0.8742 | 0.390037 | 0.195018 |
| pressure | 8.8544644198632 | 14.151834 | 0.6257 | 0.536981 | 0.268491 |
| Multiple Linear Regression - Regression Statistics | |
| Multiple R | 0.756266094572594 |
| R-squared | 0.571938405800083 |
| Adjusted R-squared | 0.45669105351549 |
| F-TEST (value) | 4.9627032158425 |
| F-TEST (DF numerator) | 7 |
| F-TEST (DF denominator) | 26 |
| p-value | 0.00114986411782847 |
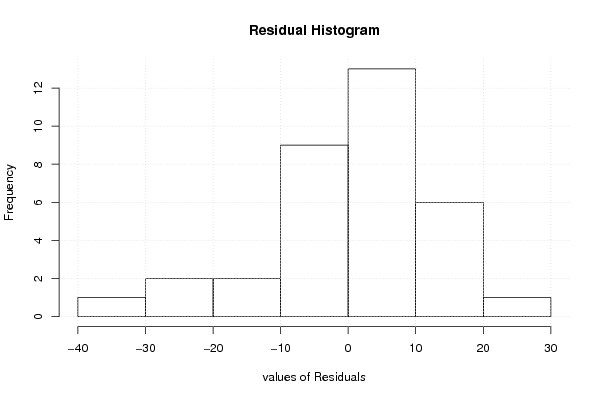
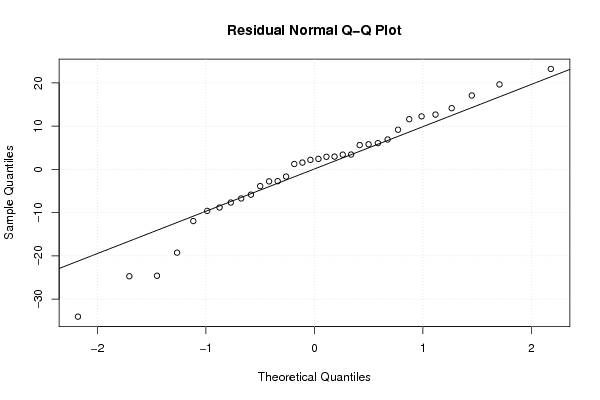
| Multiple Linear Regression - Residual Statistics | |
| Residual Standard Deviation | 14.39145645974 |
| Sum Squared Residuals | 5384.96449484738 |
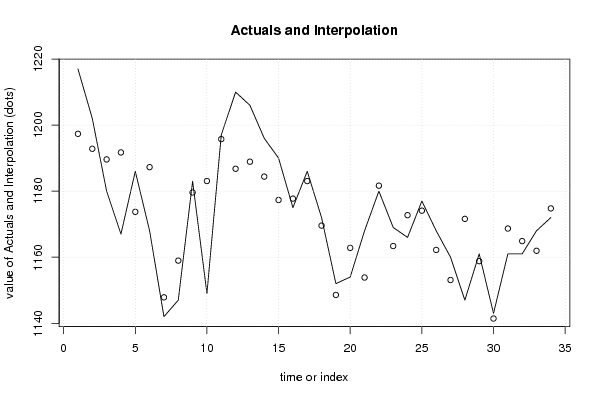
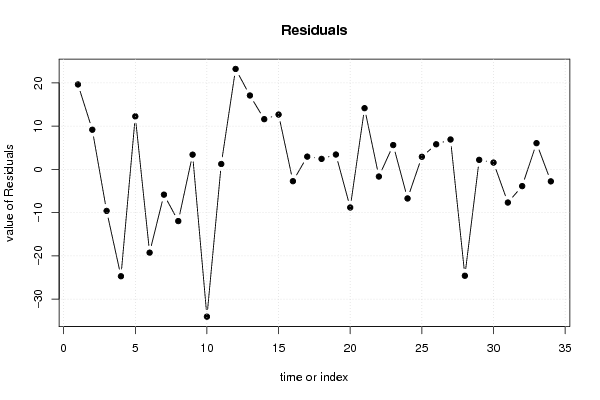
| Multiple Linear Regression - Actuals, Interpolation, and Residuals | |||
| Time or Index | Actuals | Interpolation Forecast | Residuals Prediction Error |
| 1 | 1217 | 1197.35850155975 | 19.6414984402491 |
| 2 | 1202 | 1192.82884014717 | 9.17115985282978 |
| 3 | 1180 | 1189.60344318548 | -9.60344318548426 |
| 4 | 1167 | 1191.72087591633 | -24.7208759163285 |
| 5 | 1186 | 1173.73721877267 | 12.2627812273268 |
| 6 | 1168 | 1187.2649102867 | -19.2649102866985 |
| 7 | 1142 | 1147.8481052525 | -5.84810525250457 |
| 8 | 1147 | 1158.96288777376 | -11.9628877737632 |
| 9 | 1183 | 1179.595972088 | 3.40402791200273 |
| 10 | 1149 | 1183.06536176382 | -34.0653617638166 |
| 11 | 1197 | 1195.75732201055 | 1.24267798944771 |
| 12 | 1210 | 1186.77472254855 | 23.2252774514458 |
| 13 | 1206 | 1188.91099190871 | 17.0890080912908 |
| 14 | 1196 | 1184.39522503832 | 11.6047749616755 |
| 15 | 1190 | 1177.32323868007 | 12.6767613199267 |
| 16 | 1175 | 1177.73507881088 | -2.7350788108751 |
| 17 | 1186 | 1183.05283597595 | 2.94716402404726 |
| 18 | 1172 | 1169.572853811 | 2.42714618900421 |
| 19 | 1152 | 1148.57050362574 | 3.42949637425899 |
| 20 | 1154 | 1162.82155559804 | -8.82155559803731 |
| 21 | 1168 | 1153.84778130592 | 14.1522186940772 |
| 22 | 1180 | 1181.65909167742 | -1.65909167741848 |
| 23 | 1169 | 1163.37863182184 | 5.62136817815581 |
| 24 | 1166 | 1172.72977516277 | -6.72977516276779 |
| 25 | 1177 | 1174.08673795353 | 2.9132620464677 |
| 26 | 1168 | 1162.19840912638 | 5.80159087361563 |
| 27 | 1160 | 1153.09584828383 | 6.90415171617403 |
| 28 | 1147 | 1171.60631079035 | -24.6063107903478 |
| 29 | 1161 | 1158.80192514894 | 2.19807485105878 |
| 30 | 1143 | 1141.4297913269 | 1.57020867310287 |
| 31 | 1161 | 1168.67313710903 | -7.67313710903395 |
| 32 | 1161 | 1164.87584103699 | -3.87584103699233 |
| 33 | 1168 | 1161.93898865352 | 6.06101134648204 |
| 34 | 1172 | 1174.77728584857 | -2.77728584857108 |
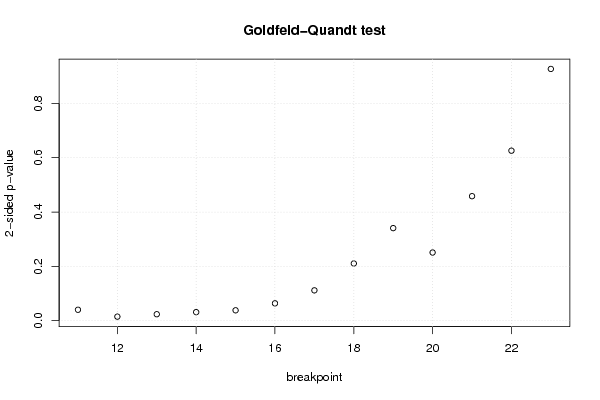
| Goldfeld-Quandt test for Heteroskedasticity | |||
| p-values | Alternative Hypothesis | ||
| breakpoint index | greater | 2-sided | less |
| 11 | 0.980096460382175 | 0.0398070792356502 | 0.0199035396178251 |
| 12 | 0.9927837784838 | 0.0144324430324027 | 0.00721622151620134 |
| 13 | 0.988293605254859 | 0.0234127894902826 | 0.0117063947451413 |
| 14 | 0.98449891494034 | 0.0310021701193215 | 0.0155010850596607 |
| 15 | 0.981103950083664 | 0.0377920998326712 | 0.0188960499163356 |
| 16 | 0.968256363294507 | 0.0634872734109861 | 0.031743636705493 |
| 17 | 0.94432133279376 | 0.111357334412479 | 0.0556786672062394 |
| 18 | 0.894848243862343 | 0.210303512275313 | 0.105151756137657 |
| 19 | 0.829685742269927 | 0.340628515460146 | 0.170314257730073 |
| 20 | 0.874647452423392 | 0.250705095153217 | 0.125352547576608 |
| 21 | 0.770826481873177 | 0.458347036253646 | 0.229173518126823 |
| 22 | 0.687040809291157 | 0.625918381417687 | 0.312959190708843 |
| 23 | 0.536462771338016 | 0.927074457323967 | 0.463537228661984 |
| Meta Analysis of Goldfeld-Quandt test for Heteroskedasticity | |||
| Description | # significant tests | % significant tests | OK/NOK |
| 1% type I error level | 0 | 0 | OK |
| 5% type I error level | 5 | 0.384615384615385 | NOK |
| 10% type I error level | 6 | 0.461538461538462 | NOK |