| Multiple Linear Regression - Estimated Regression Equation |
| 15thbird[t] = + 548.77411711376 + 0.457919900566662Sunset[t] + 5.5127280172675Temp[t] + 1.09183657659764humidity[t] -0.102083596676507`Temp^2`[t] -0.013112777176766`Hum^2`[t] + e[t] |
| Multiple Linear Regression - Ordinary Least Squares | |||||
| Variable | Parameter | S.D. | T-STAT H0: parameter = 0 | 2-tail p-value | 1-tail p-value |
| (Intercept) | 548.77411711376 | 240.427948 | 2.2825 | 0.030258 | 0.015129 |
| Sunset | 0.457919900566662 | 0.204089 | 2.2437 | 0.032941 | 0.016471 |
| Temp | 5.5127280172675 | 2.802577 | 1.967 | 0.059161 | 0.029581 |
| humidity | 1.09183657659764 | 0.87557 | 1.247 | 0.222728 | 0.111364 |
| `Temp^2` | -0.102083596676507 | 0.060835 | -1.678 | 0.104469 | 0.052234 |
| `Hum^2` | -0.013112777176766 | 0.007202 | -1.8208 | 0.079337 | 0.039669 |
| Multiple Linear Regression - Regression Statistics | |
| Multiple R | 0.737883439021702 |
| R-squared | 0.544471969582493 |
| Adjusted R-squared | 0.46312767843651 |
| F-TEST (value) | 6.69342570833109 |
| F-TEST (DF numerator) | 5 |
| F-TEST (DF denominator) | 28 |
| p-value | 0.00032362923653384 |
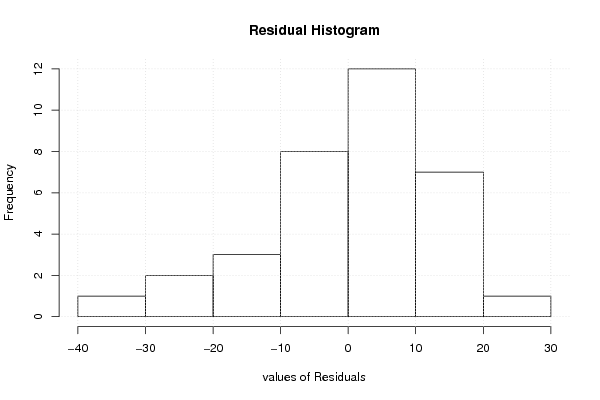
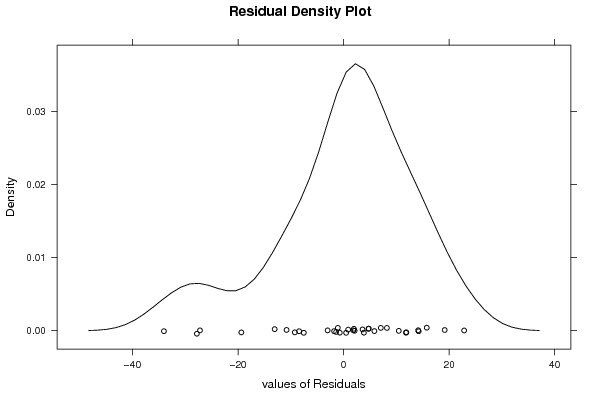
| Multiple Linear Regression - Residual Statistics | |
| Residual Standard Deviation | 14.3059540940118 |
| Sum Squared Residuals | 5730.48903111925 |
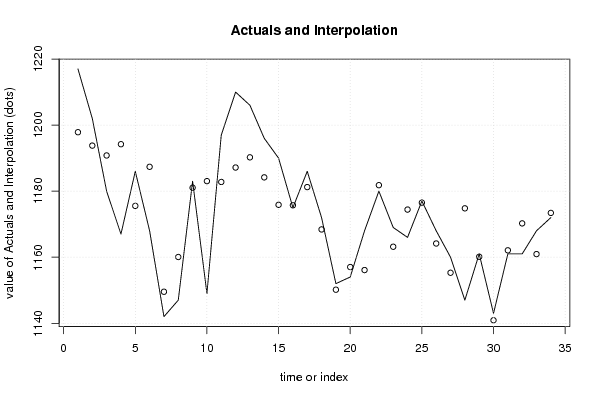
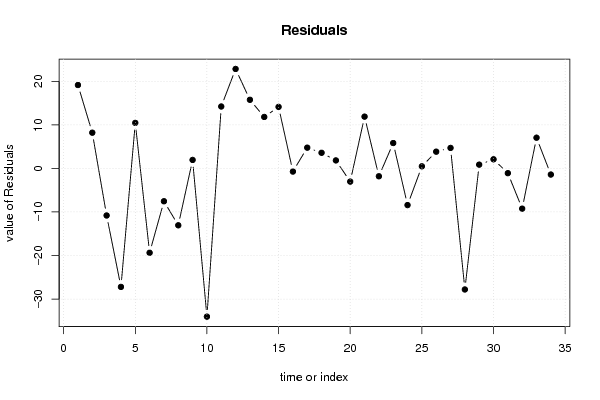
| Multiple Linear Regression - Actuals, Interpolation, and Residuals | |||
| Time or Index | Actuals | Interpolation Forecast | Residuals Prediction Error |
| 1 | 1217 | 1197.84574599001 | 19.1542540099918 |
| 2 | 1202 | 1193.79041539721 | 8.2095846027948 |
| 3 | 1180 | 1190.80644880763 | -10.8064488076261 |
| 4 | 1167 | 1194.21369657649 | -27.2136965764929 |
| 5 | 1186 | 1175.54190804629 | 10.458091953708 |
| 6 | 1168 | 1187.37217838909 | -19.3721783890906 |
| 7 | 1142 | 1149.54093332618 | -7.54093332617526 |
| 8 | 1147 | 1160.06039551703 | -13.0603955170338 |
| 9 | 1183 | 1181.04710601054 | 1.95289398945705 |
| 10 | 1149 | 1183.0428321893 | -34.0428321893003 |
| 11 | 1197 | 1182.778312503 | 14.2216874969967 |
| 12 | 1210 | 1187.15383067973 | 22.8461693202749 |
| 13 | 1206 | 1190.2394726663 | 15.7605273336952 |
| 14 | 1196 | 1184.17880155128 | 11.8211984487237 |
| 15 | 1190 | 1175.86442607753 | 14.1355739224681 |
| 16 | 1175 | 1175.71924552061 | -0.719245520613063 |
| 17 | 1186 | 1181.23303365597 | 4.76696634402964 |
| 18 | 1172 | 1168.40581327914 | 3.59418672086332 |
| 19 | 1152 | 1150.15714307224 | 1.84285692776279 |
| 20 | 1154 | 1157.02432777748 | -3.02432777747701 |
| 21 | 1168 | 1156.10807369116 | 11.8919263088425 |
| 22 | 1180 | 1181.80325649358 | -1.80325649358442 |
| 23 | 1169 | 1163.16654323093 | 5.83345676907427 |
| 24 | 1166 | 1174.42147027175 | -8.42147027175305 |
| 25 | 1177 | 1176.52080000767 | 0.479199992326284 |
| 26 | 1168 | 1164.15258198559 | 3.84741801440634 |
| 27 | 1160 | 1155.291523634 | 4.70847636600119 |
| 28 | 1147 | 1174.80080402389 | -27.8008040238912 |
| 29 | 1161 | 1160.13058361498 | 0.869416385015417 |
| 30 | 1143 | 1140.90593608369 | 2.09406391631086 |
| 31 | 1161 | 1162.08812069216 | -1.08812069216002 |
| 32 | 1161 | 1170.24096187886 | -9.24096187886238 |
| 33 | 1168 | 1160.94605714418 | 7.05394285582015 |
| 34 | 1172 | 1173.4072202145 | -1.40722021450305 |
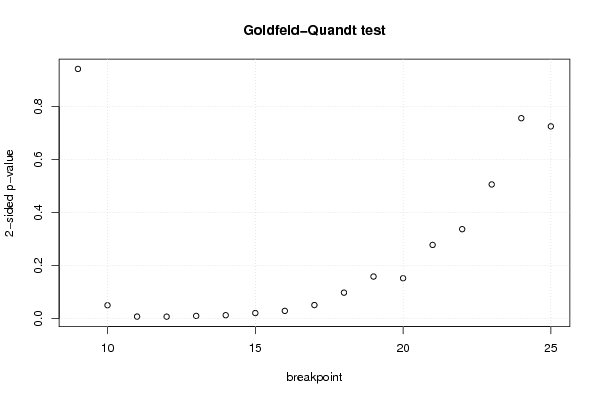
| Goldfeld-Quandt test for Heteroskedasticity | |||
| p-values | Alternative Hypothesis | ||
| breakpoint index | greater | 2-sided | less |
| 9 | 0.528964221757403 | 0.942071556485195 | 0.471035778242597 |
| 10 | 0.974589641767614 | 0.0508207164647723 | 0.0254103582323862 |
| 11 | 0.995929164317119 | 0.00814167136576186 | 0.00407083568288093 |
| 12 | 0.996067764943444 | 0.00786447011311206 | 0.00393223505655603 |
| 13 | 0.994683714983558 | 0.0106325700328832 | 0.00531628501644162 |
| 14 | 0.99334556766119 | 0.0133088646776198 | 0.0066544323388099 |
| 15 | 0.989233688063174 | 0.0215326238736529 | 0.0107663119368264 |
| 16 | 0.985190672154118 | 0.0296186556917635 | 0.0148093278458818 |
| 17 | 0.974252028333812 | 0.0514959433323753 | 0.0257479716661877 |
| 18 | 0.950811168766909 | 0.0983776624661815 | 0.0491888312330908 |
| 19 | 0.920455698218556 | 0.159088603562888 | 0.0795443017814438 |
| 20 | 0.923610747070469 | 0.152778505859063 | 0.0763892529295315 |
| 21 | 0.860763200700414 | 0.278473598599173 | 0.139236799299586 |
| 22 | 0.831113030035072 | 0.337773939929855 | 0.168886969964928 |
| 23 | 0.746755032473676 | 0.506489935052647 | 0.253244967526324 |
| 24 | 0.621823174558418 | 0.756353650883164 | 0.378176825441582 |
| 25 | 0.637208068541588 | 0.725583862916824 | 0.362791931458412 |
| Meta Analysis of Goldfeld-Quandt test for Heteroskedasticity | |||
| Description | # significant tests | % significant tests | OK/NOK |
| 1% type I error level | 2 | 0.117647058823529 | NOK |
| 5% type I error level | 6 | 0.352941176470588 | NOK |
| 10% type I error level | 9 | 0.529411764705882 | NOK |