| Multiple Linear Regression - Estimated Regression Equation |
| 15thbird[t] = + 421.479802505081 + 0.496443514709184Sunset[t] + 8.64553618385391Temp[t] -2.94716695375738Dewpoint[t] + 2.38431188861549humidity[t] -0.115775601570986`Temp^2`[t] -0.0179091849904993`Hum^2`[t] + e[t] |
| Multiple Linear Regression - Ordinary Least Squares | |||||
| Variable | Parameter | S.D. | T-STAT H0: parameter = 0 | 2-tail p-value | 1-tail p-value |
| (Intercept) | 421.479802505081 | 263.78974 | 1.5978 | 0.121729 | 0.060865 |
| Sunset | 0.496443514709184 | 0.205761 | 2.4127 | 0.022897 | 0.011448 |
| Temp | 8.64553618385391 | 3.909339 | 2.2115 | 0.035652 | 0.017826 |
| Dewpoint | -2.94716695375738 | 2.578644 | -1.1429 | 0.263108 | 0.131554 |
| humidity | 2.38431188861549 | 1.427296 | 1.6705 | 0.106372 | 0.053186 |
| `Temp^2` | -0.115775601570986 | 0.06168 | -1.877 | 0.071357 | 0.035679 |
| `Hum^2` | -0.0179091849904993 | 0.008301 | -2.1574 | 0.040039 | 0.02002 |
| Multiple Linear Regression - Regression Statistics | |
| Multiple R | 0.751992865484892 |
| R-squared | 0.565493269740178 |
| Adjusted R-squared | 0.468936218571329 |
| F-TEST (value) | 5.85657145588778 |
| F-TEST (DF numerator) | 6 |
| F-TEST (DF denominator) | 27 |
| p-value | 0.000517944876300303 |
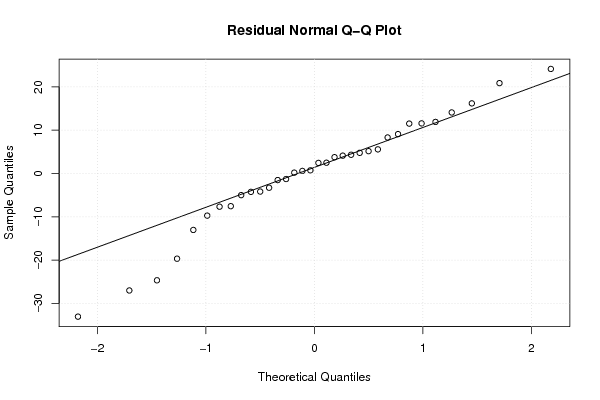
| Multiple Linear Regression - Residual Statistics | |
| Residual Standard Deviation | 14.2283539927091 |
| Sum Squared Residuals | 5466.04354822972 |
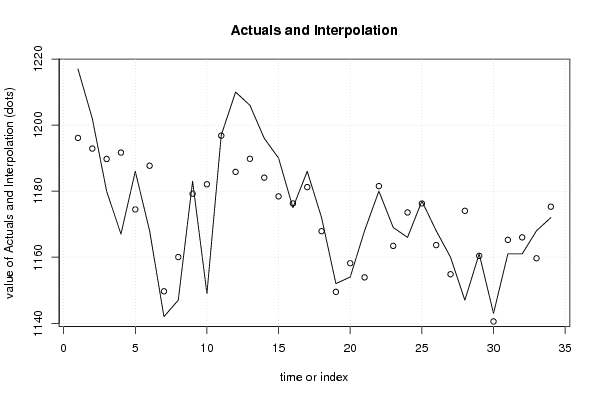
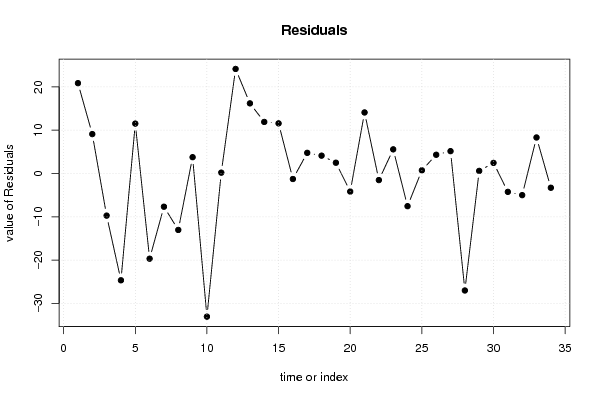
| Multiple Linear Regression - Actuals, Interpolation, and Residuals | |||
| Time or Index | Actuals | Interpolation Forecast | Residuals Prediction Error |
| 1 | 1217 | 1196.11576020699 | 20.8842397930099 |
| 2 | 1202 | 1192.89207402536 | 9.1079259746357 |
| 3 | 1180 | 1189.73925669803 | -9.73925669802537 |
| 4 | 1167 | 1191.68081406867 | -24.6808140686664 |
| 5 | 1186 | 1174.4691321419 | 11.5308678580973 |
| 6 | 1168 | 1187.69385457497 | -19.6938545749663 |
| 7 | 1142 | 1149.67603356942 | -7.67603356941692 |
| 8 | 1147 | 1160.04602135012 | -13.0460213501154 |
| 9 | 1183 | 1179.23332598532 | 3.76667401467858 |
| 10 | 1149 | 1182.0875012562 | -33.0875012562041 |
| 11 | 1197 | 1196.80289158313 | 0.197108416872642 |
| 12 | 1210 | 1185.83631345658 | 24.1636865434237 |
| 13 | 1206 | 1189.79007352483 | 16.2099264751651 |
| 14 | 1196 | 1184.08145859308 | 11.9185414069215 |
| 15 | 1190 | 1178.41243528518 | 11.5875647148206 |
| 16 | 1175 | 1176.27550075123 | -1.27550075122509 |
| 17 | 1186 | 1181.22330255455 | 4.77669744545002 |
| 18 | 1172 | 1167.87838611517 | 4.12161388482779 |
| 19 | 1152 | 1149.51257181448 | 2.48742818551605 |
| 20 | 1154 | 1158.17535822693 | -4.1753582269328 |
| 21 | 1168 | 1153.89612945805 | 14.1038705419459 |
| 22 | 1180 | 1181.52208449379 | -1.52208449378772 |
| 23 | 1169 | 1163.42162955787 | 5.57837044213443 |
| 24 | 1166 | 1173.55451423993 | -7.55451423992856 |
| 25 | 1177 | 1176.27062137496 | 0.729378625042664 |
| 26 | 1168 | 1163.66973340416 | 4.33026659583634 |
| 27 | 1160 | 1154.83768331795 | 5.162316682051 |
| 28 | 1147 | 1174.0380386904 | -27.0380386903969 |
| 29 | 1161 | 1160.40031722359 | 0.599682776414139 |
| 30 | 1143 | 1140.54853981938 | 2.45146018062296 |
| 31 | 1161 | 1165.24447407681 | -4.244474076806 |
| 32 | 1161 | 1166.00415904127 | -5.00415904127105 |
| 33 | 1168 | 1159.67584669832 | 8.32415330167998 |
| 34 | 1172 | 1175.2941628214 | -3.29416282140373 |
| Goldfeld-Quandt test for Heteroskedasticity | |||
| p-values | Alternative Hypothesis | ||
| breakpoint index | greater | 2-sided | less |
| 10 | 0.881281126974023 | 0.237437746051955 | 0.118718873025977 |
| 11 | 0.975815177296495 | 0.0483696454070097 | 0.0241848227035049 |
| 12 | 0.991096834454874 | 0.0178063310902511 | 0.00890316554512557 |
| 13 | 0.990774888013364 | 0.0184502239732729 | 0.00922511198663643 |
| 14 | 0.989336109333945 | 0.0213277813321103 | 0.0106638906660551 |
| 15 | 0.983281857734567 | 0.0334362845308665 | 0.0167181422654332 |
| 16 | 0.979290529164562 | 0.0414189416708749 | 0.0207094708354374 |
| 17 | 0.963393475786014 | 0.0732130484279712 | 0.0366065242139856 |
| 18 | 0.931481728002504 | 0.137036543994993 | 0.0685182719974963 |
| 19 | 0.887349384874944 | 0.225301230250113 | 0.112650615125056 |
| 20 | 0.899506554932162 | 0.200986890135676 | 0.100493445067838 |
| 21 | 0.81743127170226 | 0.365137456595479 | 0.18256872829774 |
| 22 | 0.776347804053658 | 0.447304391892684 | 0.223652195946342 |
| 23 | 0.667559622724874 | 0.664880754550252 | 0.332440377275126 |
| 24 | 0.505138409406678 | 0.989723181186644 | 0.494861590593322 |
| Meta Analysis of Goldfeld-Quandt test for Heteroskedasticity | |||
| Description | # significant tests | % significant tests | OK/NOK |
| 1% type I error level | 0 | 0 | OK |
| 5% type I error level | 6 | 0.4 | NOK |
| 10% type I error level | 7 | 0.466666666666667 | NOK |