| Multiple Linear Regression - Estimated Regression Equation |
| 15thbird[t] = + 506.291897711508 + 0.470803163152721Sunset[t] + 5.64749484027154Temp[t] -2.27868079550599Dewpoint[t] + 1.57983529885717humidity[t] -0.0861605040332182`Temp^2`[t] -0.0161366503312908`Hum^2`[t] + 0.0222456963055937TempxHum[t] + e[t] |
| Multiple Linear Regression - Ordinary Least Squares | |||||
| Variable | Parameter | S.D. | T-STAT H0: parameter = 0 | 2-tail p-value | 1-tail p-value |
| (Intercept) | 506.291897711508 | 318.121895 | 1.5915 | 0.123583 | 0.061792 |
| Sunset | 0.470803163152721 | 0.215093 | 2.1888 | 0.037784 | 0.018892 |
| Temp | 5.64749484027154 | 7.261018 | 0.7778 | 0.443717 | 0.221859 |
| Dewpoint | -2.27868079550599 | 2.946304 | -0.7734 | 0.446259 | 0.223129 |
| humidity | 1.57983529885717 | 2.181732 | 0.7241 | 0.475458 | 0.237729 |
| `Temp^2` | -0.0861605040332182 | 0.086743 | -0.9933 | 0.329727 | 0.164863 |
| `Hum^2` | -0.0161366503312908 | 0.009156 | -1.7624 | 0.089757 | 0.044879 |
| TempxHum | 0.0222456963055937 | 0.045134 | 0.4929 | 0.626231 | 0.313116 |
| Multiple Linear Regression - Regression Statistics | |
| Multiple R | 0.754662553562466 |
| R-squared | 0.569515569749421 |
| Adjusted R-squared | 0.453615915451189 |
| F-TEST (value) | 4.91386771770643 |
| F-TEST (DF numerator) | 7 |
| F-TEST (DF denominator) | 26 |
| p-value | 0.00122598493352921 |
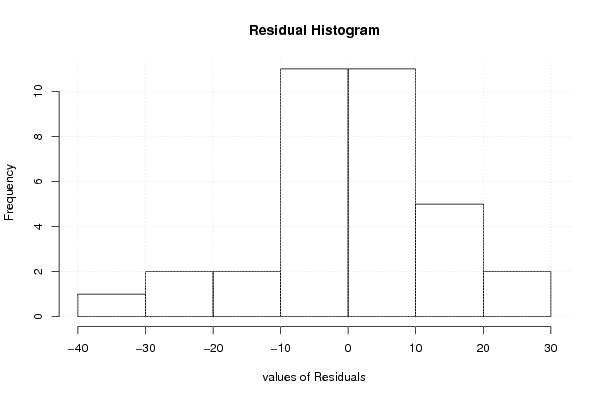
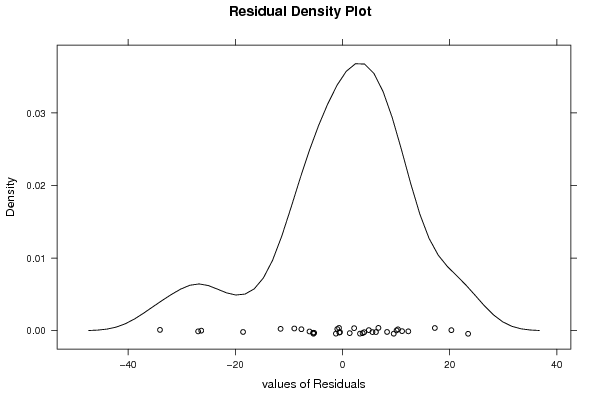
| Multiple Linear Regression - Residual Statistics | |
| Residual Standard Deviation | 14.4321269386756 |
| Sum Squared Residuals | 5415.44348732521 |
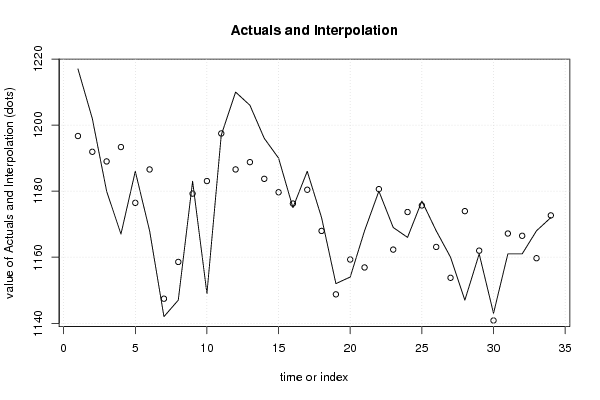
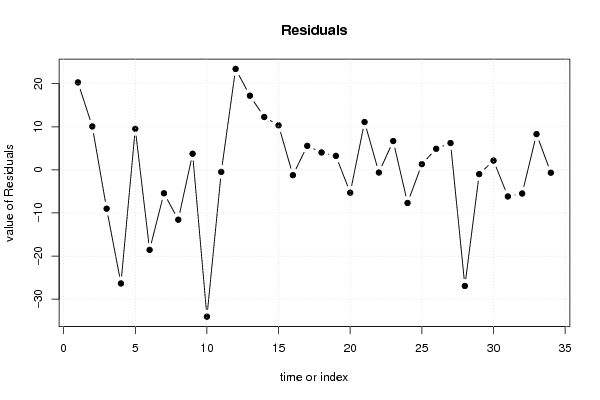
| Multiple Linear Regression - Actuals, Interpolation, and Residuals | |||
| Time or Index | Actuals | Interpolation Forecast | Residuals Prediction Error |
| 1 | 1217 | 1196.69573376876 | 20.3042662312442 |
| 2 | 1202 | 1191.91998434684 | 10.080015653159 |
| 3 | 1180 | 1189.00355145181 | -9.0035514518131 |
| 4 | 1167 | 1193.35947843345 | -26.3594784334526 |
| 5 | 1186 | 1176.45464300238 | 9.54535699762322 |
| 6 | 1168 | 1186.56666902866 | -18.5666690286618 |
| 7 | 1142 | 1147.42991579504 | -5.42991579503846 |
| 8 | 1147 | 1158.56586257362 | -11.5658625736162 |
| 9 | 1183 | 1179.25456293878 | 3.74543706122193 |
| 10 | 1149 | 1183.06717951893 | -34.0671795189286 |
| 11 | 1197 | 1197.46788583754 | -0.467885837536135 |
| 12 | 1210 | 1186.57337786076 | 23.4266221392438 |
| 13 | 1206 | 1188.78215714902 | 17.217842850983 |
| 14 | 1196 | 1183.72977152285 | 12.2702284771478 |
| 15 | 1190 | 1179.66386385134 | 10.3361361486633 |
| 16 | 1175 | 1176.24149828463 | -1.24149828462561 |
| 17 | 1186 | 1180.4220896972 | 5.57791030279946 |
| 18 | 1172 | 1167.95838806135 | 4.04161193864511 |
| 19 | 1152 | 1148.75151217282 | 3.2484878271796 |
| 20 | 1154 | 1159.29858760769 | -5.29858760769478 |
| 21 | 1168 | 1156.89353013121 | 11.1064698687898 |
| 22 | 1180 | 1180.61035015294 | -0.610350152941942 |
| 23 | 1169 | 1162.30413633348 | 6.69586366652206 |
| 24 | 1166 | 1173.68023707579 | -7.68023707579206 |
| 25 | 1177 | 1175.66631466616 | 1.33368533383853 |
| 26 | 1168 | 1163.1011377134 | 4.89886228659996 |
| 27 | 1160 | 1153.76708750085 | 6.23291249914647 |
| 28 | 1147 | 1173.94720833481 | -26.9472083348132 |
| 29 | 1161 | 1161.97748622398 | -0.977486223979777 |
| 30 | 1143 | 1140.83806240339 | 2.16193759661385 |
| 31 | 1161 | 1167.16947863638 | -6.16947863637691 |
| 32 | 1161 | 1166.4837928673 | -5.48379286729692 |
| 33 | 1168 | 1159.69443008343 | 8.3055699165731 |
| 34 | 1172 | 1172.66003497343 | -0.660034973426017 |
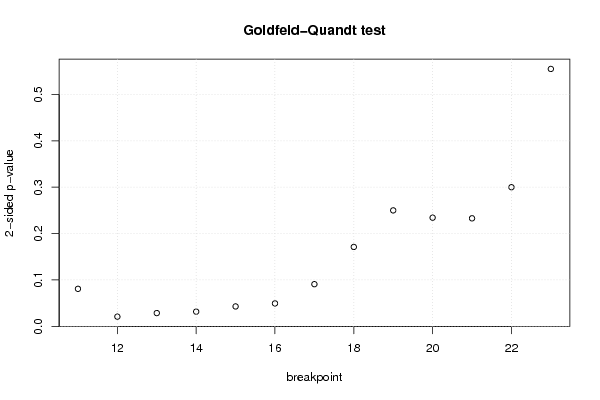
| Goldfeld-Quandt test for Heteroskedasticity | |||
| p-values | Alternative Hypothesis | ||
| breakpoint index | greater | 2-sided | less |
| 11 | 0.959556230199716 | 0.0808875396005678 | 0.0404437698002839 |
| 12 | 0.989541510791482 | 0.0209169784170364 | 0.0104584892085182 |
| 13 | 0.985679290210865 | 0.0286414195782697 | 0.0143207097891348 |
| 14 | 0.984160182117592 | 0.0316796357648157 | 0.0158398178824079 |
| 15 | 0.978539398787878 | 0.0429212024242431 | 0.0214606012121215 |
| 16 | 0.975286967761555 | 0.0494260644768899 | 0.024713032238445 |
| 17 | 0.954537462669522 | 0.0909250746609566 | 0.0454625373304783 |
| 18 | 0.914401893935546 | 0.171196212128908 | 0.085598106064454 |
| 19 | 0.874977875534198 | 0.250044248931605 | 0.125022124465802 |
| 20 | 0.882848265946707 | 0.234303468106587 | 0.117151734053293 |
| 21 | 0.883518585649649 | 0.232962828700702 | 0.116481414350351 |
| 22 | 0.849999221497112 | 0.300001557005775 | 0.150000778502888 |
| 23 | 0.722498644503966 | 0.555002710992068 | 0.277501355496034 |
| Meta Analysis of Goldfeld-Quandt test for Heteroskedasticity | |||
| Description | # significant tests | % significant tests | OK/NOK |
| 1% type I error level | 0 | 0 | OK |
| 5% type I error level | 5 | 0.384615384615385 | NOK |
| 10% type I error level | 7 | 0.538461538461538 | NOK |