Free Statistics

of Irreproducible Research!

Author's title

Author*Unverified author*
R Software Modulerwasp_centraltendency.wasp
Title produced by softwareCentral Tendency
Date of computationMon, 05 Mar 2012 04:42:24 -0500
Cite this page as followsStatistical Computations at FreeStatistics.org, Office for Research Development and Education, URL https://freestatistics.org/blog/index.php?v=date/2012/Mar/05/t13309406455lxua2jjmq2jjnd.htm/, Retrieved Thu, 02 May 2024 21:47:15 +0000
Statistical Computations at FreeStatistics.org, Office for Research Development and Education, URL https://freestatistics.org/blog/index.php?pk=163469, Retrieved Thu, 02 May 2024 21:47:15 +0000
QR Codes:

Original text written by user:
IsPrivate?No (this computation is public)
User-defined keywordsKDG2011W52a
Estimated Impact142
Family? (F = Feedback message, R = changed R code, M = changed R Module, P = changed Parameters, D = changed Data)
-       [Central Tendency] [VerdesseldonckIanB] [2012-03-05 09:42:24] [f846b3a26bb0d084da7285efcbdb2f3f] [Current]
Feedback Forum

Post a new message
Dataseries X:
105,32
106,93
107,99
109,41
111,79
112,7
113,41
115,14
115,6
116,21
116,9
117,31
117,62
118,66
120
120,41
120,8
120,93
121,54
122,04
122,5
123,01
123,79
123,99
124,58
125,77
127,6
130,97
131,79
132,29
132,29
132,65
133,88
134,79
135,9
136,33
136,33
137,91
138,92
140,12
141,92
142,57
143,69
144,61
145,02
146,07
146,77
147,55
148,14
148,62
151,16
152,56
154,55
156,17
158,8
159,39
162,44
166,48
168,3
170,32
170,64
172,85
174,38
177,2
178,96
179,62
180,27
183,38
190,81
193,72
196,86
197,73


Summary of computational transaction
Raw Inputview raw input (R code)
Raw Outputview raw output of R engine
Computing time1 seconds
R Server'Herman Ole Andreas Wold' @ wold.wessa.net

\begin{tabular}{lllllllll}
\hline
Summary of computational transaction \tabularnewline
Raw Input & view raw input (R code)  \tabularnewline
Raw Output & view raw output of R engine  \tabularnewline
Computing time & 1 seconds \tabularnewline
R Server & 'Herman Ole Andreas Wold' @ wold.wessa.net \tabularnewline
\hline
\end{tabular}
%Source: https://freestatistics.org/blog/index.php?pk=163469&T=0

[TABLE]
[ROW][C]Summary of computational transaction[/C][/ROW]
[ROW][C]Raw Input[/C][C]view raw input (R code) [/C][/ROW]
[ROW][C]Raw Output[/C][C]view raw output of R engine [/C][/ROW]
[ROW][C]Computing time[/C][C]1 seconds[/C][/ROW]
[ROW][C]R Server[/C][C]'Herman Ole Andreas Wold' @ wold.wessa.net[/C][/ROW]
[/TABLE]
Source: https://freestatistics.org/blog/index.php?pk=163469&T=0

Globally Unique Identifier (entire table): ba.freestatistics.org/blog/index.php?pk=163469&T=0

As an alternative you can also use a QR Code:  

The GUIDs for individual cells are displayed in the table below:

Summary of computational transaction
Raw Inputview raw input (R code)
Raw Outputview raw output of R engine
Computing time1 seconds
R Server'Herman Ole Andreas Wold' @ wold.wessa.net


Central Tendency - Ungrouped Data
MeasureValueS.E.Value/S.E.
Arithmetic Mean141.4954166666672.8806348056138249.1195261512908
Geometric Mean139.511449825463
Harmonic Mean137.633103977451
Quadratic Mean143.562233809553
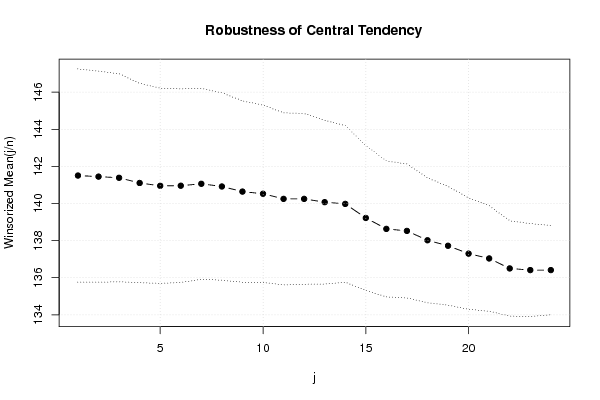
Winsorized Mean ( 1 / 24 )141.5056944444442.8734618653810749.2457186048921
Winsorized Mean ( 2 / 24 )141.4479166666672.8454088911996749.7109280511982
Winsorized Mean ( 3 / 24 )141.3858333333332.8050226773176150.404524168959
Winsorized Mean ( 4 / 24 )141.1052777777782.6871721801899552.5106946320811
Winsorized Mean ( 5 / 24 )140.95252.6308673658387653.5764371211706
Winsorized Mean ( 6 / 24 )140.95752.610645765437753.9933459629545
Winsorized Mean ( 7 / 24 )141.0615277777782.5728610900250854.8267173555036
Winsorized Mean ( 8 / 24 )140.9170833333332.5255515708437655.7965574570526
Winsorized Mean ( 9 / 24 )140.6408333333332.4448597969697257.5251118725297
Winsorized Mean ( 10 / 24 )140.5241666666672.3905536396061358.7831054440676
Winsorized Mean ( 11 / 24 )140.2491666666672.3184950037795860.4914681455144
Winsorized Mean ( 12 / 24 )140.24752.3014868616302560.9377799796156
Winsorized Mean ( 13 / 24 )140.0705555555562.2092710639825563.4012538520542
Winsorized Mean ( 14 / 24 )139.9772222222222.11096881264166.309469559192
Winsorized Mean ( 15 / 24 )139.2209722222221.9545076022173271.23071410123
Winsorized Mean ( 16 / 24 )138.6298611111111.8318137587738475.6790151002607
Winsorized Mean ( 17 / 24 )138.521251.8054661930907476.7232588071162
Winsorized Mean ( 18 / 24 )138.016251.6824471524753682.0330372915063
Winsorized Mean ( 19 / 24 )137.7206944444441.6000723199421286.071543597121
Winsorized Mean ( 20 / 24 )137.2956944444441.5018373310031191.4184856177075
Winsorized Mean ( 21 / 24 )137.0361111111111.4234166801079596.2726607227329
Winsorized Mean ( 22 / 24 )136.4983333333331.28432034783715106.280597020208
Winsorized Mean ( 23 / 24 )136.4088888888891.25513152574978108.680951828855
Winsorized Mean ( 24 / 24 )136.4088888888891.20201287810803113.483716666661
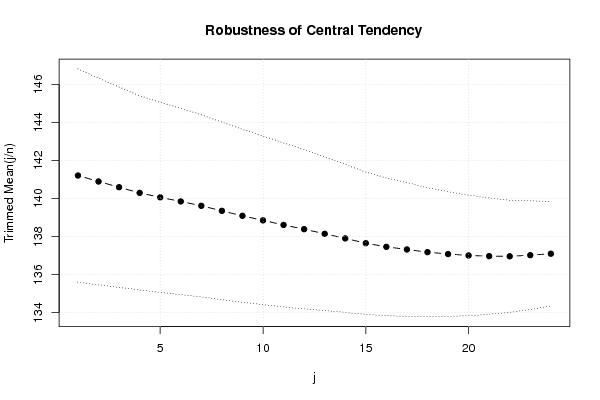
Trimmed Mean ( 1 / 24 )141.2088571428572.8027984207362950.3813817283947
Trimmed Mean ( 2 / 24 )140.8945588235292.7182649887996251.8325326647967
Trimmed Mean ( 3 / 24 )140.5927272727272.6349308766511953.3572734368693
Trimmed Mean ( 4 / 24 )140.29531252.5532558965080454.9476112801208
Trimmed Mean ( 5 / 24 )140.0601612903232.4986936247469256.0533552025645
Trimmed Mean ( 6 / 24 )139.8462.449757363749157.0856534893644
Trimmed Mean ( 7 / 24 )139.6160344827592.3948384825517858.2987268243632
Trimmed Mean ( 8 / 24 )139.3505357142862.3361758131285759.6489934238595
Trimmed Mean ( 9 / 24 )139.0894444444442.2747527094949861.1448637312861
Trimmed Mean ( 10 / 24 )138.8507692307692.2172336936708962.6234255897877
Trimmed Mean ( 11 / 24 )138.60982.1568000577196764.2664114848682
Trimmed Mean ( 12 / 24 )138.386252.0963983515342766.0114285525557
Trimmed Mean ( 13 / 24 )138.143478260872.0217596778343968.3283378214575
Trimmed Mean ( 14 / 24 )137.9009090909091.9466374167692270.8405725190361
Trimmed Mean ( 15 / 24 )137.6466666666671.8712349318951373.5592652320051
Trimmed Mean ( 16 / 24 )137.457751.8110023604842475.9014747850718
Trimmed Mean ( 17 / 24 )137.3189473684211.7603871288591278.004971245964
Trimmed Mean ( 18 / 24 )137.17751.6964922435837180.8594914116573
Trimmed Mean ( 19 / 24 )137.0788235294121.6408365852793183.5420326187313
Trimmed Mean ( 20 / 24 )137.00281251.5840744877488986.4876074702102
Trimmed Mean ( 21 / 24 )136.9676666666671.5300901245586989.5160778233053
Trimmed Mean ( 22 / 24 )136.9592857142861.4731199055867292.9722592131677
Trimmed Mean ( 23 / 24 )137.0173076923081.4310256201213895.7476272721697
Trimmed Mean ( 24 / 24 )137.0966666666671.3709698073117499.9997709179986
Median136.33
Midrange151.525
Midmean - Weighted Average at Xnp136.738378378378
Midmean - Weighted Average at X(n+1)p137.1775
Midmean - Empirical Distribution Function136.738378378378
Midmean - Empirical Distribution Function - Averaging137.1775
Midmean - Empirical Distribution Function - Interpolation137.1775
Midmean - Closest Observation136.738378378378
Midmean - True Basic - Statistics Graphics Toolkit137.1775
Midmean - MS Excel (old versions)137.318947368421
Number of observations72

\begin{tabular}{lllllllll}
\hline
Central Tendency - Ungrouped Data \tabularnewline
Measure & Value & S.E. & Value/S.E. \tabularnewline
Arithmetic Mean & 141.495416666667 & 2.88063480561382 & 49.1195261512908 \tabularnewline
Geometric Mean & 139.511449825463 &  &  \tabularnewline
Harmonic Mean & 137.633103977451 &  &  \tabularnewline
Quadratic Mean & 143.562233809553 &  &  \tabularnewline
Winsorized Mean ( 1 / 24 ) & 141.505694444444 & 2.87346186538107 & 49.2457186048921 \tabularnewline
Winsorized Mean ( 2 / 24 ) & 141.447916666667 & 2.84540889119967 & 49.7109280511982 \tabularnewline
Winsorized Mean ( 3 / 24 ) & 141.385833333333 & 2.80502267731761 & 50.404524168959 \tabularnewline
Winsorized Mean ( 4 / 24 ) & 141.105277777778 & 2.68717218018995 & 52.5106946320811 \tabularnewline
Winsorized Mean ( 5 / 24 ) & 140.9525 & 2.63086736583876 & 53.5764371211706 \tabularnewline
Winsorized Mean ( 6 / 24 ) & 140.9575 & 2.6106457654377 & 53.9933459629545 \tabularnewline
Winsorized Mean ( 7 / 24 ) & 141.061527777778 & 2.57286109002508 & 54.8267173555036 \tabularnewline
Winsorized Mean ( 8 / 24 ) & 140.917083333333 & 2.52555157084376 & 55.7965574570526 \tabularnewline
Winsorized Mean ( 9 / 24 ) & 140.640833333333 & 2.44485979696972 & 57.5251118725297 \tabularnewline
Winsorized Mean ( 10 / 24 ) & 140.524166666667 & 2.39055363960613 & 58.7831054440676 \tabularnewline
Winsorized Mean ( 11 / 24 ) & 140.249166666667 & 2.31849500377958 & 60.4914681455144 \tabularnewline
Winsorized Mean ( 12 / 24 ) & 140.2475 & 2.30148686163025 & 60.9377799796156 \tabularnewline
Winsorized Mean ( 13 / 24 ) & 140.070555555556 & 2.20927106398255 & 63.4012538520542 \tabularnewline
Winsorized Mean ( 14 / 24 ) & 139.977222222222 & 2.110968812641 & 66.309469559192 \tabularnewline
Winsorized Mean ( 15 / 24 ) & 139.220972222222 & 1.95450760221732 & 71.23071410123 \tabularnewline
Winsorized Mean ( 16 / 24 ) & 138.629861111111 & 1.83181375877384 & 75.6790151002607 \tabularnewline
Winsorized Mean ( 17 / 24 ) & 138.52125 & 1.80546619309074 & 76.7232588071162 \tabularnewline
Winsorized Mean ( 18 / 24 ) & 138.01625 & 1.68244715247536 & 82.0330372915063 \tabularnewline
Winsorized Mean ( 19 / 24 ) & 137.720694444444 & 1.60007231994212 & 86.071543597121 \tabularnewline
Winsorized Mean ( 20 / 24 ) & 137.295694444444 & 1.50183733100311 & 91.4184856177075 \tabularnewline
Winsorized Mean ( 21 / 24 ) & 137.036111111111 & 1.42341668010795 & 96.2726607227329 \tabularnewline
Winsorized Mean ( 22 / 24 ) & 136.498333333333 & 1.28432034783715 & 106.280597020208 \tabularnewline
Winsorized Mean ( 23 / 24 ) & 136.408888888889 & 1.25513152574978 & 108.680951828855 \tabularnewline
Winsorized Mean ( 24 / 24 ) & 136.408888888889 & 1.20201287810803 & 113.483716666661 \tabularnewline
Trimmed Mean ( 1 / 24 ) & 141.208857142857 & 2.80279842073629 & 50.3813817283947 \tabularnewline
Trimmed Mean ( 2 / 24 ) & 140.894558823529 & 2.71826498879962 & 51.8325326647967 \tabularnewline
Trimmed Mean ( 3 / 24 ) & 140.592727272727 & 2.63493087665119 & 53.3572734368693 \tabularnewline
Trimmed Mean ( 4 / 24 ) & 140.2953125 & 2.55325589650804 & 54.9476112801208 \tabularnewline
Trimmed Mean ( 5 / 24 ) & 140.060161290323 & 2.49869362474692 & 56.0533552025645 \tabularnewline
Trimmed Mean ( 6 / 24 ) & 139.846 & 2.4497573637491 & 57.0856534893644 \tabularnewline
Trimmed Mean ( 7 / 24 ) & 139.616034482759 & 2.39483848255178 & 58.2987268243632 \tabularnewline
Trimmed Mean ( 8 / 24 ) & 139.350535714286 & 2.33617581312857 & 59.6489934238595 \tabularnewline
Trimmed Mean ( 9 / 24 ) & 139.089444444444 & 2.27475270949498 & 61.1448637312861 \tabularnewline
Trimmed Mean ( 10 / 24 ) & 138.850769230769 & 2.21723369367089 & 62.6234255897877 \tabularnewline
Trimmed Mean ( 11 / 24 ) & 138.6098 & 2.15680005771967 & 64.2664114848682 \tabularnewline
Trimmed Mean ( 12 / 24 ) & 138.38625 & 2.09639835153427 & 66.0114285525557 \tabularnewline
Trimmed Mean ( 13 / 24 ) & 138.14347826087 & 2.02175967783439 & 68.3283378214575 \tabularnewline
Trimmed Mean ( 14 / 24 ) & 137.900909090909 & 1.94663741676922 & 70.8405725190361 \tabularnewline
Trimmed Mean ( 15 / 24 ) & 137.646666666667 & 1.87123493189513 & 73.5592652320051 \tabularnewline
Trimmed Mean ( 16 / 24 ) & 137.45775 & 1.81100236048424 & 75.9014747850718 \tabularnewline
Trimmed Mean ( 17 / 24 ) & 137.318947368421 & 1.76038712885912 & 78.004971245964 \tabularnewline
Trimmed Mean ( 18 / 24 ) & 137.1775 & 1.69649224358371 & 80.8594914116573 \tabularnewline
Trimmed Mean ( 19 / 24 ) & 137.078823529412 & 1.64083658527931 & 83.5420326187313 \tabularnewline
Trimmed Mean ( 20 / 24 ) & 137.0028125 & 1.58407448774889 & 86.4876074702102 \tabularnewline
Trimmed Mean ( 21 / 24 ) & 136.967666666667 & 1.53009012455869 & 89.5160778233053 \tabularnewline
Trimmed Mean ( 22 / 24 ) & 136.959285714286 & 1.47311990558672 & 92.9722592131677 \tabularnewline
Trimmed Mean ( 23 / 24 ) & 137.017307692308 & 1.43102562012138 & 95.7476272721697 \tabularnewline
Trimmed Mean ( 24 / 24 ) & 137.096666666667 & 1.37096980731174 & 99.9997709179986 \tabularnewline
Median & 136.33 &  &  \tabularnewline
Midrange & 151.525 &  &  \tabularnewline
Midmean - Weighted Average at Xnp & 136.738378378378 &  &  \tabularnewline
Midmean - Weighted Average at X(n+1)p & 137.1775 &  &  \tabularnewline
Midmean - Empirical Distribution Function & 136.738378378378 &  &  \tabularnewline
Midmean - Empirical Distribution Function - Averaging & 137.1775 &  &  \tabularnewline
Midmean - Empirical Distribution Function - Interpolation & 137.1775 &  &  \tabularnewline
Midmean - Closest Observation & 136.738378378378 &  &  \tabularnewline
Midmean - True Basic - Statistics Graphics Toolkit & 137.1775 &  &  \tabularnewline
Midmean - MS Excel (old versions) & 137.318947368421 &  &  \tabularnewline
Number of observations & 72 &  &  \tabularnewline
\hline
\end{tabular}
%Source: https://freestatistics.org/blog/index.php?pk=163469&T=1

[TABLE]
[ROW][C]Central Tendency - Ungrouped Data[/C][/ROW]
[ROW][C]Measure[/C][C]Value[/C][C]S.E.[/C][C]Value/S.E.[/C][/ROW]
[ROW][C]Arithmetic Mean[/C][C]141.495416666667[/C][C]2.88063480561382[/C][C]49.1195261512908[/C][/ROW]
[ROW][C]Geometric Mean[/C][C]139.511449825463[/C][C][/C][C][/C][/ROW]
[ROW][C]Harmonic Mean[/C][C]137.633103977451[/C][C][/C][C][/C][/ROW]
[ROW][C]Quadratic Mean[/C][C]143.562233809553[/C][C][/C][C][/C][/ROW]
[ROW][C]Winsorized Mean ( 1 / 24 )[/C][C]141.505694444444[/C][C]2.87346186538107[/C][C]49.2457186048921[/C][/ROW]
[ROW][C]Winsorized Mean ( 2 / 24 )[/C][C]141.447916666667[/C][C]2.84540889119967[/C][C]49.7109280511982[/C][/ROW]
[ROW][C]Winsorized Mean ( 3 / 24 )[/C][C]141.385833333333[/C][C]2.80502267731761[/C][C]50.404524168959[/C][/ROW]
[ROW][C]Winsorized Mean ( 4 / 24 )[/C][C]141.105277777778[/C][C]2.68717218018995[/C][C]52.5106946320811[/C][/ROW]
[ROW][C]Winsorized Mean ( 5 / 24 )[/C][C]140.9525[/C][C]2.63086736583876[/C][C]53.5764371211706[/C][/ROW]
[ROW][C]Winsorized Mean ( 6 / 24 )[/C][C]140.9575[/C][C]2.6106457654377[/C][C]53.9933459629545[/C][/ROW]
[ROW][C]Winsorized Mean ( 7 / 24 )[/C][C]141.061527777778[/C][C]2.57286109002508[/C][C]54.8267173555036[/C][/ROW]
[ROW][C]Winsorized Mean ( 8 / 24 )[/C][C]140.917083333333[/C][C]2.52555157084376[/C][C]55.7965574570526[/C][/ROW]
[ROW][C]Winsorized Mean ( 9 / 24 )[/C][C]140.640833333333[/C][C]2.44485979696972[/C][C]57.5251118725297[/C][/ROW]
[ROW][C]Winsorized Mean ( 10 / 24 )[/C][C]140.524166666667[/C][C]2.39055363960613[/C][C]58.7831054440676[/C][/ROW]
[ROW][C]Winsorized Mean ( 11 / 24 )[/C][C]140.249166666667[/C][C]2.31849500377958[/C][C]60.4914681455144[/C][/ROW]
[ROW][C]Winsorized Mean ( 12 / 24 )[/C][C]140.2475[/C][C]2.30148686163025[/C][C]60.9377799796156[/C][/ROW]
[ROW][C]Winsorized Mean ( 13 / 24 )[/C][C]140.070555555556[/C][C]2.20927106398255[/C][C]63.4012538520542[/C][/ROW]
[ROW][C]Winsorized Mean ( 14 / 24 )[/C][C]139.977222222222[/C][C]2.110968812641[/C][C]66.309469559192[/C][/ROW]
[ROW][C]Winsorized Mean ( 15 / 24 )[/C][C]139.220972222222[/C][C]1.95450760221732[/C][C]71.23071410123[/C][/ROW]
[ROW][C]Winsorized Mean ( 16 / 24 )[/C][C]138.629861111111[/C][C]1.83181375877384[/C][C]75.6790151002607[/C][/ROW]
[ROW][C]Winsorized Mean ( 17 / 24 )[/C][C]138.52125[/C][C]1.80546619309074[/C][C]76.7232588071162[/C][/ROW]
[ROW][C]Winsorized Mean ( 18 / 24 )[/C][C]138.01625[/C][C]1.68244715247536[/C][C]82.0330372915063[/C][/ROW]
[ROW][C]Winsorized Mean ( 19 / 24 )[/C][C]137.720694444444[/C][C]1.60007231994212[/C][C]86.071543597121[/C][/ROW]
[ROW][C]Winsorized Mean ( 20 / 24 )[/C][C]137.295694444444[/C][C]1.50183733100311[/C][C]91.4184856177075[/C][/ROW]
[ROW][C]Winsorized Mean ( 21 / 24 )[/C][C]137.036111111111[/C][C]1.42341668010795[/C][C]96.2726607227329[/C][/ROW]
[ROW][C]Winsorized Mean ( 22 / 24 )[/C][C]136.498333333333[/C][C]1.28432034783715[/C][C]106.280597020208[/C][/ROW]
[ROW][C]Winsorized Mean ( 23 / 24 )[/C][C]136.408888888889[/C][C]1.25513152574978[/C][C]108.680951828855[/C][/ROW]
[ROW][C]Winsorized Mean ( 24 / 24 )[/C][C]136.408888888889[/C][C]1.20201287810803[/C][C]113.483716666661[/C][/ROW]
[ROW][C]Trimmed Mean ( 1 / 24 )[/C][C]141.208857142857[/C][C]2.80279842073629[/C][C]50.3813817283947[/C][/ROW]
[ROW][C]Trimmed Mean ( 2 / 24 )[/C][C]140.894558823529[/C][C]2.71826498879962[/C][C]51.8325326647967[/C][/ROW]
[ROW][C]Trimmed Mean ( 3 / 24 )[/C][C]140.592727272727[/C][C]2.63493087665119[/C][C]53.3572734368693[/C][/ROW]
[ROW][C]Trimmed Mean ( 4 / 24 )[/C][C]140.2953125[/C][C]2.55325589650804[/C][C]54.9476112801208[/C][/ROW]
[ROW][C]Trimmed Mean ( 5 / 24 )[/C][C]140.060161290323[/C][C]2.49869362474692[/C][C]56.0533552025645[/C][/ROW]
[ROW][C]Trimmed Mean ( 6 / 24 )[/C][C]139.846[/C][C]2.4497573637491[/C][C]57.0856534893644[/C][/ROW]
[ROW][C]Trimmed Mean ( 7 / 24 )[/C][C]139.616034482759[/C][C]2.39483848255178[/C][C]58.2987268243632[/C][/ROW]
[ROW][C]Trimmed Mean ( 8 / 24 )[/C][C]139.350535714286[/C][C]2.33617581312857[/C][C]59.6489934238595[/C][/ROW]
[ROW][C]Trimmed Mean ( 9 / 24 )[/C][C]139.089444444444[/C][C]2.27475270949498[/C][C]61.1448637312861[/C][/ROW]
[ROW][C]Trimmed Mean ( 10 / 24 )[/C][C]138.850769230769[/C][C]2.21723369367089[/C][C]62.6234255897877[/C][/ROW]
[ROW][C]Trimmed Mean ( 11 / 24 )[/C][C]138.6098[/C][C]2.15680005771967[/C][C]64.2664114848682[/C][/ROW]
[ROW][C]Trimmed Mean ( 12 / 24 )[/C][C]138.38625[/C][C]2.09639835153427[/C][C]66.0114285525557[/C][/ROW]
[ROW][C]Trimmed Mean ( 13 / 24 )[/C][C]138.14347826087[/C][C]2.02175967783439[/C][C]68.3283378214575[/C][/ROW]
[ROW][C]Trimmed Mean ( 14 / 24 )[/C][C]137.900909090909[/C][C]1.94663741676922[/C][C]70.8405725190361[/C][/ROW]
[ROW][C]Trimmed Mean ( 15 / 24 )[/C][C]137.646666666667[/C][C]1.87123493189513[/C][C]73.5592652320051[/C][/ROW]
[ROW][C]Trimmed Mean ( 16 / 24 )[/C][C]137.45775[/C][C]1.81100236048424[/C][C]75.9014747850718[/C][/ROW]
[ROW][C]Trimmed Mean ( 17 / 24 )[/C][C]137.318947368421[/C][C]1.76038712885912[/C][C]78.004971245964[/C][/ROW]
[ROW][C]Trimmed Mean ( 18 / 24 )[/C][C]137.1775[/C][C]1.69649224358371[/C][C]80.8594914116573[/C][/ROW]
[ROW][C]Trimmed Mean ( 19 / 24 )[/C][C]137.078823529412[/C][C]1.64083658527931[/C][C]83.5420326187313[/C][/ROW]
[ROW][C]Trimmed Mean ( 20 / 24 )[/C][C]137.0028125[/C][C]1.58407448774889[/C][C]86.4876074702102[/C][/ROW]
[ROW][C]Trimmed Mean ( 21 / 24 )[/C][C]136.967666666667[/C][C]1.53009012455869[/C][C]89.5160778233053[/C][/ROW]
[ROW][C]Trimmed Mean ( 22 / 24 )[/C][C]136.959285714286[/C][C]1.47311990558672[/C][C]92.9722592131677[/C][/ROW]
[ROW][C]Trimmed Mean ( 23 / 24 )[/C][C]137.017307692308[/C][C]1.43102562012138[/C][C]95.7476272721697[/C][/ROW]
[ROW][C]Trimmed Mean ( 24 / 24 )[/C][C]137.096666666667[/C][C]1.37096980731174[/C][C]99.9997709179986[/C][/ROW]
[ROW][C]Median[/C][C]136.33[/C][C][/C][C][/C][/ROW]
[ROW][C]Midrange[/C][C]151.525[/C][C][/C][C][/C][/ROW]
[ROW][C]Midmean - Weighted Average at Xnp[/C][C]136.738378378378[/C][C][/C][C][/C][/ROW]
[ROW][C]Midmean - Weighted Average at X(n+1)p[/C][C]137.1775[/C][C][/C][C][/C][/ROW]
[ROW][C]Midmean - Empirical Distribution Function[/C][C]136.738378378378[/C][C][/C][C][/C][/ROW]
[ROW][C]Midmean - Empirical Distribution Function - Averaging[/C][C]137.1775[/C][C][/C][C][/C][/ROW]
[ROW][C]Midmean - Empirical Distribution Function - Interpolation[/C][C]137.1775[/C][C][/C][C][/C][/ROW]
[ROW][C]Midmean - Closest Observation[/C][C]136.738378378378[/C][C][/C][C][/C][/ROW]
[ROW][C]Midmean - True Basic - Statistics Graphics Toolkit[/C][C]137.1775[/C][C][/C][C][/C][/ROW]
[ROW][C]Midmean - MS Excel (old versions)[/C][C]137.318947368421[/C][C][/C][C][/C][/ROW]
[ROW][C]Number of observations[/C][C]72[/C][C][/C][C][/C][/ROW]
[/TABLE]
Source: https://freestatistics.org/blog/index.php?pk=163469&T=1

Globally Unique Identifier (entire table): ba.freestatistics.org/blog/index.php?pk=163469&T=1

As an alternative you can also use a QR Code:  

The GUIDs for individual cells are displayed in the table below:

Central Tendency - Ungrouped Data
MeasureValueS.E.Value/S.E.
Arithmetic Mean141.4954166666672.8806348056138249.1195261512908
Geometric Mean139.511449825463
Harmonic Mean137.633103977451
Quadratic Mean143.562233809553
Winsorized Mean ( 1 / 24 )141.5056944444442.8734618653810749.2457186048921
Winsorized Mean ( 2 / 24 )141.4479166666672.8454088911996749.7109280511982
Winsorized Mean ( 3 / 24 )141.3858333333332.8050226773176150.404524168959
Winsorized Mean ( 4 / 24 )141.1052777777782.6871721801899552.5106946320811
Winsorized Mean ( 5 / 24 )140.95252.6308673658387653.5764371211706
Winsorized Mean ( 6 / 24 )140.95752.610645765437753.9933459629545
Winsorized Mean ( 7 / 24 )141.0615277777782.5728610900250854.8267173555036
Winsorized Mean ( 8 / 24 )140.9170833333332.5255515708437655.7965574570526
Winsorized Mean ( 9 / 24 )140.6408333333332.4448597969697257.5251118725297
Winsorized Mean ( 10 / 24 )140.5241666666672.3905536396061358.7831054440676
Winsorized Mean ( 11 / 24 )140.2491666666672.3184950037795860.4914681455144
Winsorized Mean ( 12 / 24 )140.24752.3014868616302560.9377799796156
Winsorized Mean ( 13 / 24 )140.0705555555562.2092710639825563.4012538520542
Winsorized Mean ( 14 / 24 )139.9772222222222.11096881264166.309469559192
Winsorized Mean ( 15 / 24 )139.2209722222221.9545076022173271.23071410123
Winsorized Mean ( 16 / 24 )138.6298611111111.8318137587738475.6790151002607
Winsorized Mean ( 17 / 24 )138.521251.8054661930907476.7232588071162
Winsorized Mean ( 18 / 24 )138.016251.6824471524753682.0330372915063
Winsorized Mean ( 19 / 24 )137.7206944444441.6000723199421286.071543597121
Winsorized Mean ( 20 / 24 )137.2956944444441.5018373310031191.4184856177075
Winsorized Mean ( 21 / 24 )137.0361111111111.4234166801079596.2726607227329
Winsorized Mean ( 22 / 24 )136.4983333333331.28432034783715106.280597020208
Winsorized Mean ( 23 / 24 )136.4088888888891.25513152574978108.680951828855
Winsorized Mean ( 24 / 24 )136.4088888888891.20201287810803113.483716666661
Trimmed Mean ( 1 / 24 )141.2088571428572.8027984207362950.3813817283947
Trimmed Mean ( 2 / 24 )140.8945588235292.7182649887996251.8325326647967
Trimmed Mean ( 3 / 24 )140.5927272727272.6349308766511953.3572734368693
Trimmed Mean ( 4 / 24 )140.29531252.5532558965080454.9476112801208
Trimmed Mean ( 5 / 24 )140.0601612903232.4986936247469256.0533552025645
Trimmed Mean ( 6 / 24 )139.8462.449757363749157.0856534893644
Trimmed Mean ( 7 / 24 )139.6160344827592.3948384825517858.2987268243632
Trimmed Mean ( 8 / 24 )139.3505357142862.3361758131285759.6489934238595
Trimmed Mean ( 9 / 24 )139.0894444444442.2747527094949861.1448637312861
Trimmed Mean ( 10 / 24 )138.8507692307692.2172336936708962.6234255897877
Trimmed Mean ( 11 / 24 )138.60982.1568000577196764.2664114848682
Trimmed Mean ( 12 / 24 )138.386252.0963983515342766.0114285525557
Trimmed Mean ( 13 / 24 )138.143478260872.0217596778343968.3283378214575
Trimmed Mean ( 14 / 24 )137.9009090909091.9466374167692270.8405725190361
Trimmed Mean ( 15 / 24 )137.6466666666671.8712349318951373.5592652320051
Trimmed Mean ( 16 / 24 )137.457751.8110023604842475.9014747850718
Trimmed Mean ( 17 / 24 )137.3189473684211.7603871288591278.004971245964
Trimmed Mean ( 18 / 24 )137.17751.6964922435837180.8594914116573
Trimmed Mean ( 19 / 24 )137.0788235294121.6408365852793183.5420326187313
Trimmed Mean ( 20 / 24 )137.00281251.5840744877488986.4876074702102
Trimmed Mean ( 21 / 24 )136.9676666666671.5300901245586989.5160778233053
Trimmed Mean ( 22 / 24 )136.9592857142861.4731199055867292.9722592131677
Trimmed Mean ( 23 / 24 )137.0173076923081.4310256201213895.7476272721697
Trimmed Mean ( 24 / 24 )137.0966666666671.3709698073117499.9997709179986
Median136.33
Midrange151.525
Midmean - Weighted Average at Xnp136.738378378378
Midmean - Weighted Average at X(n+1)p137.1775
Midmean - Empirical Distribution Function136.738378378378
Midmean - Empirical Distribution Function - Averaging137.1775
Midmean - Empirical Distribution Function - Interpolation137.1775
Midmean - Closest Observation136.738378378378
Midmean - True Basic - Statistics Graphics Toolkit137.1775
Midmean - MS Excel (old versions)137.318947368421
Number of observations72


Parameters (Session):
Parameters (R input):
R code (references can be found in the software module):
geomean <- function(x) {
return(exp(mean(log(x))))
}
harmean <- function(x) {
return(1/mean(1/x))
}
quamean <- function(x) {
return(sqrt(mean(x*x)))
}
winmean <- function(x) {
x <-sort(x[!is.na(x)])
n<-length(x)
denom <- 3
nodenom <- n/denom
if (nodenom>40) denom <- n/40
sqrtn = sqrt(n)
roundnodenom = floor(nodenom)
win <- array(NA,dim=c(roundnodenom,2))
for (j in 1:roundnodenom) {
win[j,1] <- (j*x[j+1]+sum(x[(j+1):(n-j)])+j*x[n-j])/n
win[j,2] <- sd(c(rep(x[j+1],j),x[(j+1):(n-j)],rep(x[n-j],j)))/sqrtn
}
return(win)
}
trimean <- function(x) {
x <-sort(x[!is.na(x)])
n<-length(x)
denom <- 3
nodenom <- n/denom
if (nodenom>40) denom <- n/40
sqrtn = sqrt(n)
roundnodenom = floor(nodenom)
tri <- array(NA,dim=c(roundnodenom,2))
for (j in 1:roundnodenom) {
tri[j,1] <- mean(x,trim=j/n)
tri[j,2] <- sd(x[(j+1):(n-j)]) / sqrt(n-j*2)
}
return(tri)
}
midrange <- function(x) {
return((max(x)+min(x))/2)
}
q1 <- function(data,n,p,i,f) {
np <- n*p;
i <<- floor(np)
f <<- np - i
qvalue <- (1-f)*data[i] + f*data[i+1]
}
q2 <- function(data,n,p,i,f) {
np <- (n+1)*p
i <<- floor(np)
f <<- np - i
qvalue <- (1-f)*data[i] + f*data[i+1]
}
q3 <- function(data,n,p,i,f) {
np <- n*p
i <<- floor(np)
f <<- np - i
if (f==0) {
qvalue <- data[i]
} else {
qvalue <- data[i+1]
}
}
q4 <- function(data,n,p,i,f) {
np <- n*p
i <<- floor(np)
f <<- np - i
if (f==0) {
qvalue <- (data[i]+data[i+1])/2
} else {
qvalue <- data[i+1]
}
}
q5 <- function(data,n,p,i,f) {
np <- (n-1)*p
i <<- floor(np)
f <<- np - i
if (f==0) {
qvalue <- data[i+1]
} else {
qvalue <- data[i+1] + f*(data[i+2]-data[i+1])
}
}
q6 <- function(data,n,p,i,f) {
np <- n*p+0.5
i <<- floor(np)
f <<- np - i
qvalue <- data[i]
}
q7 <- function(data,n,p,i,f) {
np <- (n+1)*p
i <<- floor(np)
f <<- np - i
if (f==0) {
qvalue <- data[i]
} else {
qvalue <- f*data[i] + (1-f)*data[i+1]
}
}
q8 <- function(data,n,p,i,f) {
np <- (n+1)*p
i <<- floor(np)
f <<- np - i
if (f==0) {
qvalue <- data[i]
} else {
if (f == 0.5) {
qvalue <- (data[i]+data[i+1])/2
} else {
if (f < 0.5) {
qvalue <- data[i]
} else {
qvalue <- data[i+1]
}
}
}
}
midmean <- function(x,def) {
x <-sort(x[!is.na(x)])
n<-length(x)
if (def==1) {
qvalue1 <- q1(x,n,0.25,i,f)
qvalue3 <- q1(x,n,0.75,i,f)
}
if (def==2) {
qvalue1 <- q2(x,n,0.25,i,f)
qvalue3 <- q2(x,n,0.75,i,f)
}
if (def==3) {
qvalue1 <- q3(x,n,0.25,i,f)
qvalue3 <- q3(x,n,0.75,i,f)
}
if (def==4) {
qvalue1 <- q4(x,n,0.25,i,f)
qvalue3 <- q4(x,n,0.75,i,f)
}
if (def==5) {
qvalue1 <- q5(x,n,0.25,i,f)
qvalue3 <- q5(x,n,0.75,i,f)
}
if (def==6) {
qvalue1 <- q6(x,n,0.25,i,f)
qvalue3 <- q6(x,n,0.75,i,f)
}
if (def==7) {
qvalue1 <- q7(x,n,0.25,i,f)
qvalue3 <- q7(x,n,0.75,i,f)
}
if (def==8) {
qvalue1 <- q8(x,n,0.25,i,f)
qvalue3 <- q8(x,n,0.75,i,f)
}
midm <- 0
myn <- 0
roundno4 <- round(n/4)
round3no4 <- round(3*n/4)
for (i in 1:n) {
if ((x[i]>=qvalue1) & (x[i]<=qvalue3)){
midm = midm + x[i]
myn = myn + 1
}
}
midm = midm / myn
return(midm)
}
(arm <- mean(x))
sqrtn <- sqrt(length(x))
(armse <- sd(x) / sqrtn)
(armose <- arm / armse)
(geo <- geomean(x))
(har <- harmean(x))
(qua <- quamean(x))
(win <- winmean(x))
(tri <- trimean(x))
(midr <- midrange(x))
midm <- array(NA,dim=8)
for (j in 1:8) midm[j] <- midmean(x,j)
midm
bitmap(file='test1.png')
lb <- win[,1] - 2*win[,2]
ub <- win[,1] + 2*win[,2]
if ((ylimmin == '') | (ylimmax == '')) plot(win[,1],type='b',main=main, xlab='j', pch=19, ylab='Winsorized Mean(j/n)', ylim=c(min(lb),max(ub))) else plot(win[,1],type='l',main=main, xlab='j', pch=19, ylab='Winsorized Mean(j/n)', ylim=c(ylimmin,ylimmax))
lines(ub,lty=3)
lines(lb,lty=3)
grid()
dev.off()
bitmap(file='test2.png')
lb <- tri[,1] - 2*tri[,2]
ub <- tri[,1] + 2*tri[,2]
if ((ylimmin == '') | (ylimmax == '')) plot(tri[,1],type='b',main=main, xlab='j', pch=19, ylab='Trimmed Mean(j/n)', ylim=c(min(lb),max(ub))) else plot(tri[,1],type='l',main=main, xlab='j', pch=19, ylab='Trimmed Mean(j/n)', ylim=c(ylimmin,ylimmax))
lines(ub,lty=3)
lines(lb,lty=3)
grid()
dev.off()
load(file='createtable')
a<-table.start()
a<-table.row.start(a)
a<-table.element(a,'Central Tendency - Ungrouped Data',4,TRUE)
a<-table.row.end(a)
a<-table.row.start(a)
a<-table.element(a,'Measure',header=TRUE)
a<-table.element(a,'Value',header=TRUE)
a<-table.element(a,'S.E.',header=TRUE)
a<-table.element(a,'Value/S.E.',header=TRUE)
a<-table.row.end(a)
a<-table.row.start(a)
a<-table.element(a,hyperlink('arithmetic_mean.htm', 'Arithmetic Mean', 'click to view the definition of the Arithmetic Mean'),header=TRUE)
a<-table.element(a,arm)
a<-table.element(a,hyperlink('arithmetic_mean_standard_error.htm', armse, 'click to view the definition of the Standard Error of the Arithmetic Mean'))
a<-table.element(a,armose)
a<-table.row.end(a)
a<-table.row.start(a)
a<-table.element(a,hyperlink('geometric_mean.htm', 'Geometric Mean', 'click to view the definition of the Geometric Mean'),header=TRUE)
a<-table.element(a,geo)
a<-table.element(a,'')
a<-table.row.end(a)
a<-table.row.start(a)
a<-table.element(a,hyperlink('harmonic_mean.htm', 'Harmonic Mean', 'click to view the definition of the Harmonic Mean'),header=TRUE)
a<-table.element(a,har)
a<-table.element(a,'')
a<-table.row.end(a)
a<-table.row.start(a)
a<-table.element(a,hyperlink('quadratic_mean.htm', 'Quadratic Mean', 'click to view the definition of the Quadratic Mean'),header=TRUE)
a<-table.element(a,qua)
a<-table.element(a,'')
a<-table.row.end(a)
for (j in 1:length(win[,1])) {
a<-table.row.start(a)
mylabel <- paste('Winsorized Mean (',j)
mylabel <- paste(mylabel,'/')
mylabel <- paste(mylabel,length(win[,1]))
mylabel <- paste(mylabel,')')
a<-table.element(a,hyperlink('winsorized_mean.htm', mylabel, 'click to view the definition of the Winsorized Mean'),header=TRUE)
a<-table.element(a,win[j,1])
a<-table.element(a,win[j,2])
a<-table.element(a,win[j,1]/win[j,2])
a<-table.row.end(a)
}
for (j in 1:length(tri[,1])) {
a<-table.row.start(a)
mylabel <- paste('Trimmed Mean (',j)
mylabel <- paste(mylabel,'/')
mylabel <- paste(mylabel,length(tri[,1]))
mylabel <- paste(mylabel,')')
a<-table.element(a,hyperlink('arithmetic_mean.htm', mylabel, 'click to view the definition of the Trimmed Mean'),header=TRUE)
a<-table.element(a,tri[j,1])
a<-table.element(a,tri[j,2])
a<-table.element(a,tri[j,1]/tri[j,2])
a<-table.row.end(a)
}
a<-table.row.start(a)
a<-table.element(a,hyperlink('median_1.htm', 'Median', 'click to view the definition of the Median'),header=TRUE)
a<-table.element(a,median(x))
a<-table.element(a,'')
a<-table.row.end(a)
a<-table.row.start(a)
a<-table.element(a,hyperlink('midrange.htm', 'Midrange', 'click to view the definition of the Midrange'),header=TRUE)
a<-table.element(a,midr)
a<-table.element(a,'')
a<-table.row.end(a)
a<-table.row.start(a)
mymid <- hyperlink('midmean.htm', 'Midmean', 'click to view the definition of the Midmean')
mylabel <- paste(mymid,hyperlink('method_1.htm','Weighted Average at Xnp',''),sep=' - ')
a<-table.element(a,mylabel,header=TRUE)
a<-table.element(a,midm[1])
a<-table.element(a,'')
a<-table.row.end(a)
a<-table.row.start(a)
mymid <- hyperlink('midmean.htm', 'Midmean', 'click to view the definition of the Midmean')
mylabel <- paste(mymid,hyperlink('method_2.htm','Weighted Average at X(n+1)p',''),sep=' - ')
a<-table.element(a,mylabel,header=TRUE)
a<-table.element(a,midm[2])
a<-table.element(a,'')
a<-table.row.end(a)
a<-table.row.start(a)
mymid <- hyperlink('midmean.htm', 'Midmean', 'click to view the definition of the Midmean')
mylabel <- paste(mymid,hyperlink('method_3.htm','Empirical Distribution Function',''),sep=' - ')
a<-table.element(a,mylabel,header=TRUE)
a<-table.element(a,midm[3])
a<-table.element(a,'')
a<-table.row.end(a)
a<-table.row.start(a)
mymid <- hyperlink('midmean.htm', 'Midmean', 'click to view the definition of the Midmean')
mylabel <- paste(mymid,hyperlink('method_4.htm','Empirical Distribution Function - Averaging',''),sep=' - ')
a<-table.element(a,mylabel,header=TRUE)
a<-table.element(a,midm[4])
a<-table.element(a,'')
a<-table.row.end(a)
a<-table.row.start(a)
mymid <- hyperlink('midmean.htm', 'Midmean', 'click to view the definition of the Midmean')
mylabel <- paste(mymid,hyperlink('method_5.htm','Empirical Distribution Function - Interpolation',''),sep=' - ')
a<-table.element(a,mylabel,header=TRUE)
a<-table.element(a,midm[5])
a<-table.element(a,'')
a<-table.row.end(a)
a<-table.row.start(a)
mymid <- hyperlink('midmean.htm', 'Midmean', 'click to view the definition of the Midmean')
mylabel <- paste(mymid,hyperlink('method_6.htm','Closest Observation',''),sep=' - ')
a<-table.element(a,mylabel,header=TRUE)
a<-table.element(a,midm[6])
a<-table.element(a,'')
a<-table.row.end(a)
a<-table.row.start(a)
mymid <- hyperlink('midmean.htm', 'Midmean', 'click to view the definition of the Midmean')
mylabel <- paste(mymid,hyperlink('method_7.htm','True Basic - Statistics Graphics Toolkit',''),sep=' - ')
a<-table.element(a,mylabel,header=TRUE)
a<-table.element(a,midm[7])
a<-table.element(a,'')
a<-table.row.end(a)
a<-table.row.start(a)
mymid <- hyperlink('midmean.htm', 'Midmean', 'click to view the definition of the Midmean')
mylabel <- paste(mymid,hyperlink('method_8.htm','MS Excel (old versions)',''),sep=' - ')
a<-table.element(a,mylabel,header=TRUE)
a<-table.element(a,midm[8])
a<-table.element(a,'')
a<-table.row.end(a)
a<-table.row.start(a)
a<-table.element(a,'Number of observations',header=TRUE)
a<-table.element(a,length(x))
a<-table.element(a,'')
a<-table.row.end(a)
a<-table.end(a)
table.save(a,file='mytable.tab')