Free Statistics

of Irreproducible Research!

Author's title

Author*Unverified author*
R Software Modulerwasp_centraltendency.wasp
Title produced by softwareCentral Tendency
Date of computationFri, 02 Mar 2012 06:39:59 -0500
Cite this page as followsStatistical Computations at FreeStatistics.org, Office for Research Development and Education, URL https://freestatistics.org/blog/index.php?v=date/2012/Mar/02/t1330688514gxra9vobw2cdh0o.htm/, Retrieved Sun, 28 Apr 2024 15:16:15 +0000
Statistical Computations at FreeStatistics.org, Office for Research Development and Education, URL https://freestatistics.org/blog/index.php?pk=163412, Retrieved Sun, 28 Apr 2024 15:16:15 +0000
QR Codes:

Original text written by user:
IsPrivate?No (this computation is public)
User-defined keywords
Estimated Impact142
Family? (F = Feedback message, R = changed R code, M = changed R Module, P = changed Parameters, D = changed Data)
-       [Central Tendency] [] [2012-03-02 11:39:59] [1f4a81ae6fe0e483feb8688127b64584] [Current]
Feedback Forum

Post a new message
Dataseries X:
104,78
104,87
105,06
105,14
105,32
105,54
105,68
105,77
106,07
106,03
106,13
106,28
106,61
106,74
107,01
107,1
107,28
107,4
107,59
107,69
107,78
108,02
108
108,07
108,36
108,74
108,99
109,21
109,31
109,41
109,54
109,81
109,85
110,01
110,23
110,28
110,79
110,91
111,21
111,44
111,52
111,85
112,03
111,9
112,11
112,15
112,09
112,13
112,45
112,5
112,72
112,72
112,83
112,95
112,98
113,07
113,1
113,16
113,2
113,3
113,48
113,67
113,81
113,94
114,13
114,19
114,21
114,21
114,35
114,54
114,51
114,53


Summary of computational transaction
Raw Inputview raw input (R code)
Raw Outputview raw output of R engine
Computing time2 seconds
R Server'Herman Ole Andreas Wold' @ wold.wessa.net

\begin{tabular}{lllllllll}
\hline
Summary of computational transaction \tabularnewline
Raw Input & view raw input (R code)  \tabularnewline
Raw Output & view raw output of R engine  \tabularnewline
Computing time & 2 seconds \tabularnewline
R Server & 'Herman Ole Andreas Wold' @ wold.wessa.net \tabularnewline
\hline
\end{tabular}
%Source: https://freestatistics.org/blog/index.php?pk=163412&T=0

[TABLE]
[ROW][C]Summary of computational transaction[/C][/ROW]
[ROW][C]Raw Input[/C][C]view raw input (R code) [/C][/ROW]
[ROW][C]Raw Output[/C][C]view raw output of R engine [/C][/ROW]
[ROW][C]Computing time[/C][C]2 seconds[/C][/ROW]
[ROW][C]R Server[/C][C]'Herman Ole Andreas Wold' @ wold.wessa.net[/C][/ROW]
[/TABLE]
Source: https://freestatistics.org/blog/index.php?pk=163412&T=0

Globally Unique Identifier (entire table): ba.freestatistics.org/blog/index.php?pk=163412&T=0

As an alternative you can also use a QR Code:  

The GUIDs for individual cells are displayed in the table below:

Summary of computational transaction
Raw Inputview raw input (R code)
Raw Outputview raw output of R engine
Computing time2 seconds
R Server'Herman Ole Andreas Wold' @ wold.wessa.net


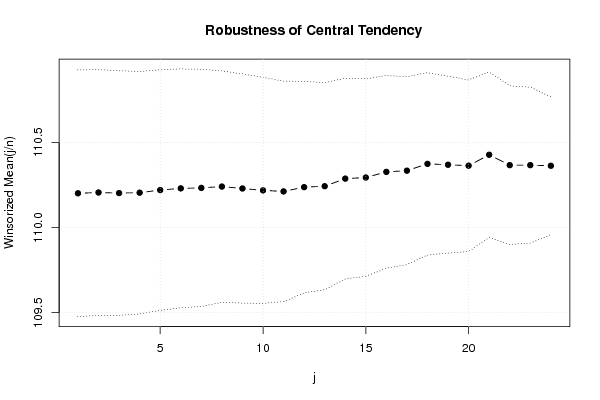
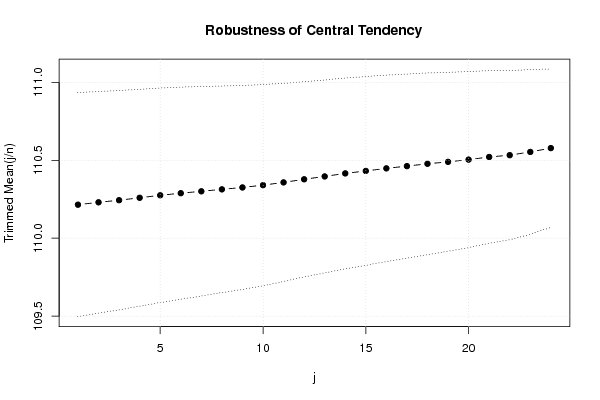
Central Tendency - Ungrouped Data
MeasureValueS.E.Value/S.E.
Arithmetic Mean110.1997222222220.362265626149871304.195911142373
Geometric Mean110.157238592416
Harmonic Mean110.114561241567
Quadratic Mean110.241990915944
Winsorized Mean ( 1 / 24 )110.2008333333330.361980875929021304.438274675434
Winsorized Mean ( 2 / 24 )110.2055555555560.360809974354177305.439326484295
Winsorized Mean ( 3 / 24 )110.2022222222220.359041729205295306.934301107964
Winsorized Mean ( 4 / 24 )110.2044444444440.355832626297463309.708655980066
Winsorized Mean ( 5 / 24 )110.2197222222220.352928945899546312.300035184969
Winsorized Mean ( 6 / 24 )110.2297222222220.350507678540784314.485898514764
Winsorized Mean ( 7 / 24 )110.2326388888890.347993353025913316.766506976013
Winsorized Mean ( 8 / 24 )110.2404166666670.339575556522605324.641790462112
Winsorized Mean ( 9 / 24 )110.2291666666670.336237800914313327.830976668674
Winsorized Mean ( 10 / 24 )110.2180555555560.331906372840469332.075743566792
Winsorized Mean ( 11 / 24 )110.2119444444440.323768138439017340.403922930184
Winsorized Mean ( 12 / 24 )110.2369444444440.310314699602001355.242418698923
Winsorized Mean ( 13 / 24 )110.2423611111110.303985555640671362.656577148107
Winsorized Mean ( 14 / 24 )110.2870833333330.294542923100375374.434673807286
Winsorized Mean ( 15 / 24 )110.2933333333330.289908382268513380.442029548424
Winsorized Mean ( 16 / 24 )110.3266666666670.2828608321971390.038683722
Winsorized Mean ( 17 / 24 )110.333750.275700235075164400.194617062694
Winsorized Mean ( 18 / 24 )110.373750.267645024345906412.388574268253
Winsorized Mean ( 19 / 24 )110.3684722222220.259531875111392425.259795833756
Winsorized Mean ( 20 / 24 )110.3629166666670.251854035705708438.20189879993
Winsorized Mean ( 21 / 24 )110.4270833333330.242698657597943454.996679529509
Winsorized Mean ( 22 / 24 )110.3659722222220.233024498812969473.623901282605
Winsorized Mean ( 23 / 24 )110.3659722222220.228707812901972482.563191968991
Winsorized Mean ( 24 / 24 )110.3626388888890.202489590243803545.028703727482
Trimmed Mean ( 1 / 24 )110.2151428571430.359045303165121306.967231949714
Trimmed Mean ( 2 / 24 )110.2302941176470.355394954627559310.162799674982
Trimmed Mean ( 3 / 24 )110.2437878787880.351615768595512313.53482330768
Trimmed Mean ( 4 / 24 )110.2593750.347704766879481317.106308290037
Trimmed Mean ( 5 / 24 )110.2753225806450.343959948548206320.605125817984
Trimmed Mean ( 6 / 24 )110.2886666666670.340125804796567324.258451171124
Trimmed Mean ( 7 / 24 )110.3008620689660.335920715994003328.35385499397
Trimmed Mean ( 8 / 24 )110.3133928571430.331201205843697333.070625682452
Trimmed Mean ( 9 / 24 )110.3255555555560.327170777189844337.210910164932
Trimmed Mean ( 10 / 24 )110.3403846153850.322653959828866341.977469217823
Trimmed Mean ( 11 / 24 )110.3580.317682166927376347.384938435113
Trimmed Mean ( 12 / 24 )110.3779166666670.312890034374876352.769038768496
Trimmed Mean ( 13 / 24 )110.3963043478260.309363903832928356.849338206715
Trimmed Mean ( 14 / 24 )110.4156818181820.30574630519831361.134966934646
Trimmed Mean ( 15 / 24 )110.4314285714290.302645434736891364.887144811663
Trimmed Mean ( 16 / 24 )110.4480.299031170658915369.352799431002
Trimmed Mean ( 17 / 24 )110.4623684210530.295263325878603374.114760417177
Trimmed Mean ( 18 / 24 )110.47750.291208313318888379.376188615266
Trimmed Mean ( 19 / 24 )110.4897058823530.28696409723266385.029719563739
Trimmed Mean ( 20 / 24 )110.50406250.282330758388201391.399304598823
Trimmed Mean ( 21 / 24 )110.5210.276956924324045399.054835945132
Trimmed Mean ( 22 / 24 )110.53250.271042288135398407.80536779111
Trimmed Mean ( 23 / 24 )110.5534615384620.264119985733578418.572874110248
Trimmed Mean ( 24 / 24 )110.5779166666670.253828638965223435.640033045354
Median110.535
Midrange109.66
Midmean - Weighted Average at Xnp110.394324324324
Midmean - Weighted Average at X(n+1)p110.4775
Midmean - Empirical Distribution Function110.394324324324
Midmean - Empirical Distribution Function - Averaging110.4775
Midmean - Empirical Distribution Function - Interpolation110.4775
Midmean - Closest Observation110.394324324324
Midmean - True Basic - Statistics Graphics Toolkit110.4775
Midmean - MS Excel (old versions)110.462368421053
Number of observations72

\begin{tabular}{lllllllll}
\hline
Central Tendency - Ungrouped Data \tabularnewline
Measure & Value & S.E. & Value/S.E. \tabularnewline
Arithmetic Mean & 110.199722222222 & 0.362265626149871 & 304.195911142373 \tabularnewline
Geometric Mean & 110.157238592416 &  &  \tabularnewline
Harmonic Mean & 110.114561241567 &  &  \tabularnewline
Quadratic Mean & 110.241990915944 &  &  \tabularnewline
Winsorized Mean ( 1 / 24 ) & 110.200833333333 & 0.361980875929021 & 304.438274675434 \tabularnewline
Winsorized Mean ( 2 / 24 ) & 110.205555555556 & 0.360809974354177 & 305.439326484295 \tabularnewline
Winsorized Mean ( 3 / 24 ) & 110.202222222222 & 0.359041729205295 & 306.934301107964 \tabularnewline
Winsorized Mean ( 4 / 24 ) & 110.204444444444 & 0.355832626297463 & 309.708655980066 \tabularnewline
Winsorized Mean ( 5 / 24 ) & 110.219722222222 & 0.352928945899546 & 312.300035184969 \tabularnewline
Winsorized Mean ( 6 / 24 ) & 110.229722222222 & 0.350507678540784 & 314.485898514764 \tabularnewline
Winsorized Mean ( 7 / 24 ) & 110.232638888889 & 0.347993353025913 & 316.766506976013 \tabularnewline
Winsorized Mean ( 8 / 24 ) & 110.240416666667 & 0.339575556522605 & 324.641790462112 \tabularnewline
Winsorized Mean ( 9 / 24 ) & 110.229166666667 & 0.336237800914313 & 327.830976668674 \tabularnewline
Winsorized Mean ( 10 / 24 ) & 110.218055555556 & 0.331906372840469 & 332.075743566792 \tabularnewline
Winsorized Mean ( 11 / 24 ) & 110.211944444444 & 0.323768138439017 & 340.403922930184 \tabularnewline
Winsorized Mean ( 12 / 24 ) & 110.236944444444 & 0.310314699602001 & 355.242418698923 \tabularnewline
Winsorized Mean ( 13 / 24 ) & 110.242361111111 & 0.303985555640671 & 362.656577148107 \tabularnewline
Winsorized Mean ( 14 / 24 ) & 110.287083333333 & 0.294542923100375 & 374.434673807286 \tabularnewline
Winsorized Mean ( 15 / 24 ) & 110.293333333333 & 0.289908382268513 & 380.442029548424 \tabularnewline
Winsorized Mean ( 16 / 24 ) & 110.326666666667 & 0.2828608321971 & 390.038683722 \tabularnewline
Winsorized Mean ( 17 / 24 ) & 110.33375 & 0.275700235075164 & 400.194617062694 \tabularnewline
Winsorized Mean ( 18 / 24 ) & 110.37375 & 0.267645024345906 & 412.388574268253 \tabularnewline
Winsorized Mean ( 19 / 24 ) & 110.368472222222 & 0.259531875111392 & 425.259795833756 \tabularnewline
Winsorized Mean ( 20 / 24 ) & 110.362916666667 & 0.251854035705708 & 438.20189879993 \tabularnewline
Winsorized Mean ( 21 / 24 ) & 110.427083333333 & 0.242698657597943 & 454.996679529509 \tabularnewline
Winsorized Mean ( 22 / 24 ) & 110.365972222222 & 0.233024498812969 & 473.623901282605 \tabularnewline
Winsorized Mean ( 23 / 24 ) & 110.365972222222 & 0.228707812901972 & 482.563191968991 \tabularnewline
Winsorized Mean ( 24 / 24 ) & 110.362638888889 & 0.202489590243803 & 545.028703727482 \tabularnewline
Trimmed Mean ( 1 / 24 ) & 110.215142857143 & 0.359045303165121 & 306.967231949714 \tabularnewline
Trimmed Mean ( 2 / 24 ) & 110.230294117647 & 0.355394954627559 & 310.162799674982 \tabularnewline
Trimmed Mean ( 3 / 24 ) & 110.243787878788 & 0.351615768595512 & 313.53482330768 \tabularnewline
Trimmed Mean ( 4 / 24 ) & 110.259375 & 0.347704766879481 & 317.106308290037 \tabularnewline
Trimmed Mean ( 5 / 24 ) & 110.275322580645 & 0.343959948548206 & 320.605125817984 \tabularnewline
Trimmed Mean ( 6 / 24 ) & 110.288666666667 & 0.340125804796567 & 324.258451171124 \tabularnewline
Trimmed Mean ( 7 / 24 ) & 110.300862068966 & 0.335920715994003 & 328.35385499397 \tabularnewline
Trimmed Mean ( 8 / 24 ) & 110.313392857143 & 0.331201205843697 & 333.070625682452 \tabularnewline
Trimmed Mean ( 9 / 24 ) & 110.325555555556 & 0.327170777189844 & 337.210910164932 \tabularnewline
Trimmed Mean ( 10 / 24 ) & 110.340384615385 & 0.322653959828866 & 341.977469217823 \tabularnewline
Trimmed Mean ( 11 / 24 ) & 110.358 & 0.317682166927376 & 347.384938435113 \tabularnewline
Trimmed Mean ( 12 / 24 ) & 110.377916666667 & 0.312890034374876 & 352.769038768496 \tabularnewline
Trimmed Mean ( 13 / 24 ) & 110.396304347826 & 0.309363903832928 & 356.849338206715 \tabularnewline
Trimmed Mean ( 14 / 24 ) & 110.415681818182 & 0.30574630519831 & 361.134966934646 \tabularnewline
Trimmed Mean ( 15 / 24 ) & 110.431428571429 & 0.302645434736891 & 364.887144811663 \tabularnewline
Trimmed Mean ( 16 / 24 ) & 110.448 & 0.299031170658915 & 369.352799431002 \tabularnewline
Trimmed Mean ( 17 / 24 ) & 110.462368421053 & 0.295263325878603 & 374.114760417177 \tabularnewline
Trimmed Mean ( 18 / 24 ) & 110.4775 & 0.291208313318888 & 379.376188615266 \tabularnewline
Trimmed Mean ( 19 / 24 ) & 110.489705882353 & 0.28696409723266 & 385.029719563739 \tabularnewline
Trimmed Mean ( 20 / 24 ) & 110.5040625 & 0.282330758388201 & 391.399304598823 \tabularnewline
Trimmed Mean ( 21 / 24 ) & 110.521 & 0.276956924324045 & 399.054835945132 \tabularnewline
Trimmed Mean ( 22 / 24 ) & 110.5325 & 0.271042288135398 & 407.80536779111 \tabularnewline
Trimmed Mean ( 23 / 24 ) & 110.553461538462 & 0.264119985733578 & 418.572874110248 \tabularnewline
Trimmed Mean ( 24 / 24 ) & 110.577916666667 & 0.253828638965223 & 435.640033045354 \tabularnewline
Median & 110.535 &  &  \tabularnewline
Midrange & 109.66 &  &  \tabularnewline
Midmean - Weighted Average at Xnp & 110.394324324324 &  &  \tabularnewline
Midmean - Weighted Average at X(n+1)p & 110.4775 &  &  \tabularnewline
Midmean - Empirical Distribution Function & 110.394324324324 &  &  \tabularnewline
Midmean - Empirical Distribution Function - Averaging & 110.4775 &  &  \tabularnewline
Midmean - Empirical Distribution Function - Interpolation & 110.4775 &  &  \tabularnewline
Midmean - Closest Observation & 110.394324324324 &  &  \tabularnewline
Midmean - True Basic - Statistics Graphics Toolkit & 110.4775 &  &  \tabularnewline
Midmean - MS Excel (old versions) & 110.462368421053 &  &  \tabularnewline
Number of observations & 72 &  &  \tabularnewline
\hline
\end{tabular}
%Source: https://freestatistics.org/blog/index.php?pk=163412&T=1

[TABLE]
[ROW][C]Central Tendency - Ungrouped Data[/C][/ROW]
[ROW][C]Measure[/C][C]Value[/C][C]S.E.[/C][C]Value/S.E.[/C][/ROW]
[ROW][C]Arithmetic Mean[/C][C]110.199722222222[/C][C]0.362265626149871[/C][C]304.195911142373[/C][/ROW]
[ROW][C]Geometric Mean[/C][C]110.157238592416[/C][C][/C][C][/C][/ROW]
[ROW][C]Harmonic Mean[/C][C]110.114561241567[/C][C][/C][C][/C][/ROW]
[ROW][C]Quadratic Mean[/C][C]110.241990915944[/C][C][/C][C][/C][/ROW]
[ROW][C]Winsorized Mean ( 1 / 24 )[/C][C]110.200833333333[/C][C]0.361980875929021[/C][C]304.438274675434[/C][/ROW]
[ROW][C]Winsorized Mean ( 2 / 24 )[/C][C]110.205555555556[/C][C]0.360809974354177[/C][C]305.439326484295[/C][/ROW]
[ROW][C]Winsorized Mean ( 3 / 24 )[/C][C]110.202222222222[/C][C]0.359041729205295[/C][C]306.934301107964[/C][/ROW]
[ROW][C]Winsorized Mean ( 4 / 24 )[/C][C]110.204444444444[/C][C]0.355832626297463[/C][C]309.708655980066[/C][/ROW]
[ROW][C]Winsorized Mean ( 5 / 24 )[/C][C]110.219722222222[/C][C]0.352928945899546[/C][C]312.300035184969[/C][/ROW]
[ROW][C]Winsorized Mean ( 6 / 24 )[/C][C]110.229722222222[/C][C]0.350507678540784[/C][C]314.485898514764[/C][/ROW]
[ROW][C]Winsorized Mean ( 7 / 24 )[/C][C]110.232638888889[/C][C]0.347993353025913[/C][C]316.766506976013[/C][/ROW]
[ROW][C]Winsorized Mean ( 8 / 24 )[/C][C]110.240416666667[/C][C]0.339575556522605[/C][C]324.641790462112[/C][/ROW]
[ROW][C]Winsorized Mean ( 9 / 24 )[/C][C]110.229166666667[/C][C]0.336237800914313[/C][C]327.830976668674[/C][/ROW]
[ROW][C]Winsorized Mean ( 10 / 24 )[/C][C]110.218055555556[/C][C]0.331906372840469[/C][C]332.075743566792[/C][/ROW]
[ROW][C]Winsorized Mean ( 11 / 24 )[/C][C]110.211944444444[/C][C]0.323768138439017[/C][C]340.403922930184[/C][/ROW]
[ROW][C]Winsorized Mean ( 12 / 24 )[/C][C]110.236944444444[/C][C]0.310314699602001[/C][C]355.242418698923[/C][/ROW]
[ROW][C]Winsorized Mean ( 13 / 24 )[/C][C]110.242361111111[/C][C]0.303985555640671[/C][C]362.656577148107[/C][/ROW]
[ROW][C]Winsorized Mean ( 14 / 24 )[/C][C]110.287083333333[/C][C]0.294542923100375[/C][C]374.434673807286[/C][/ROW]
[ROW][C]Winsorized Mean ( 15 / 24 )[/C][C]110.293333333333[/C][C]0.289908382268513[/C][C]380.442029548424[/C][/ROW]
[ROW][C]Winsorized Mean ( 16 / 24 )[/C][C]110.326666666667[/C][C]0.2828608321971[/C][C]390.038683722[/C][/ROW]
[ROW][C]Winsorized Mean ( 17 / 24 )[/C][C]110.33375[/C][C]0.275700235075164[/C][C]400.194617062694[/C][/ROW]
[ROW][C]Winsorized Mean ( 18 / 24 )[/C][C]110.37375[/C][C]0.267645024345906[/C][C]412.388574268253[/C][/ROW]
[ROW][C]Winsorized Mean ( 19 / 24 )[/C][C]110.368472222222[/C][C]0.259531875111392[/C][C]425.259795833756[/C][/ROW]
[ROW][C]Winsorized Mean ( 20 / 24 )[/C][C]110.362916666667[/C][C]0.251854035705708[/C][C]438.20189879993[/C][/ROW]
[ROW][C]Winsorized Mean ( 21 / 24 )[/C][C]110.427083333333[/C][C]0.242698657597943[/C][C]454.996679529509[/C][/ROW]
[ROW][C]Winsorized Mean ( 22 / 24 )[/C][C]110.365972222222[/C][C]0.233024498812969[/C][C]473.623901282605[/C][/ROW]
[ROW][C]Winsorized Mean ( 23 / 24 )[/C][C]110.365972222222[/C][C]0.228707812901972[/C][C]482.563191968991[/C][/ROW]
[ROW][C]Winsorized Mean ( 24 / 24 )[/C][C]110.362638888889[/C][C]0.202489590243803[/C][C]545.028703727482[/C][/ROW]
[ROW][C]Trimmed Mean ( 1 / 24 )[/C][C]110.215142857143[/C][C]0.359045303165121[/C][C]306.967231949714[/C][/ROW]
[ROW][C]Trimmed Mean ( 2 / 24 )[/C][C]110.230294117647[/C][C]0.355394954627559[/C][C]310.162799674982[/C][/ROW]
[ROW][C]Trimmed Mean ( 3 / 24 )[/C][C]110.243787878788[/C][C]0.351615768595512[/C][C]313.53482330768[/C][/ROW]
[ROW][C]Trimmed Mean ( 4 / 24 )[/C][C]110.259375[/C][C]0.347704766879481[/C][C]317.106308290037[/C][/ROW]
[ROW][C]Trimmed Mean ( 5 / 24 )[/C][C]110.275322580645[/C][C]0.343959948548206[/C][C]320.605125817984[/C][/ROW]
[ROW][C]Trimmed Mean ( 6 / 24 )[/C][C]110.288666666667[/C][C]0.340125804796567[/C][C]324.258451171124[/C][/ROW]
[ROW][C]Trimmed Mean ( 7 / 24 )[/C][C]110.300862068966[/C][C]0.335920715994003[/C][C]328.35385499397[/C][/ROW]
[ROW][C]Trimmed Mean ( 8 / 24 )[/C][C]110.313392857143[/C][C]0.331201205843697[/C][C]333.070625682452[/C][/ROW]
[ROW][C]Trimmed Mean ( 9 / 24 )[/C][C]110.325555555556[/C][C]0.327170777189844[/C][C]337.210910164932[/C][/ROW]
[ROW][C]Trimmed Mean ( 10 / 24 )[/C][C]110.340384615385[/C][C]0.322653959828866[/C][C]341.977469217823[/C][/ROW]
[ROW][C]Trimmed Mean ( 11 / 24 )[/C][C]110.358[/C][C]0.317682166927376[/C][C]347.384938435113[/C][/ROW]
[ROW][C]Trimmed Mean ( 12 / 24 )[/C][C]110.377916666667[/C][C]0.312890034374876[/C][C]352.769038768496[/C][/ROW]
[ROW][C]Trimmed Mean ( 13 / 24 )[/C][C]110.396304347826[/C][C]0.309363903832928[/C][C]356.849338206715[/C][/ROW]
[ROW][C]Trimmed Mean ( 14 / 24 )[/C][C]110.415681818182[/C][C]0.30574630519831[/C][C]361.134966934646[/C][/ROW]
[ROW][C]Trimmed Mean ( 15 / 24 )[/C][C]110.431428571429[/C][C]0.302645434736891[/C][C]364.887144811663[/C][/ROW]
[ROW][C]Trimmed Mean ( 16 / 24 )[/C][C]110.448[/C][C]0.299031170658915[/C][C]369.352799431002[/C][/ROW]
[ROW][C]Trimmed Mean ( 17 / 24 )[/C][C]110.462368421053[/C][C]0.295263325878603[/C][C]374.114760417177[/C][/ROW]
[ROW][C]Trimmed Mean ( 18 / 24 )[/C][C]110.4775[/C][C]0.291208313318888[/C][C]379.376188615266[/C][/ROW]
[ROW][C]Trimmed Mean ( 19 / 24 )[/C][C]110.489705882353[/C][C]0.28696409723266[/C][C]385.029719563739[/C][/ROW]
[ROW][C]Trimmed Mean ( 20 / 24 )[/C][C]110.5040625[/C][C]0.282330758388201[/C][C]391.399304598823[/C][/ROW]
[ROW][C]Trimmed Mean ( 21 / 24 )[/C][C]110.521[/C][C]0.276956924324045[/C][C]399.054835945132[/C][/ROW]
[ROW][C]Trimmed Mean ( 22 / 24 )[/C][C]110.5325[/C][C]0.271042288135398[/C][C]407.80536779111[/C][/ROW]
[ROW][C]Trimmed Mean ( 23 / 24 )[/C][C]110.553461538462[/C][C]0.264119985733578[/C][C]418.572874110248[/C][/ROW]
[ROW][C]Trimmed Mean ( 24 / 24 )[/C][C]110.577916666667[/C][C]0.253828638965223[/C][C]435.640033045354[/C][/ROW]
[ROW][C]Median[/C][C]110.535[/C][C][/C][C][/C][/ROW]
[ROW][C]Midrange[/C][C]109.66[/C][C][/C][C][/C][/ROW]
[ROW][C]Midmean - Weighted Average at Xnp[/C][C]110.394324324324[/C][C][/C][C][/C][/ROW]
[ROW][C]Midmean - Weighted Average at X(n+1)p[/C][C]110.4775[/C][C][/C][C][/C][/ROW]
[ROW][C]Midmean - Empirical Distribution Function[/C][C]110.394324324324[/C][C][/C][C][/C][/ROW]
[ROW][C]Midmean - Empirical Distribution Function - Averaging[/C][C]110.4775[/C][C][/C][C][/C][/ROW]
[ROW][C]Midmean - Empirical Distribution Function - Interpolation[/C][C]110.4775[/C][C][/C][C][/C][/ROW]
[ROW][C]Midmean - Closest Observation[/C][C]110.394324324324[/C][C][/C][C][/C][/ROW]
[ROW][C]Midmean - True Basic - Statistics Graphics Toolkit[/C][C]110.4775[/C][C][/C][C][/C][/ROW]
[ROW][C]Midmean - MS Excel (old versions)[/C][C]110.462368421053[/C][C][/C][C][/C][/ROW]
[ROW][C]Number of observations[/C][C]72[/C][C][/C][C][/C][/ROW]
[/TABLE]
Source: https://freestatistics.org/blog/index.php?pk=163412&T=1

Globally Unique Identifier (entire table): ba.freestatistics.org/blog/index.php?pk=163412&T=1

As an alternative you can also use a QR Code:  

The GUIDs for individual cells are displayed in the table below:

Central Tendency - Ungrouped Data
MeasureValueS.E.Value/S.E.
Arithmetic Mean110.1997222222220.362265626149871304.195911142373
Geometric Mean110.157238592416
Harmonic Mean110.114561241567
Quadratic Mean110.241990915944
Winsorized Mean ( 1 / 24 )110.2008333333330.361980875929021304.438274675434
Winsorized Mean ( 2 / 24 )110.2055555555560.360809974354177305.439326484295
Winsorized Mean ( 3 / 24 )110.2022222222220.359041729205295306.934301107964
Winsorized Mean ( 4 / 24 )110.2044444444440.355832626297463309.708655980066
Winsorized Mean ( 5 / 24 )110.2197222222220.352928945899546312.300035184969
Winsorized Mean ( 6 / 24 )110.2297222222220.350507678540784314.485898514764
Winsorized Mean ( 7 / 24 )110.2326388888890.347993353025913316.766506976013
Winsorized Mean ( 8 / 24 )110.2404166666670.339575556522605324.641790462112
Winsorized Mean ( 9 / 24 )110.2291666666670.336237800914313327.830976668674
Winsorized Mean ( 10 / 24 )110.2180555555560.331906372840469332.075743566792
Winsorized Mean ( 11 / 24 )110.2119444444440.323768138439017340.403922930184
Winsorized Mean ( 12 / 24 )110.2369444444440.310314699602001355.242418698923
Winsorized Mean ( 13 / 24 )110.2423611111110.303985555640671362.656577148107
Winsorized Mean ( 14 / 24 )110.2870833333330.294542923100375374.434673807286
Winsorized Mean ( 15 / 24 )110.2933333333330.289908382268513380.442029548424
Winsorized Mean ( 16 / 24 )110.3266666666670.2828608321971390.038683722
Winsorized Mean ( 17 / 24 )110.333750.275700235075164400.194617062694
Winsorized Mean ( 18 / 24 )110.373750.267645024345906412.388574268253
Winsorized Mean ( 19 / 24 )110.3684722222220.259531875111392425.259795833756
Winsorized Mean ( 20 / 24 )110.3629166666670.251854035705708438.20189879993
Winsorized Mean ( 21 / 24 )110.4270833333330.242698657597943454.996679529509
Winsorized Mean ( 22 / 24 )110.3659722222220.233024498812969473.623901282605
Winsorized Mean ( 23 / 24 )110.3659722222220.228707812901972482.563191968991
Winsorized Mean ( 24 / 24 )110.3626388888890.202489590243803545.028703727482
Trimmed Mean ( 1 / 24 )110.2151428571430.359045303165121306.967231949714
Trimmed Mean ( 2 / 24 )110.2302941176470.355394954627559310.162799674982
Trimmed Mean ( 3 / 24 )110.2437878787880.351615768595512313.53482330768
Trimmed Mean ( 4 / 24 )110.2593750.347704766879481317.106308290037
Trimmed Mean ( 5 / 24 )110.2753225806450.343959948548206320.605125817984
Trimmed Mean ( 6 / 24 )110.2886666666670.340125804796567324.258451171124
Trimmed Mean ( 7 / 24 )110.3008620689660.335920715994003328.35385499397
Trimmed Mean ( 8 / 24 )110.3133928571430.331201205843697333.070625682452
Trimmed Mean ( 9 / 24 )110.3255555555560.327170777189844337.210910164932
Trimmed Mean ( 10 / 24 )110.3403846153850.322653959828866341.977469217823
Trimmed Mean ( 11 / 24 )110.3580.317682166927376347.384938435113
Trimmed Mean ( 12 / 24 )110.3779166666670.312890034374876352.769038768496
Trimmed Mean ( 13 / 24 )110.3963043478260.309363903832928356.849338206715
Trimmed Mean ( 14 / 24 )110.4156818181820.30574630519831361.134966934646
Trimmed Mean ( 15 / 24 )110.4314285714290.302645434736891364.887144811663
Trimmed Mean ( 16 / 24 )110.4480.299031170658915369.352799431002
Trimmed Mean ( 17 / 24 )110.4623684210530.295263325878603374.114760417177
Trimmed Mean ( 18 / 24 )110.47750.291208313318888379.376188615266
Trimmed Mean ( 19 / 24 )110.4897058823530.28696409723266385.029719563739
Trimmed Mean ( 20 / 24 )110.50406250.282330758388201391.399304598823
Trimmed Mean ( 21 / 24 )110.5210.276956924324045399.054835945132
Trimmed Mean ( 22 / 24 )110.53250.271042288135398407.80536779111
Trimmed Mean ( 23 / 24 )110.5534615384620.264119985733578418.572874110248
Trimmed Mean ( 24 / 24 )110.5779166666670.253828638965223435.640033045354
Median110.535
Midrange109.66
Midmean - Weighted Average at Xnp110.394324324324
Midmean - Weighted Average at X(n+1)p110.4775
Midmean - Empirical Distribution Function110.394324324324
Midmean - Empirical Distribution Function - Averaging110.4775
Midmean - Empirical Distribution Function - Interpolation110.4775
Midmean - Closest Observation110.394324324324
Midmean - True Basic - Statistics Graphics Toolkit110.4775
Midmean - MS Excel (old versions)110.462368421053
Number of observations72


Parameters (Session):
Parameters (R input):
R code (references can be found in the software module):
geomean <- function(x) {
return(exp(mean(log(x))))
}
harmean <- function(x) {
return(1/mean(1/x))
}
quamean <- function(x) {
return(sqrt(mean(x*x)))
}
winmean <- function(x) {
x <-sort(x[!is.na(x)])
n<-length(x)
denom <- 3
nodenom <- n/denom
if (nodenom>40) denom <- n/40
sqrtn = sqrt(n)
roundnodenom = floor(nodenom)
win <- array(NA,dim=c(roundnodenom,2))
for (j in 1:roundnodenom) {
win[j,1] <- (j*x[j+1]+sum(x[(j+1):(n-j)])+j*x[n-j])/n
win[j,2] <- sd(c(rep(x[j+1],j),x[(j+1):(n-j)],rep(x[n-j],j)))/sqrtn
}
return(win)
}
trimean <- function(x) {
x <-sort(x[!is.na(x)])
n<-length(x)
denom <- 3
nodenom <- n/denom
if (nodenom>40) denom <- n/40
sqrtn = sqrt(n)
roundnodenom = floor(nodenom)
tri <- array(NA,dim=c(roundnodenom,2))
for (j in 1:roundnodenom) {
tri[j,1] <- mean(x,trim=j/n)
tri[j,2] <- sd(x[(j+1):(n-j)]) / sqrt(n-j*2)
}
return(tri)
}
midrange <- function(x) {
return((max(x)+min(x))/2)
}
q1 <- function(data,n,p,i,f) {
np <- n*p;
i <<- floor(np)
f <<- np - i
qvalue <- (1-f)*data[i] + f*data[i+1]
}
q2 <- function(data,n,p,i,f) {
np <- (n+1)*p
i <<- floor(np)
f <<- np - i
qvalue <- (1-f)*data[i] + f*data[i+1]
}
q3 <- function(data,n,p,i,f) {
np <- n*p
i <<- floor(np)
f <<- np - i
if (f==0) {
qvalue <- data[i]
} else {
qvalue <- data[i+1]
}
}
q4 <- function(data,n,p,i,f) {
np <- n*p
i <<- floor(np)
f <<- np - i
if (f==0) {
qvalue <- (data[i]+data[i+1])/2
} else {
qvalue <- data[i+1]
}
}
q5 <- function(data,n,p,i,f) {
np <- (n-1)*p
i <<- floor(np)
f <<- np - i
if (f==0) {
qvalue <- data[i+1]
} else {
qvalue <- data[i+1] + f*(data[i+2]-data[i+1])
}
}
q6 <- function(data,n,p,i,f) {
np <- n*p+0.5
i <<- floor(np)
f <<- np - i
qvalue <- data[i]
}
q7 <- function(data,n,p,i,f) {
np <- (n+1)*p
i <<- floor(np)
f <<- np - i
if (f==0) {
qvalue <- data[i]
} else {
qvalue <- f*data[i] + (1-f)*data[i+1]
}
}
q8 <- function(data,n,p,i,f) {
np <- (n+1)*p
i <<- floor(np)
f <<- np - i
if (f==0) {
qvalue <- data[i]
} else {
if (f == 0.5) {
qvalue <- (data[i]+data[i+1])/2
} else {
if (f < 0.5) {
qvalue <- data[i]
} else {
qvalue <- data[i+1]
}
}
}
}
midmean <- function(x,def) {
x <-sort(x[!is.na(x)])
n<-length(x)
if (def==1) {
qvalue1 <- q1(x,n,0.25,i,f)
qvalue3 <- q1(x,n,0.75,i,f)
}
if (def==2) {
qvalue1 <- q2(x,n,0.25,i,f)
qvalue3 <- q2(x,n,0.75,i,f)
}
if (def==3) {
qvalue1 <- q3(x,n,0.25,i,f)
qvalue3 <- q3(x,n,0.75,i,f)
}
if (def==4) {
qvalue1 <- q4(x,n,0.25,i,f)
qvalue3 <- q4(x,n,0.75,i,f)
}
if (def==5) {
qvalue1 <- q5(x,n,0.25,i,f)
qvalue3 <- q5(x,n,0.75,i,f)
}
if (def==6) {
qvalue1 <- q6(x,n,0.25,i,f)
qvalue3 <- q6(x,n,0.75,i,f)
}
if (def==7) {
qvalue1 <- q7(x,n,0.25,i,f)
qvalue3 <- q7(x,n,0.75,i,f)
}
if (def==8) {
qvalue1 <- q8(x,n,0.25,i,f)
qvalue3 <- q8(x,n,0.75,i,f)
}
midm <- 0
myn <- 0
roundno4 <- round(n/4)
round3no4 <- round(3*n/4)
for (i in 1:n) {
if ((x[i]>=qvalue1) & (x[i]<=qvalue3)){
midm = midm + x[i]
myn = myn + 1
}
}
midm = midm / myn
return(midm)
}
(arm <- mean(x))
sqrtn <- sqrt(length(x))
(armse <- sd(x) / sqrtn)
(armose <- arm / armse)
(geo <- geomean(x))
(har <- harmean(x))
(qua <- quamean(x))
(win <- winmean(x))
(tri <- trimean(x))
(midr <- midrange(x))
midm <- array(NA,dim=8)
for (j in 1:8) midm[j] <- midmean(x,j)
midm
bitmap(file='test1.png')
lb <- win[,1] - 2*win[,2]
ub <- win[,1] + 2*win[,2]
if ((ylimmin == '') | (ylimmax == '')) plot(win[,1],type='b',main=main, xlab='j', pch=19, ylab='Winsorized Mean(j/n)', ylim=c(min(lb),max(ub))) else plot(win[,1],type='l',main=main, xlab='j', pch=19, ylab='Winsorized Mean(j/n)', ylim=c(ylimmin,ylimmax))
lines(ub,lty=3)
lines(lb,lty=3)
grid()
dev.off()
bitmap(file='test2.png')
lb <- tri[,1] - 2*tri[,2]
ub <- tri[,1] + 2*tri[,2]
if ((ylimmin == '') | (ylimmax == '')) plot(tri[,1],type='b',main=main, xlab='j', pch=19, ylab='Trimmed Mean(j/n)', ylim=c(min(lb),max(ub))) else plot(tri[,1],type='l',main=main, xlab='j', pch=19, ylab='Trimmed Mean(j/n)', ylim=c(ylimmin,ylimmax))
lines(ub,lty=3)
lines(lb,lty=3)
grid()
dev.off()
load(file='createtable')
a<-table.start()
a<-table.row.start(a)
a<-table.element(a,'Central Tendency - Ungrouped Data',4,TRUE)
a<-table.row.end(a)
a<-table.row.start(a)
a<-table.element(a,'Measure',header=TRUE)
a<-table.element(a,'Value',header=TRUE)
a<-table.element(a,'S.E.',header=TRUE)
a<-table.element(a,'Value/S.E.',header=TRUE)
a<-table.row.end(a)
a<-table.row.start(a)
a<-table.element(a,hyperlink('arithmetic_mean.htm', 'Arithmetic Mean', 'click to view the definition of the Arithmetic Mean'),header=TRUE)
a<-table.element(a,arm)
a<-table.element(a,hyperlink('arithmetic_mean_standard_error.htm', armse, 'click to view the definition of the Standard Error of the Arithmetic Mean'))
a<-table.element(a,armose)
a<-table.row.end(a)
a<-table.row.start(a)
a<-table.element(a,hyperlink('geometric_mean.htm', 'Geometric Mean', 'click to view the definition of the Geometric Mean'),header=TRUE)
a<-table.element(a,geo)
a<-table.element(a,'')
a<-table.row.end(a)
a<-table.row.start(a)
a<-table.element(a,hyperlink('harmonic_mean.htm', 'Harmonic Mean', 'click to view the definition of the Harmonic Mean'),header=TRUE)
a<-table.element(a,har)
a<-table.element(a,'')
a<-table.row.end(a)
a<-table.row.start(a)
a<-table.element(a,hyperlink('quadratic_mean.htm', 'Quadratic Mean', 'click to view the definition of the Quadratic Mean'),header=TRUE)
a<-table.element(a,qua)
a<-table.element(a,'')
a<-table.row.end(a)
for (j in 1:length(win[,1])) {
a<-table.row.start(a)
mylabel <- paste('Winsorized Mean (',j)
mylabel <- paste(mylabel,'/')
mylabel <- paste(mylabel,length(win[,1]))
mylabel <- paste(mylabel,')')
a<-table.element(a,hyperlink('winsorized_mean.htm', mylabel, 'click to view the definition of the Winsorized Mean'),header=TRUE)
a<-table.element(a,win[j,1])
a<-table.element(a,win[j,2])
a<-table.element(a,win[j,1]/win[j,2])
a<-table.row.end(a)
}
for (j in 1:length(tri[,1])) {
a<-table.row.start(a)
mylabel <- paste('Trimmed Mean (',j)
mylabel <- paste(mylabel,'/')
mylabel <- paste(mylabel,length(tri[,1]))
mylabel <- paste(mylabel,')')
a<-table.element(a,hyperlink('arithmetic_mean.htm', mylabel, 'click to view the definition of the Trimmed Mean'),header=TRUE)
a<-table.element(a,tri[j,1])
a<-table.element(a,tri[j,2])
a<-table.element(a,tri[j,1]/tri[j,2])
a<-table.row.end(a)
}
a<-table.row.start(a)
a<-table.element(a,hyperlink('median_1.htm', 'Median', 'click to view the definition of the Median'),header=TRUE)
a<-table.element(a,median(x))
a<-table.element(a,'')
a<-table.row.end(a)
a<-table.row.start(a)
a<-table.element(a,hyperlink('midrange.htm', 'Midrange', 'click to view the definition of the Midrange'),header=TRUE)
a<-table.element(a,midr)
a<-table.element(a,'')
a<-table.row.end(a)
a<-table.row.start(a)
mymid <- hyperlink('midmean.htm', 'Midmean', 'click to view the definition of the Midmean')
mylabel <- paste(mymid,hyperlink('method_1.htm','Weighted Average at Xnp',''),sep=' - ')
a<-table.element(a,mylabel,header=TRUE)
a<-table.element(a,midm[1])
a<-table.element(a,'')
a<-table.row.end(a)
a<-table.row.start(a)
mymid <- hyperlink('midmean.htm', 'Midmean', 'click to view the definition of the Midmean')
mylabel <- paste(mymid,hyperlink('method_2.htm','Weighted Average at X(n+1)p',''),sep=' - ')
a<-table.element(a,mylabel,header=TRUE)
a<-table.element(a,midm[2])
a<-table.element(a,'')
a<-table.row.end(a)
a<-table.row.start(a)
mymid <- hyperlink('midmean.htm', 'Midmean', 'click to view the definition of the Midmean')
mylabel <- paste(mymid,hyperlink('method_3.htm','Empirical Distribution Function',''),sep=' - ')
a<-table.element(a,mylabel,header=TRUE)
a<-table.element(a,midm[3])
a<-table.element(a,'')
a<-table.row.end(a)
a<-table.row.start(a)
mymid <- hyperlink('midmean.htm', 'Midmean', 'click to view the definition of the Midmean')
mylabel <- paste(mymid,hyperlink('method_4.htm','Empirical Distribution Function - Averaging',''),sep=' - ')
a<-table.element(a,mylabel,header=TRUE)
a<-table.element(a,midm[4])
a<-table.element(a,'')
a<-table.row.end(a)
a<-table.row.start(a)
mymid <- hyperlink('midmean.htm', 'Midmean', 'click to view the definition of the Midmean')
mylabel <- paste(mymid,hyperlink('method_5.htm','Empirical Distribution Function - Interpolation',''),sep=' - ')
a<-table.element(a,mylabel,header=TRUE)
a<-table.element(a,midm[5])
a<-table.element(a,'')
a<-table.row.end(a)
a<-table.row.start(a)
mymid <- hyperlink('midmean.htm', 'Midmean', 'click to view the definition of the Midmean')
mylabel <- paste(mymid,hyperlink('method_6.htm','Closest Observation',''),sep=' - ')
a<-table.element(a,mylabel,header=TRUE)
a<-table.element(a,midm[6])
a<-table.element(a,'')
a<-table.row.end(a)
a<-table.row.start(a)
mymid <- hyperlink('midmean.htm', 'Midmean', 'click to view the definition of the Midmean')
mylabel <- paste(mymid,hyperlink('method_7.htm','True Basic - Statistics Graphics Toolkit',''),sep=' - ')
a<-table.element(a,mylabel,header=TRUE)
a<-table.element(a,midm[7])
a<-table.element(a,'')
a<-table.row.end(a)
a<-table.row.start(a)
mymid <- hyperlink('midmean.htm', 'Midmean', 'click to view the definition of the Midmean')
mylabel <- paste(mymid,hyperlink('method_8.htm','MS Excel (old versions)',''),sep=' - ')
a<-table.element(a,mylabel,header=TRUE)
a<-table.element(a,midm[8])
a<-table.element(a,'')
a<-table.row.end(a)
a<-table.row.start(a)
a<-table.element(a,'Number of observations',header=TRUE)
a<-table.element(a,length(x))
a<-table.element(a,'')
a<-table.row.end(a)
a<-table.end(a)
table.save(a,file='mytable.tab')