| Multiple Linear Regression - Estimated Regression Equation |
| ROOST[t] = + 1216.30105935626 -1.14986374246476DATE[t] + 1.84379630208954rTEMP[t] -16.925537745985RAIN[t] + e[t] |
| Multiple Linear Regression - Ordinary Least Squares | |||||
| Variable | Parameter | S.D. | T-STAT H0: parameter = 0 | 2-tail p-value | 1-tail p-value |
| (Intercept) | 1216.30105935626 | 3.394148 | 358.3524 | 0 | 0 |
| DATE | -1.14986374246476 | 0.154537 | -7.4407 | 0 | 0 |
| rTEMP | 1.84379630208954 | 0.320515 | 5.7526 | 6e-06 | 3e-06 |
| RAIN | -16.925537745985 | 3.8792 | -4.3632 | 0.00021 | 0.000105 |
| Multiple Linear Regression - Regression Statistics | |
| Multiple R | 0.898981772354654 |
| R-squared | 0.808168227025915 |
| Adjusted R-squared | 0.784189255404154 |
| F-TEST (value) | 33.7032062831465 |
| F-TEST (DF numerator) | 3 |
| F-TEST (DF denominator) | 24 |
| p-value | 9.07744379663455e-09 |
| Multiple Linear Regression - Residual Statistics | |
| Residual Standard Deviation | 6.84095564604744 |
| Sum Squared Residuals | 1123.16817962852 |
| Multiple Linear Regression - Actuals, Interpolation, and Residuals | |||
| Time or Index | Actuals | Interpolation Forecast | Residuals Prediction Error |
| 1 | 1192 | 1201.837590561 | -9.83759056099715 |
| 2 | 1196 | 1189.12468623754 | 6.87531376245509 |
| 3 | 1174 | 1181.04546723257 | -7.04546723256724 |
| 4 | 1183 | 1199.11076748402 | -16.1107674840223 |
| 5 | 1210 | 1203.32340090655 | 6.67659909344527 |
| 6 | 1210 | 1207.53621870872 | 2.4637812912826 |
| 7 | 1218 | 1207.65156798875 | 10.3484320112535 |
| 8 | 1219 | 1214.93725670797 | 4.06274329202841 |
| 9 | 1215 | 1219.15007451013 | -4.15007451013427 |
| 10 | 1206 | 1207.99780020846 | -1.99780020846396 |
| 11 | 1202 | 1192.74824176429 | 9.25175823570973 |
| 12 | 1195 | 1192.86359104432 | 2.13640895568064 |
| 13 | 1203 | 1200.14927976354 | 2.85072023645553 |
| 14 | 1194 | 1195.14311605526 | -1.14311605525943 |
| 15 | 1170 | 1175.25987229261 | -5.25987229261089 |
| 16 | 1189 | 1183.56997423728 | 5.43002576272305 |
| 17 | 1199 | 1196.51357712079 | 2.48642287921235 |
| 18 | 1196 | 1198.6777528517 | -2.67775285169863 |
| 19 | 1189 | 1184.45242325334 | 4.54757674666431 |
| 20 | 1185 | 1194.92651654928 | -9.92651654928251 |
| 21 | 1192 | 1187.87171076975 | 4.12828923025421 |
| 22 | 1188 | 1182.86536268183 | 5.13463731816945 |
| 23 | 1176 | 1178.88342781936 | -2.88342781935626 |
| 24 | 1177 | 1170.91955809441 | 6.08044190559232 |
| 25 | 1166 | 1165.91339438612 | 0.0866056138773541 |
| 26 | 1176 | 1177.29636724785 | -1.29636724785113 |
| 27 | 1181 | 1181.50918505001 | -0.509185050013803 |
| 28 | 1176 | 1185.72181847255 | -9.72181847254627 |
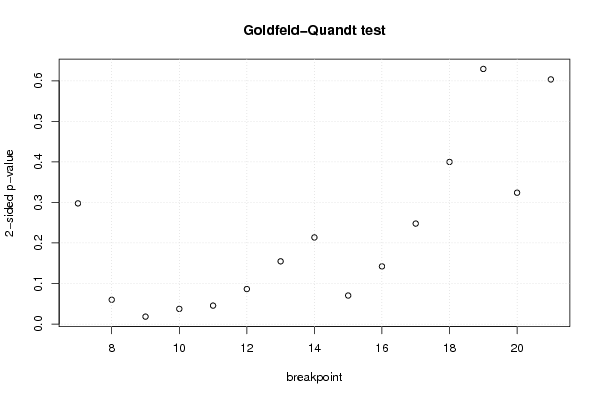
| Goldfeld-Quandt test for Heteroskedasticity | |||
| p-values | Alternative Hypothesis | ||
| breakpoint index | greater | 2-sided | less |
| 7 | 0.851222628800889 | 0.297554742398222 | 0.148777371199111 |
| 8 | 0.970083417719348 | 0.0598331645613036 | 0.0299165822806518 |
| 9 | 0.990909143980899 | 0.0181817120382029 | 0.00909085601910147 |
| 10 | 0.981337666091991 | 0.0373246678160174 | 0.0186623339080087 |
| 11 | 0.977276491965346 | 0.0454470160693085 | 0.0227235080346543 |
| 12 | 0.956859425441181 | 0.0862811491176384 | 0.0431405745588192 |
| 13 | 0.922685436250121 | 0.154629127499757 | 0.0773145637498786 |
| 14 | 0.893220842615256 | 0.213558314769488 | 0.106779157384744 |
| 15 | 0.964862529365719 | 0.0702749412685616 | 0.0351374706342808 |
| 16 | 0.928912171603919 | 0.142175656792162 | 0.0710878283960812 |
| 17 | 0.876135347600017 | 0.247729304799967 | 0.123864652399983 |
| 18 | 0.800119387423785 | 0.399761225152429 | 0.199880612576215 |
| 19 | 0.685451939066424 | 0.629096121867152 | 0.314548060933576 |
| 20 | 0.838095986182255 | 0.323808027635489 | 0.161904013817744 |
| 21 | 0.698359911508033 | 0.603280176983934 | 0.301640088491967 |
| Meta Analysis of Goldfeld-Quandt test for Heteroskedasticity | |||
| Description | # significant tests | % significant tests | OK/NOK |
| 1% type I error level | 0 | 0 | OK |
| 5% type I error level | 3 | 0.2 | NOK |
| 10% type I error level | 6 | 0.4 | NOK |