Free Statistics
of Irreproducible Research!
Description of Statistical Computation | ||||||||||||||||||||||||||||||
|---|---|---|---|---|---|---|---|---|---|---|---|---|---|---|---|---|---|---|---|---|---|---|---|---|---|---|---|---|---|---|
| Author's title | ||||||||||||||||||||||||||||||
| Author | *The author of this computation has been verified* | |||||||||||||||||||||||||||||
| R Software Module | rwasp_Distributional Plots.wasp | |||||||||||||||||||||||||||||
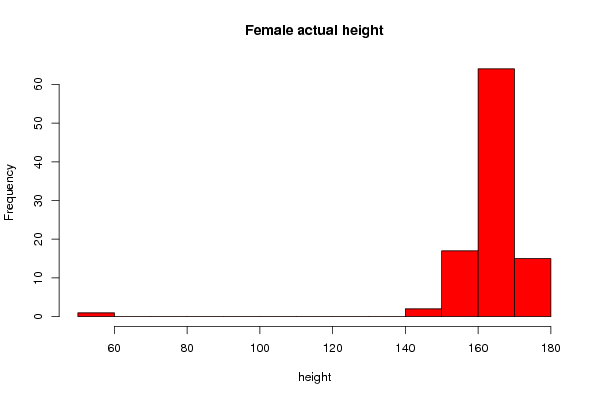
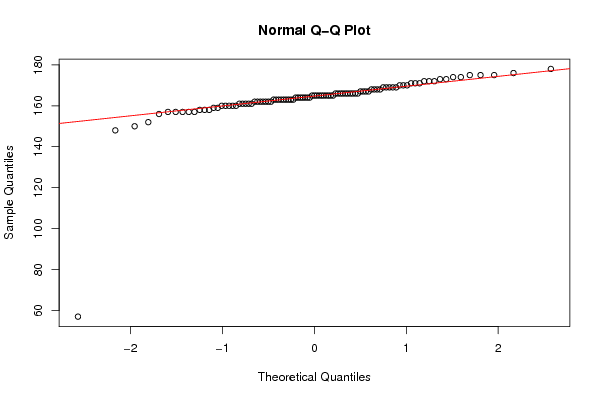
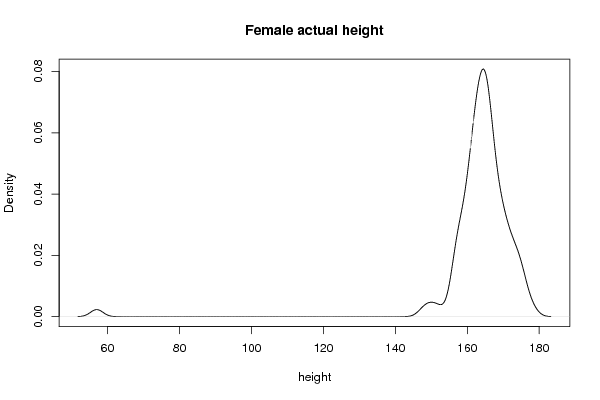
| Title produced by software | Histogram, QQplot and Density | |||||||||||||||||||||||||||||
| Date of computation | Fri, 01 Jun 2012 05:58:41 -0400 | |||||||||||||||||||||||||||||
| Cite this page as follows | Statistical Computations at FreeStatistics.org, Office for Research Development and Education, URL https://freestatistics.org/blog/index.php?v=date/2012/Jun/01/t1338544733zojojbvrh2s3aeh.htm/, Retrieved Wed, 01 May 2024 23:24:17 +0000 | |||||||||||||||||||||||||||||
| Statistical Computations at FreeStatistics.org, Office for Research Development and Education, URL https://freestatistics.org/blog/index.php?pk=168499, Retrieved Wed, 01 May 2024 23:24:17 +0000 | ||||||||||||||||||||||||||||||
| QR Codes: | ||||||||||||||||||||||||||||||
|
| ||||||||||||||||||||||||||||||
| Original text written by user: | ||||||||||||||||||||||||||||||
| IsPrivate? | No (this computation is public) | |||||||||||||||||||||||||||||
| User-defined keywords | ||||||||||||||||||||||||||||||
| Estimated Impact | 72 | |||||||||||||||||||||||||||||
Tree of Dependent Computations | ||||||||||||||||||||||||||||||
| Family? (F = Feedback message, R = changed R code, M = changed R Module, P = changed Parameters, D = changed Data) | ||||||||||||||||||||||||||||||
| - [Simple Linear Regression] [Triglyceridge Reg...] [2011-07-07 15:11:49] [74be16979710d4c4e7c6647856088456] - R [Simple Linear Regression] [Triglyceride] [2012-05-04 19:33:41] [98fd0e87c3eb04e0cc2efde01dbafab6] - RMPD [Histogram, QQplot and Density] [female actual height] [2012-06-01 09:58:41] [c3a1a4881a39c19cd8024386f5bb4813] [Current] | ||||||||||||||||||||||||||||||
| Feedback Forum | ||||||||||||||||||||||||||||||
Post a new message | ||||||||||||||||||||||||||||||
Dataset | ||||||||||||||||||||||||||||||
| Dataseries X: | ||||||||||||||||||||||||||||||
161 161 157 57 161 168 163 166 168 175 170 171 166 169 166 157 166 164 169 166 164 163 160 174 162 165 173 162 165 164 158 175 165 163 166 160 160 165 169 167 170 165 163 162 161 165 169 159 164 163 163 175 164 152 167 166 166 174 167 168 178 165 157 171 157 166 160 148 162 172 163 165 176 171 160 165 157 173 168 162 150 163 167 163 161 162 172 159 170 166 158 165 162 172 169 158 164 156 164 | ||||||||||||||||||||||||||||||
Tables (Output of Computation) | ||||||||||||||||||||||||||||||
| ||||||||||||||||||||||||||||||
Figures (Output of Computation) | ||||||||||||||||||||||||||||||
Input Parameters & R Code | ||||||||||||||||||||||||||||||
| Parameters (Session): | ||||||||||||||||||||||||||||||
| par1 = 10 ; | ||||||||||||||||||||||||||||||
| Parameters (R input): | ||||||||||||||||||||||||||||||
| par1 = 10 ; | ||||||||||||||||||||||||||||||
| R code (references can be found in the software module): | ||||||||||||||||||||||||||||||
par1 <- '10' | ||||||||||||||||||||||||||||||