Free Statistics

of Irreproducible Research!

Author's title

Author*The author of this computation has been verified*
R Software Modulerwasp_Simple Regression Y ~ X.wasp
Title produced by softwareSimple Linear Regression
Date of computationFri, 01 Jun 2012 04:53:59 -0400
Cite this page as followsStatistical Computations at FreeStatistics.org, Office for Research Development and Education, URL https://freestatistics.org/blog/index.php?v=date/2012/Jun/01/t1338540939zxvrg9yoabqht30.htm/, Retrieved Thu, 02 May 2024 08:58:01 +0000
Statistical Computations at FreeStatistics.org, Office for Research Development and Education, URL https://freestatistics.org/blog/index.php?pk=168234, Retrieved Thu, 02 May 2024 08:58:01 +0000
QR Codes:

Original text written by user:
IsPrivate?No (this computation is public)
User-defined keywords
Estimated Impact79
Family? (F = Feedback message, R = changed R code, M = changed R Module, P = changed Parameters, D = changed Data)
-       [Simple Linear Regression] [] [2012-06-01 08:53:59] [898f528db62d66cb4fd17f9b6ea3eb9d] [Current]
Feedback Forum

Post a new message
Dataseries X:
201	84.0	82.4	90	131	1.6	-41
202	88.8	87.0	137	82	1.8	55
203	87.0	81.8	182	152	5.2	30
204	84.5	80.4	72	72	4.1	0
205	69.4	69.0	143	126	0.4	17
206	104.7	102.0	96	157	2.7	-61
207	90.0	87.6	115	88	2.4	27
208	89.4	86.8	124	123	2.6	1
209	95.2	92.8	188	255	2.4	-67
210	108.1	100.9	167	87	7.2	80
211	93.9	90.2	143	213	3.7	-70
212	83.4	75.0	143	102	8.4	41
213	104.4	102.9	276	313	1.5	-37
214	103.7	95.7	84	84	8.0	0
215	99.2	99.2	142	135	0.0	7
216	95.6	88.5	64	114	7.1	-50
217	126.0	123.2	226	152	2.8	74
218	103.7	95.5	199	120	8.2	79
219	133.1	130.8	212	156	2.3	56
220	85.0	80.0	268	250	5.0	18
221	83.8	77.9	111	107	5.9	4
222	104.5	98.3	132	117	6.2	15
223	76.8	73.2	165	96	3.6	69
224	90.5	88.9	57	63	1.6	-6
225	106.9	103.7	163	131	3.2	32
226	81.5	78.9	111	54	2.6	57
227	96.5	94.9	300	241	1.6	59
228	103.0	97.2	192	124	5.8	68
229	127.5	124.7	176	215	2.8	-39
230	103.2	102.0	146	138	1.2	8
231	113.5	115.0	446	795	-1.5	-349
232	107.0	99.2	232	63	7.8	169
233	106.0	103.5	255	204	2.5	51
234	114.9	105.3	187	144	9.6	43
235	103.4	96.0	154	96	7.4	58


Summary of computational transaction
Raw Inputview raw input (R code)
Raw Outputview raw output of R engine
Computing time3 seconds
R Server'Gertrude Mary Cox' @ cox.wessa.net

\begin{tabular}{lllllllll}
\hline
Summary of computational transaction \tabularnewline
Raw Input & view raw input (R code)  \tabularnewline
Raw Output & view raw output of R engine  \tabularnewline
Computing time & 3 seconds \tabularnewline
R Server & 'Gertrude Mary Cox' @ cox.wessa.net \tabularnewline
\hline
\end{tabular}
%Source: https://freestatistics.org/blog/index.php?pk=168234&T=0

[TABLE]
[ROW][C]Summary of computational transaction[/C][/ROW]
[ROW][C]Raw Input[/C][C]view raw input (R code) [/C][/ROW]
[ROW][C]Raw Output[/C][C]view raw output of R engine [/C][/ROW]
[ROW][C]Computing time[/C][C]3 seconds[/C][/ROW]
[ROW][C]R Server[/C][C]'Gertrude Mary Cox' @ cox.wessa.net[/C][/ROW]
[/TABLE]
Source: https://freestatistics.org/blog/index.php?pk=168234&T=0

Globally Unique Identifier (entire table): ba.freestatistics.org/blog/index.php?pk=168234&T=0

As an alternative you can also use a QR Code:  

The GUIDs for individual cells are displayed in the table below:

Summary of computational transaction
Raw Inputview raw input (R code)
Raw Outputview raw output of R engine
Computing time3 seconds
R Server'Gertrude Mary Cox' @ cox.wessa.net


Linear Regression Model
Y ~ X
coefficients:
EstimateStd. Errort valuePr(>|t|)
(Intercept)-41.79221.464-1.9470.06
X13.5134.4873.0120.005
- - -
Residual Std. Err. 72.241 on 33 df
Multiple R-sq. 0.216
Adjusted R-sq. 0.192

\begin{tabular}{lllllllll}
\hline
Linear Regression Model \tabularnewline
Y ~ X \tabularnewline
coefficients: &   \tabularnewline
  & Estimate & Std. Error & t value & Pr(>|t|) \tabularnewline
(Intercept) & -41.792 & 21.464 & -1.947 & 0.06 \tabularnewline
X & 13.513 & 4.487 & 3.012 & 0.005 \tabularnewline
- - -  &   \tabularnewline
Residual Std. Err.  & 72.241  on  33 df \tabularnewline
Multiple R-sq.  & 0.216 \tabularnewline
Adjusted R-sq.  & 0.192 \tabularnewline
\hline
\end{tabular}
%Source: https://freestatistics.org/blog/index.php?pk=168234&T=1

[TABLE]
[ROW][C]Linear Regression Model[/C][/ROW]
[ROW][C]Y ~ X[/C][/ROW]
[ROW][C]coefficients:[/C][C] [/C][/ROW]
[ROW][C] [/C][C]Estimate[/C][C]Std. Error[/C][C]t value[/C][C]Pr(>|t|)[/C][/ROW]
[C](Intercept)[/C][C]-41.792[/C][C]21.464[/C][C]-1.947[/C][C]0.06[/C][/ROW]
[C]X[/C][C]13.513[/C][C]4.487[/C][C]3.012[/C][C]0.005[/C][/ROW]
[ROW][C]- - - [/C][C] [/C][/ROW]
[ROW][C]Residual Std. Err. [/C][C]72.241  on  33 df[/C][/ROW]
[ROW][C]Multiple R-sq. [/C][C]0.216[/C][/ROW]
[ROW][C]Adjusted R-sq. [/C][C]0.192[/C][/ROW]
[/TABLE]
Source: https://freestatistics.org/blog/index.php?pk=168234&T=1

Globally Unique Identifier (entire table): ba.freestatistics.org/blog/index.php?pk=168234&T=1

As an alternative you can also use a QR Code:  

The GUIDs for individual cells are displayed in the table below:

Linear Regression Model
Y ~ X
coefficients:
EstimateStd. Errort valuePr(>|t|)
(Intercept)-41.79221.464-1.9470.06
X13.5134.4873.0120.005
- - -
Residual Std. Err. 72.241 on 33 df
Multiple R-sq. 0.216
Adjusted R-sq. 0.192


ANOVA Statistics
DfSum SqMean SqF valuePr(>F)
DWT147340.68347340.6839.0710.005
Residuals33172221.4895218.833

\begin{tabular}{lllllllll}
\hline
ANOVA Statistics \tabularnewline
  & Df & Sum Sq & Mean Sq & F value & Pr(>F) \tabularnewline
DWT & 1 & 47340.683 & 47340.683 & 9.071 & 0.005 \tabularnewline
Residuals & 33 & 172221.489 & 5218.833 &   &   \tabularnewline
\hline
\end{tabular}
%Source: https://freestatistics.org/blog/index.php?pk=168234&T=2

[TABLE]
[ROW][C]ANOVA Statistics[/C][/ROW]
[ROW][C] [/C][C]Df[/C][C]Sum Sq[/C][C]Mean Sq[/C][C]F value[/C][C]Pr(>F)[/C][/ROW]
[ROW][C]DWT[/C][C]1[/C][C]47340.683[/C][C]47340.683[/C][C]9.071[/C][C]0.005[/C][/ROW]
[ROW][C]Residuals[/C][C]33[/C][C]172221.489[/C][C]5218.833[/C][C] [/C][C] [/C][/ROW]
[/TABLE]
Source: https://freestatistics.org/blog/index.php?pk=168234&T=2

Globally Unique Identifier (entire table): ba.freestatistics.org/blog/index.php?pk=168234&T=2

As an alternative you can also use a QR Code:  

The GUIDs for individual cells are displayed in the table below:

ANOVA Statistics
DfSum SqMean SqF valuePr(>F)
DWT147340.68347340.6839.0710.005
Residuals33172221.4895218.833


Parameters (Session):
par1 = 7 ; par2 = 6 ; par3 = TRUE ;
Parameters (R input):
par1 = 7 ; par2 = 6 ; par3 = TRUE ;
R code (references can be found in the software module):
cat1 <- as.numeric(par1)
cat2<- as.numeric(par2)
intercept<-as.logical(par3)
x <- t(x)
xdf<-data.frame(t(y))
(V1<-dimnames(y)[[1]][cat1])
(V2<-dimnames(y)[[1]][cat2])
xdf <- data.frame(xdf[[cat1]], xdf[[cat2]])
names(xdf)<-c('Y', 'X')
if(intercept == FALSE) (lmxdf<-lm(Y~ X - 1, data = xdf) ) else (lmxdf<-lm(Y~ X, data = xdf) )
sumlmxdf<-summary(lmxdf)
(aov.xdf<-aov(lmxdf) )
(anova.xdf<-anova(lmxdf) )
load(file='createtable')
a<-table.start()
nc <- ncol(sumlmxdf$'coefficients')
nr <- nrow(sumlmxdf$'coefficients')
a<-table.row.start(a)
a<-table.element(a,'Linear Regression Model', nc+1,TRUE)
a<-table.row.end(a)
a<-table.row.start(a)
a<-table.element(a, lmxdf$call['formula'],nc+1)
a<-table.row.end(a)
a<-table.row.start(a)
a<-table.element(a, 'coefficients:',1,TRUE)
a<-table.element(a, ' ',nc,TRUE)
a<-table.row.end(a)
a<-table.row.start(a)
a<-table.element(a, ' ',1,TRUE)
for(i in 1 : nc){
a<-table.element(a, dimnames(sumlmxdf$'coefficients')[[2]][i],1,TRUE)
}#end header
a<-table.row.end(a)
for(i in 1: nr){
a<-table.element(a,dimnames(sumlmxdf$'coefficients')[[1]][i] ,1,TRUE)
for(j in 1 : nc){
a<-table.element(a, round(sumlmxdf$coefficients[i, j], digits=3), 1 ,FALSE)
}
a<-table.row.end(a)
}
a<-table.row.start(a)
a<-table.element(a, '- - - ',1,TRUE)
a<-table.element(a, ' ',nc,FALSE)
a<-table.row.end(a)
a<-table.row.start(a)
a<-table.element(a, 'Residual Std. Err. ',1,TRUE)
a<-table.element(a, paste(round(sumlmxdf$'sigma', digits=3), ' on ', sumlmxdf$'df'[2], 'df') ,nc, FALSE)
a<-table.row.end(a)
a<-table.row.start(a)
a<-table.element(a, 'Multiple R-sq. ',1,TRUE)
a<-table.element(a, round(sumlmxdf$'r.squared', digits=3) ,nc, FALSE)
a<-table.row.end(a)
a<-table.row.start(a)
a<-table.element(a, 'Adjusted R-sq. ',1,TRUE)
a<-table.element(a, round(sumlmxdf$'adj.r.squared', digits=3) ,nc, FALSE)
a<-table.row.end(a)
a<-table.end(a)
table.save(a,file='mytable.tab')
a<-table.start()
a<-table.row.start(a)
a<-table.element(a,'ANOVA Statistics', 5+1,TRUE)
a<-table.row.end(a)
a<-table.row.start(a)
a<-table.element(a, ' ',1,TRUE)
a<-table.element(a, 'Df',1,TRUE)
a<-table.element(a, 'Sum Sq',1,TRUE)
a<-table.element(a, 'Mean Sq',1,TRUE)
a<-table.element(a, 'F value',1,TRUE)
a<-table.element(a, 'Pr(>F)',1,TRUE)
a<-table.row.end(a)
a<-table.row.start(a)
a<-table.element(a, V2,1,TRUE)
a<-table.element(a, anova.xdf$Df[1])
a<-table.element(a, round(anova.xdf$'Sum Sq'[1], digits=3))
a<-table.element(a, round(anova.xdf$'Mean Sq'[1], digits=3))
a<-table.element(a, round(anova.xdf$'F value'[1], digits=3))
a<-table.element(a, round(anova.xdf$'Pr(>F)'[1], digits=3))
a<-table.row.end(a)
a<-table.row.start(a)
a<-table.element(a, 'Residuals',1,TRUE)
a<-table.element(a, anova.xdf$Df[2])
a<-table.element(a, round(anova.xdf$'Sum Sq'[2], digits=3))
a<-table.element(a, round(anova.xdf$'Mean Sq'[2], digits=3))
a<-table.element(a, ' ')
a<-table.row.end(a)
a<-table.end(a)
table.save(a,file='mytable1.tab')
bitmap(file='regressionplot.png')
plot(Y~ X, data=xdf, xlab=V2, ylab=V1, main='Regression Solution')
if(intercept == TRUE) abline(coef(lmxdf), col='red')
if(intercept == FALSE) abline(0.0, coef(lmxdf), col='red')
dev.off()
library(car)
bitmap(file='residualsQQplot.png')
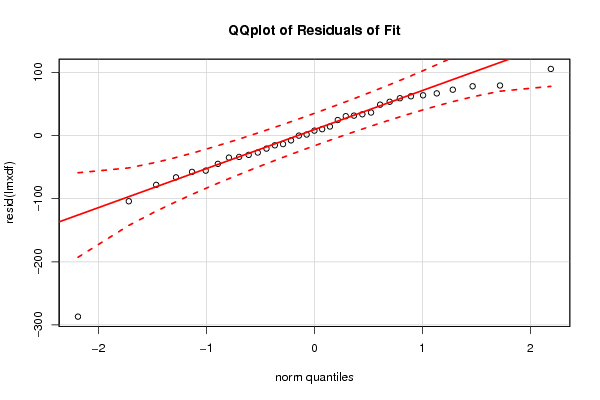
qq.plot(resid(lmxdf), main='QQplot of Residuals of Fit')
dev.off()
bitmap(file='residualsplot.png')
plot(xdf$X, resid(lmxdf), main='Scatterplot of Residuals of Model Fit')
dev.off()
bitmap(file='cooksDistanceLmplot.png')
plot.lm(lmxdf, which=4)
dev.off()