Free Statistics
of Irreproducible Research!
Description of Statistical Computation | |||||||||||||||||||||||||||||||||||||||||||||||||||||||||||||||||||||||||||||||||||||||
|---|---|---|---|---|---|---|---|---|---|---|---|---|---|---|---|---|---|---|---|---|---|---|---|---|---|---|---|---|---|---|---|---|---|---|---|---|---|---|---|---|---|---|---|---|---|---|---|---|---|---|---|---|---|---|---|---|---|---|---|---|---|---|---|---|---|---|---|---|---|---|---|---|---|---|---|---|---|---|---|---|---|---|---|---|---|---|---|
| Author's title | |||||||||||||||||||||||||||||||||||||||||||||||||||||||||||||||||||||||||||||||||||||||
| Author | *Unverified author* | ||||||||||||||||||||||||||||||||||||||||||||||||||||||||||||||||||||||||||||||||||||||
| R Software Module | rwasp_harrell_davis.wasp | ||||||||||||||||||||||||||||||||||||||||||||||||||||||||||||||||||||||||||||||||||||||
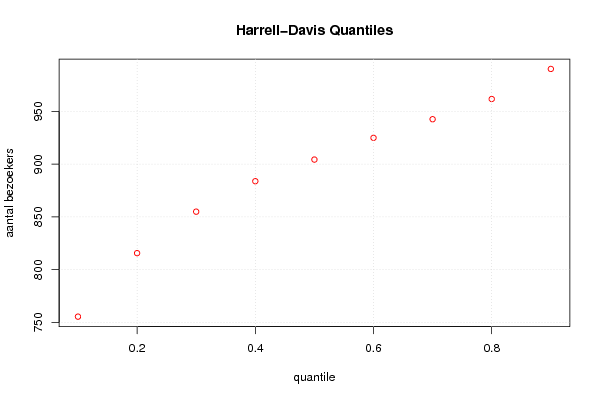
| Title produced by software | Harrell-Davis Quantiles | ||||||||||||||||||||||||||||||||||||||||||||||||||||||||||||||||||||||||||||||||||||||
| Date of computation | Sun, 29 Jul 2012 06:30:29 -0400 | ||||||||||||||||||||||||||||||||||||||||||||||||||||||||||||||||||||||||||||||||||||||
| Cite this page as follows | Statistical Computations at FreeStatistics.org, Office for Research Development and Education, URL https://freestatistics.org/blog/index.php?v=date/2012/Jul/29/t1343557851ozitwfvdue4fcc7.htm/, Retrieved Sat, 05 Jul 2025 17:56:07 +0000 | ||||||||||||||||||||||||||||||||||||||||||||||||||||||||||||||||||||||||||||||||||||||
| Statistical Computations at FreeStatistics.org, Office for Research Development and Education, URL https://freestatistics.org/blog/index.php?pk=168935, Retrieved Sat, 05 Jul 2025 17:56:07 +0000 | |||||||||||||||||||||||||||||||||||||||||||||||||||||||||||||||||||||||||||||||||||||||
| QR Codes: | |||||||||||||||||||||||||||||||||||||||||||||||||||||||||||||||||||||||||||||||||||||||
|
| |||||||||||||||||||||||||||||||||||||||||||||||||||||||||||||||||||||||||||||||||||||||
| Original text written by user: | |||||||||||||||||||||||||||||||||||||||||||||||||||||||||||||||||||||||||||||||||||||||
| IsPrivate? | No (this computation is public) | ||||||||||||||||||||||||||||||||||||||||||||||||||||||||||||||||||||||||||||||||||||||
| User-defined keywords | Bart Mortelmans | ||||||||||||||||||||||||||||||||||||||||||||||||||||||||||||||||||||||||||||||||||||||
| Estimated Impact | 238 | ||||||||||||||||||||||||||||||||||||||||||||||||||||||||||||||||||||||||||||||||||||||
Tree of Dependent Computations | |||||||||||||||||||||||||||||||||||||||||||||||||||||||||||||||||||||||||||||||||||||||
| Family? (F = Feedback message, R = changed R code, M = changed R Module, P = changed Parameters, D = changed Data) | |||||||||||||||||||||||||||||||||||||||||||||||||||||||||||||||||||||||||||||||||||||||
| - [Univariate Data Series] [Tijdreeks 2 - Stap 1] [2012-07-29 10:04:17] [f85cc8f00ef4b762f0a6fdfddc793773] - RMP [Harrell-Davis Quantiles] [Tijdreeks 2 - Stap 5] [2012-07-29 10:30:29] [480fcaba71e70207c3e0ad7177944aa6] [Current] - R P [Harrell-Davis Quantiles] [Tijdreeks 2 - Stap 6] [2012-07-29 10:32:31] [226376a35b8869827dc57271384c00a4] - RMP [Central Tendency] [Tijdreeks 2 - Stap 7] [2012-07-29 10:37:40] [226376a35b8869827dc57271384c00a4] - RMP [Mean versus Median] [Tijdreeks 2 - Stap 8] [2012-07-29 10:41:52] [226376a35b8869827dc57271384c00a4] - R [Mean versus Median] [Tijdreeks 2 - Stap 8] [2012-07-29 10:44:24] [226376a35b8869827dc57271384c00a4] - RM [Mean Plot] [Tijdreeks 2 - Stap 9] [2012-07-29 10:49:52] [226376a35b8869827dc57271384c00a4] - RM [(Partial) Autocorrelation Function] [Tijdreeks 2 - Sta...] [2012-07-29 11:08:12] [226376a35b8869827dc57271384c00a4] - R [(Partial) Autocorrelation Function] [Tijdreeks 2 - Sta...] [2012-07-29 11:12:39] [226376a35b8869827dc57271384c00a4] - RM [Variability] [Tijdreeks 2 - Sta...] [2012-07-29 11:23:37] [226376a35b8869827dc57271384c00a4] - RM [Standard Deviation-Mean Plot] [Tijdreeks 2 - Sta...] [2012-07-29 11:26:49] [226376a35b8869827dc57271384c00a4] - RM [Classical Decomposition] [Tijdreeks 2 - Sta...] [2012-07-29 11:36:01] [226376a35b8869827dc57271384c00a4] - RM [Exponential Smoothing] [Tijdreeks 2 - Sta...] [2012-07-29 11:39:43] [226376a35b8869827dc57271384c00a4] | |||||||||||||||||||||||||||||||||||||||||||||||||||||||||||||||||||||||||||||||||||||||
| Feedback Forum | |||||||||||||||||||||||||||||||||||||||||||||||||||||||||||||||||||||||||||||||||||||||
Post a new message | |||||||||||||||||||||||||||||||||||||||||||||||||||||||||||||||||||||||||||||||||||||||
Dataset | |||||||||||||||||||||||||||||||||||||||||||||||||||||||||||||||||||||||||||||||||||||||
| Dataseries X: | |||||||||||||||||||||||||||||||||||||||||||||||||||||||||||||||||||||||||||||||||||||||
940 950 920 930 930 900 940 840 890 850 830 940 960 900 940 920 930 970 930 780 810 870 720 880 920 920 950 950 890 960 780 780 760 860 740 1020 890 1040 920 900 950 990 840 740 840 960 790 1010 900 970 920 980 890 1000 880 740 860 940 760 1010 870 980 920 950 880 980 910 730 880 820 690 990 800 960 910 950 940 1010 890 660 860 840 740 980 820 1080 930 970 930 1010 880 740 860 810 750 890 790 1000 890 970 900 990 910 730 850 840 830 950 | |||||||||||||||||||||||||||||||||||||||||||||||||||||||||||||||||||||||||||||||||||||||
Tables (Output of Computation) | |||||||||||||||||||||||||||||||||||||||||||||||||||||||||||||||||||||||||||||||||||||||
| |||||||||||||||||||||||||||||||||||||||||||||||||||||||||||||||||||||||||||||||||||||||
Figures (Output of Computation) | |||||||||||||||||||||||||||||||||||||||||||||||||||||||||||||||||||||||||||||||||||||||
Input Parameters & R Code | |||||||||||||||||||||||||||||||||||||||||||||||||||||||||||||||||||||||||||||||||||||||
| Parameters (Session): | |||||||||||||||||||||||||||||||||||||||||||||||||||||||||||||||||||||||||||||||||||||||
| par1 = 0.1 ; par2 = 0.9 ; par3 = 0.1 ; | |||||||||||||||||||||||||||||||||||||||||||||||||||||||||||||||||||||||||||||||||||||||
| Parameters (R input): | |||||||||||||||||||||||||||||||||||||||||||||||||||||||||||||||||||||||||||||||||||||||
| par1 = 0.1 ; par2 = 0.9 ; par3 = 0.1 ; | |||||||||||||||||||||||||||||||||||||||||||||||||||||||||||||||||||||||||||||||||||||||
| R code (references can be found in the software module): | |||||||||||||||||||||||||||||||||||||||||||||||||||||||||||||||||||||||||||||||||||||||
par1 <- as(par1,'numeric') | |||||||||||||||||||||||||||||||||||||||||||||||||||||||||||||||||||||||||||||||||||||||