Free Statistics

of Irreproducible Research!

Author's title

Author*Unverified author*
R Software Modulerwasp_autocorrelation.wasp
Title produced by software(Partial) Autocorrelation Function
Date of computationFri, 13 Jul 2012 06:11:33 -0400
Cite this page as followsStatistical Computations at FreeStatistics.org, Office for Research Development and Education, URL https://freestatistics.org/blog/index.php?v=date/2012/Jul/13/t1342174549vl8smzbdxnmj4cb.htm/, Retrieved Sat, 27 Apr 2024 20:17:47 +0000
Statistical Computations at FreeStatistics.org, Office for Research Development and Education, URL https://freestatistics.org/blog/index.php?pk=168797, Retrieved Sat, 27 Apr 2024 20:17:47 +0000
QR Codes:

Original text written by user:
IsPrivate?No (this computation is public)
User-defined keywordsMargot Avonts
Estimated Impact157
Family? (F = Feedback message, R = changed R code, M = changed R Module, P = changed Parameters, D = changed Data)
-       [(Partial) Autocorrelation Function] [Tijdreeks 2 - sta...] [2012-07-13 10:11:33] [f26bc165187ae19198203e315c1ca52f] [Current]
Feedback Forum

Post a new message
Dataseries X:
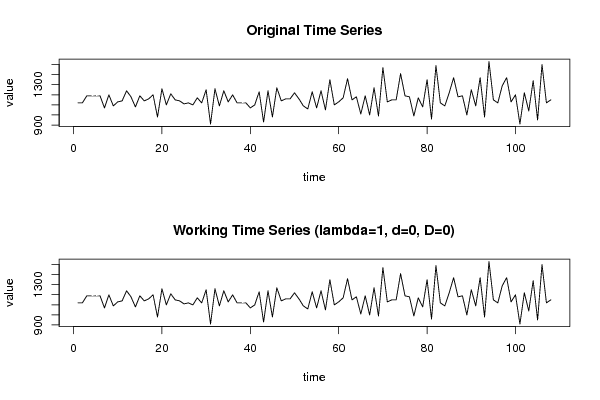
1120
1120
1190
1190
1190
1190
1070
1200
1090
1130
1140
1240
1180
1080
1190
1140
1160
1200
980
1260
1100
1210
1150
1140
1110
1120
1100
1170
1120
1250
910
1260
1090
1240
1130
1200
1120
1120
1120
1070
1100
1230
930
1240
980
1270
1140
1160
1160
1220
1160
1090
1060
1230
1070
1240
1050
1350
1100
1130
1170
1360
1150
1180
1010
1190
1000
1270
990
1470
1130
1150
1150
1410
1190
1180
990
1170
1080
1350
960
1490
1120
1090
1220
1370
1180
1190
1000
1250
1090
1370
980
1530
1150
1120
1290
1370
1130
1200
910
1220
1040
1340
950
1500
1120
1150


Summary of computational transaction
Raw Inputview raw input (R code)
Raw Outputview raw output of R engine
Computing time1 seconds
R Server'Herman Ole Andreas Wold' @ wold.wessa.net

\begin{tabular}{lllllllll}
\hline
Summary of computational transaction \tabularnewline
Raw Input & view raw input (R code)  \tabularnewline
Raw Output & view raw output of R engine  \tabularnewline
Computing time & 1 seconds \tabularnewline
R Server & 'Herman Ole Andreas Wold' @ wold.wessa.net \tabularnewline
\hline
\end{tabular}
%Source: https://freestatistics.org/blog/index.php?pk=168797&T=0

[TABLE]
[ROW][C]Summary of computational transaction[/C][/ROW]
[ROW][C]Raw Input[/C][C]view raw input (R code) [/C][/ROW]
[ROW][C]Raw Output[/C][C]view raw output of R engine [/C][/ROW]
[ROW][C]Computing time[/C][C]1 seconds[/C][/ROW]
[ROW][C]R Server[/C][C]'Herman Ole Andreas Wold' @ wold.wessa.net[/C][/ROW]
[/TABLE]
Source: https://freestatistics.org/blog/index.php?pk=168797&T=0

Globally Unique Identifier (entire table): ba.freestatistics.org/blog/index.php?pk=168797&T=0

As an alternative you can also use a QR Code:  

The GUIDs for individual cells are displayed in the table below:

Summary of computational transaction
Raw Inputview raw input (R code)
Raw Outputview raw output of R engine
Computing time1 seconds
R Server'Herman Ole Andreas Wold' @ wold.wessa.net


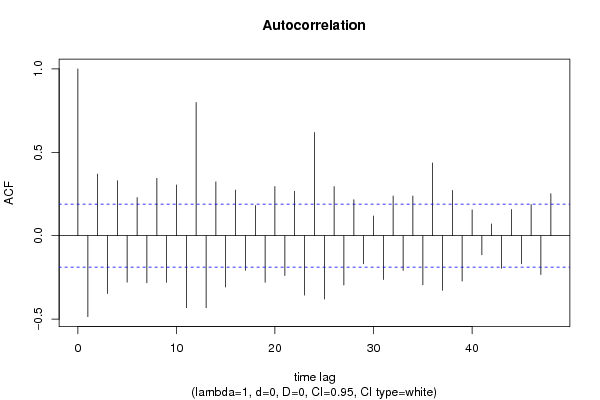
Autocorrelation Function
Time lag kACF(k)T-STATP-value
1-0.485868-5.04931e-06
20.3691573.83640.000105
3-0.347151-3.60770.000235
40.3297373.42670.000433
5-0.278956-2.8990.002268
60.2280322.36980.009787
7-0.282851-2.93950.002011
80.3435213.570.000267
9-0.279131-2.90080.002255
100.3037933.15710.001033
11-0.431846-4.48799e-06
120.7992438.3060
13-0.432945-4.49939e-06
140.3226813.35340.000551
15-0.3076-3.19670.000912
160.2730622.83770.002714
17-0.208087-2.16250.016393
180.1814411.88560.031018
19-0.279234-2.90190.002248
200.2942373.05780.001406
21-0.239191-2.48570.00723
220.2660122.76450.003353
23-0.356561-3.70550.000167
240.6192886.43580
25-0.379535-3.94427.1e-05
260.2942333.05780.001406
27-0.296074-3.07690.001325
280.2152482.23690.013673
29-0.168367-1.74970.041504
300.1180311.22660.111318
31-0.262856-2.73170.003681
320.2377862.47110.007515
33-0.208566-2.16750.016197
340.2383412.47690.007402
35-0.294648-3.06210.001387
360.4355454.52638e-06
37-0.327912-3.40780.000461
380.2710222.81650.002886
39-0.271958-2.82630.002806
400.1545981.60660.055527
41-0.114894-1.1940.117544
420.0704550.73220.23282
43-0.195708-2.03390.022208
440.1569511.63110.052892
45-0.16872-1.75340.041186
460.1861341.93440.027843
47-0.233443-2.4260.008461
480.2515842.61450.005105

\begin{tabular}{lllllllll}
\hline
Autocorrelation Function \tabularnewline
Time lag k & ACF(k) & T-STAT & P-value \tabularnewline
1 & -0.485868 & -5.0493 & 1e-06 \tabularnewline
2 & 0.369157 & 3.8364 & 0.000105 \tabularnewline
3 & -0.347151 & -3.6077 & 0.000235 \tabularnewline
4 & 0.329737 & 3.4267 & 0.000433 \tabularnewline
5 & -0.278956 & -2.899 & 0.002268 \tabularnewline
6 & 0.228032 & 2.3698 & 0.009787 \tabularnewline
7 & -0.282851 & -2.9395 & 0.002011 \tabularnewline
8 & 0.343521 & 3.57 & 0.000267 \tabularnewline
9 & -0.279131 & -2.9008 & 0.002255 \tabularnewline
10 & 0.303793 & 3.1571 & 0.001033 \tabularnewline
11 & -0.431846 & -4.4879 & 9e-06 \tabularnewline
12 & 0.799243 & 8.306 & 0 \tabularnewline
13 & -0.432945 & -4.4993 & 9e-06 \tabularnewline
14 & 0.322681 & 3.3534 & 0.000551 \tabularnewline
15 & -0.3076 & -3.1967 & 0.000912 \tabularnewline
16 & 0.273062 & 2.8377 & 0.002714 \tabularnewline
17 & -0.208087 & -2.1625 & 0.016393 \tabularnewline
18 & 0.181441 & 1.8856 & 0.031018 \tabularnewline
19 & -0.279234 & -2.9019 & 0.002248 \tabularnewline
20 & 0.294237 & 3.0578 & 0.001406 \tabularnewline
21 & -0.239191 & -2.4857 & 0.00723 \tabularnewline
22 & 0.266012 & 2.7645 & 0.003353 \tabularnewline
23 & -0.356561 & -3.7055 & 0.000167 \tabularnewline
24 & 0.619288 & 6.4358 & 0 \tabularnewline
25 & -0.379535 & -3.9442 & 7.1e-05 \tabularnewline
26 & 0.294233 & 3.0578 & 0.001406 \tabularnewline
27 & -0.296074 & -3.0769 & 0.001325 \tabularnewline
28 & 0.215248 & 2.2369 & 0.013673 \tabularnewline
29 & -0.168367 & -1.7497 & 0.041504 \tabularnewline
30 & 0.118031 & 1.2266 & 0.111318 \tabularnewline
31 & -0.262856 & -2.7317 & 0.003681 \tabularnewline
32 & 0.237786 & 2.4711 & 0.007515 \tabularnewline
33 & -0.208566 & -2.1675 & 0.016197 \tabularnewline
34 & 0.238341 & 2.4769 & 0.007402 \tabularnewline
35 & -0.294648 & -3.0621 & 0.001387 \tabularnewline
36 & 0.435545 & 4.5263 & 8e-06 \tabularnewline
37 & -0.327912 & -3.4078 & 0.000461 \tabularnewline
38 & 0.271022 & 2.8165 & 0.002886 \tabularnewline
39 & -0.271958 & -2.8263 & 0.002806 \tabularnewline
40 & 0.154598 & 1.6066 & 0.055527 \tabularnewline
41 & -0.114894 & -1.194 & 0.117544 \tabularnewline
42 & 0.070455 & 0.7322 & 0.23282 \tabularnewline
43 & -0.195708 & -2.0339 & 0.022208 \tabularnewline
44 & 0.156951 & 1.6311 & 0.052892 \tabularnewline
45 & -0.16872 & -1.7534 & 0.041186 \tabularnewline
46 & 0.186134 & 1.9344 & 0.027843 \tabularnewline
47 & -0.233443 & -2.426 & 0.008461 \tabularnewline
48 & 0.251584 & 2.6145 & 0.005105 \tabularnewline
\hline
\end{tabular}
%Source: https://freestatistics.org/blog/index.php?pk=168797&T=1

[TABLE]
[ROW][C]Autocorrelation Function[/C][/ROW]
[ROW][C]Time lag k[/C][C]ACF(k)[/C][C]T-STAT[/C][C]P-value[/C][/ROW]
[ROW][C]1[/C][C]-0.485868[/C][C]-5.0493[/C][C]1e-06[/C][/ROW]
[ROW][C]2[/C][C]0.369157[/C][C]3.8364[/C][C]0.000105[/C][/ROW]
[ROW][C]3[/C][C]-0.347151[/C][C]-3.6077[/C][C]0.000235[/C][/ROW]
[ROW][C]4[/C][C]0.329737[/C][C]3.4267[/C][C]0.000433[/C][/ROW]
[ROW][C]5[/C][C]-0.278956[/C][C]-2.899[/C][C]0.002268[/C][/ROW]
[ROW][C]6[/C][C]0.228032[/C][C]2.3698[/C][C]0.009787[/C][/ROW]
[ROW][C]7[/C][C]-0.282851[/C][C]-2.9395[/C][C]0.002011[/C][/ROW]
[ROW][C]8[/C][C]0.343521[/C][C]3.57[/C][C]0.000267[/C][/ROW]
[ROW][C]9[/C][C]-0.279131[/C][C]-2.9008[/C][C]0.002255[/C][/ROW]
[ROW][C]10[/C][C]0.303793[/C][C]3.1571[/C][C]0.001033[/C][/ROW]
[ROW][C]11[/C][C]-0.431846[/C][C]-4.4879[/C][C]9e-06[/C][/ROW]
[ROW][C]12[/C][C]0.799243[/C][C]8.306[/C][C]0[/C][/ROW]
[ROW][C]13[/C][C]-0.432945[/C][C]-4.4993[/C][C]9e-06[/C][/ROW]
[ROW][C]14[/C][C]0.322681[/C][C]3.3534[/C][C]0.000551[/C][/ROW]
[ROW][C]15[/C][C]-0.3076[/C][C]-3.1967[/C][C]0.000912[/C][/ROW]
[ROW][C]16[/C][C]0.273062[/C][C]2.8377[/C][C]0.002714[/C][/ROW]
[ROW][C]17[/C][C]-0.208087[/C][C]-2.1625[/C][C]0.016393[/C][/ROW]
[ROW][C]18[/C][C]0.181441[/C][C]1.8856[/C][C]0.031018[/C][/ROW]
[ROW][C]19[/C][C]-0.279234[/C][C]-2.9019[/C][C]0.002248[/C][/ROW]
[ROW][C]20[/C][C]0.294237[/C][C]3.0578[/C][C]0.001406[/C][/ROW]
[ROW][C]21[/C][C]-0.239191[/C][C]-2.4857[/C][C]0.00723[/C][/ROW]
[ROW][C]22[/C][C]0.266012[/C][C]2.7645[/C][C]0.003353[/C][/ROW]
[ROW][C]23[/C][C]-0.356561[/C][C]-3.7055[/C][C]0.000167[/C][/ROW]
[ROW][C]24[/C][C]0.619288[/C][C]6.4358[/C][C]0[/C][/ROW]
[ROW][C]25[/C][C]-0.379535[/C][C]-3.9442[/C][C]7.1e-05[/C][/ROW]
[ROW][C]26[/C][C]0.294233[/C][C]3.0578[/C][C]0.001406[/C][/ROW]
[ROW][C]27[/C][C]-0.296074[/C][C]-3.0769[/C][C]0.001325[/C][/ROW]
[ROW][C]28[/C][C]0.215248[/C][C]2.2369[/C][C]0.013673[/C][/ROW]
[ROW][C]29[/C][C]-0.168367[/C][C]-1.7497[/C][C]0.041504[/C][/ROW]
[ROW][C]30[/C][C]0.118031[/C][C]1.2266[/C][C]0.111318[/C][/ROW]
[ROW][C]31[/C][C]-0.262856[/C][C]-2.7317[/C][C]0.003681[/C][/ROW]
[ROW][C]32[/C][C]0.237786[/C][C]2.4711[/C][C]0.007515[/C][/ROW]
[ROW][C]33[/C][C]-0.208566[/C][C]-2.1675[/C][C]0.016197[/C][/ROW]
[ROW][C]34[/C][C]0.238341[/C][C]2.4769[/C][C]0.007402[/C][/ROW]
[ROW][C]35[/C][C]-0.294648[/C][C]-3.0621[/C][C]0.001387[/C][/ROW]
[ROW][C]36[/C][C]0.435545[/C][C]4.5263[/C][C]8e-06[/C][/ROW]
[ROW][C]37[/C][C]-0.327912[/C][C]-3.4078[/C][C]0.000461[/C][/ROW]
[ROW][C]38[/C][C]0.271022[/C][C]2.8165[/C][C]0.002886[/C][/ROW]
[ROW][C]39[/C][C]-0.271958[/C][C]-2.8263[/C][C]0.002806[/C][/ROW]
[ROW][C]40[/C][C]0.154598[/C][C]1.6066[/C][C]0.055527[/C][/ROW]
[ROW][C]41[/C][C]-0.114894[/C][C]-1.194[/C][C]0.117544[/C][/ROW]
[ROW][C]42[/C][C]0.070455[/C][C]0.7322[/C][C]0.23282[/C][/ROW]
[ROW][C]43[/C][C]-0.195708[/C][C]-2.0339[/C][C]0.022208[/C][/ROW]
[ROW][C]44[/C][C]0.156951[/C][C]1.6311[/C][C]0.052892[/C][/ROW]
[ROW][C]45[/C][C]-0.16872[/C][C]-1.7534[/C][C]0.041186[/C][/ROW]
[ROW][C]46[/C][C]0.186134[/C][C]1.9344[/C][C]0.027843[/C][/ROW]
[ROW][C]47[/C][C]-0.233443[/C][C]-2.426[/C][C]0.008461[/C][/ROW]
[ROW][C]48[/C][C]0.251584[/C][C]2.6145[/C][C]0.005105[/C][/ROW]
[/TABLE]
Source: https://freestatistics.org/blog/index.php?pk=168797&T=1

Globally Unique Identifier (entire table): ba.freestatistics.org/blog/index.php?pk=168797&T=1

As an alternative you can also use a QR Code:  

The GUIDs for individual cells are displayed in the table below:

Autocorrelation Function
Time lag kACF(k)T-STATP-value
1-0.485868-5.04931e-06
20.3691573.83640.000105
3-0.347151-3.60770.000235
40.3297373.42670.000433
5-0.278956-2.8990.002268
60.2280322.36980.009787
7-0.282851-2.93950.002011
80.3435213.570.000267
9-0.279131-2.90080.002255
100.3037933.15710.001033
11-0.431846-4.48799e-06
120.7992438.3060
13-0.432945-4.49939e-06
140.3226813.35340.000551
15-0.3076-3.19670.000912
160.2730622.83770.002714
17-0.208087-2.16250.016393
180.1814411.88560.031018
19-0.279234-2.90190.002248
200.2942373.05780.001406
21-0.239191-2.48570.00723
220.2660122.76450.003353
23-0.356561-3.70550.000167
240.6192886.43580
25-0.379535-3.94427.1e-05
260.2942333.05780.001406
27-0.296074-3.07690.001325
280.2152482.23690.013673
29-0.168367-1.74970.041504
300.1180311.22660.111318
31-0.262856-2.73170.003681
320.2377862.47110.007515
33-0.208566-2.16750.016197
340.2383412.47690.007402
35-0.294648-3.06210.001387
360.4355454.52638e-06
37-0.327912-3.40780.000461
380.2710222.81650.002886
39-0.271958-2.82630.002806
400.1545981.60660.055527
41-0.114894-1.1940.117544
420.0704550.73220.23282
43-0.195708-2.03390.022208
440.1569511.63110.052892
45-0.16872-1.75340.041186
460.1861341.93440.027843
47-0.233443-2.4260.008461
480.2515842.61450.005105


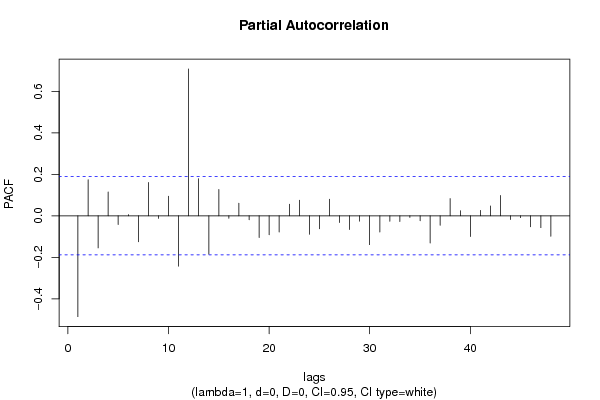
Partial Autocorrelation Function
Time lag kPACF(k)T-STATP-value
1-0.485868-5.04931e-06
20.1742171.81050.036498
3-0.154427-1.60480.055724
40.115231.19750.116866
5-0.041832-0.43470.332314
60.0058370.06070.475873
7-0.125226-1.30140.097947
80.1609111.67220.048686
9-0.0123-0.12780.449263
100.0946550.98370.163736
11-0.242377-2.51890.006619
120.7077987.35570
130.1786191.85630.033071
14-0.184464-1.9170.02894
150.1267871.31760.095212
16-0.011431-0.11880.452829
170.06070.63080.264749
18-0.018909-0.19650.42229
19-0.104704-1.08810.139483
20-0.090965-0.94530.1733
21-0.078056-0.81120.209522
220.0557080.57890.281919
230.0753840.78340.217548
24-0.08848-0.91950.179939
25-0.062608-0.65060.258331
260.0796830.82810.204722
27-0.032334-0.3360.368752
28-0.066166-0.68760.246583
29-0.025705-0.26710.394937
30-0.138913-1.44360.07587
31-0.077621-0.80670.210817
32-0.026443-0.27480.391998
33-0.027527-0.28610.387685
34-0.007627-0.07930.468487
35-0.023698-0.24630.402969
36-0.131148-1.36290.08787
37-0.045154-0.46920.319919
380.0828010.86050.195711
390.024190.25140.400996
40-0.099559-1.03460.151572
410.0261410.27170.393198
420.0475150.49380.311228
430.0978831.01720.15566
44-0.018081-0.18790.425652
45-0.008751-0.09090.463852
46-0.05287-0.54940.291917
47-0.05692-0.59150.277702
48-0.098225-1.02080.154819

\begin{tabular}{lllllllll}
\hline
Partial Autocorrelation Function \tabularnewline
Time lag k & PACF(k) & T-STAT & P-value \tabularnewline
1 & -0.485868 & -5.0493 & 1e-06 \tabularnewline
2 & 0.174217 & 1.8105 & 0.036498 \tabularnewline
3 & -0.154427 & -1.6048 & 0.055724 \tabularnewline
4 & 0.11523 & 1.1975 & 0.116866 \tabularnewline
5 & -0.041832 & -0.4347 & 0.332314 \tabularnewline
6 & 0.005837 & 0.0607 & 0.475873 \tabularnewline
7 & -0.125226 & -1.3014 & 0.097947 \tabularnewline
8 & 0.160911 & 1.6722 & 0.048686 \tabularnewline
9 & -0.0123 & -0.1278 & 0.449263 \tabularnewline
10 & 0.094655 & 0.9837 & 0.163736 \tabularnewline
11 & -0.242377 & -2.5189 & 0.006619 \tabularnewline
12 & 0.707798 & 7.3557 & 0 \tabularnewline
13 & 0.178619 & 1.8563 & 0.033071 \tabularnewline
14 & -0.184464 & -1.917 & 0.02894 \tabularnewline
15 & 0.126787 & 1.3176 & 0.095212 \tabularnewline
16 & -0.011431 & -0.1188 & 0.452829 \tabularnewline
17 & 0.0607 & 0.6308 & 0.264749 \tabularnewline
18 & -0.018909 & -0.1965 & 0.42229 \tabularnewline
19 & -0.104704 & -1.0881 & 0.139483 \tabularnewline
20 & -0.090965 & -0.9453 & 0.1733 \tabularnewline
21 & -0.078056 & -0.8112 & 0.209522 \tabularnewline
22 & 0.055708 & 0.5789 & 0.281919 \tabularnewline
23 & 0.075384 & 0.7834 & 0.217548 \tabularnewline
24 & -0.08848 & -0.9195 & 0.179939 \tabularnewline
25 & -0.062608 & -0.6506 & 0.258331 \tabularnewline
26 & 0.079683 & 0.8281 & 0.204722 \tabularnewline
27 & -0.032334 & -0.336 & 0.368752 \tabularnewline
28 & -0.066166 & -0.6876 & 0.246583 \tabularnewline
29 & -0.025705 & -0.2671 & 0.394937 \tabularnewline
30 & -0.138913 & -1.4436 & 0.07587 \tabularnewline
31 & -0.077621 & -0.8067 & 0.210817 \tabularnewline
32 & -0.026443 & -0.2748 & 0.391998 \tabularnewline
33 & -0.027527 & -0.2861 & 0.387685 \tabularnewline
34 & -0.007627 & -0.0793 & 0.468487 \tabularnewline
35 & -0.023698 & -0.2463 & 0.402969 \tabularnewline
36 & -0.131148 & -1.3629 & 0.08787 \tabularnewline
37 & -0.045154 & -0.4692 & 0.319919 \tabularnewline
38 & 0.082801 & 0.8605 & 0.195711 \tabularnewline
39 & 0.02419 & 0.2514 & 0.400996 \tabularnewline
40 & -0.099559 & -1.0346 & 0.151572 \tabularnewline
41 & 0.026141 & 0.2717 & 0.393198 \tabularnewline
42 & 0.047515 & 0.4938 & 0.311228 \tabularnewline
43 & 0.097883 & 1.0172 & 0.15566 \tabularnewline
44 & -0.018081 & -0.1879 & 0.425652 \tabularnewline
45 & -0.008751 & -0.0909 & 0.463852 \tabularnewline
46 & -0.05287 & -0.5494 & 0.291917 \tabularnewline
47 & -0.05692 & -0.5915 & 0.277702 \tabularnewline
48 & -0.098225 & -1.0208 & 0.154819 \tabularnewline
\hline
\end{tabular}
%Source: https://freestatistics.org/blog/index.php?pk=168797&T=2

[TABLE]
[ROW][C]Partial Autocorrelation Function[/C][/ROW]
[ROW][C]Time lag k[/C][C]PACF(k)[/C][C]T-STAT[/C][C]P-value[/C][/ROW]
[ROW][C]1[/C][C]-0.485868[/C][C]-5.0493[/C][C]1e-06[/C][/ROW]
[ROW][C]2[/C][C]0.174217[/C][C]1.8105[/C][C]0.036498[/C][/ROW]
[ROW][C]3[/C][C]-0.154427[/C][C]-1.6048[/C][C]0.055724[/C][/ROW]
[ROW][C]4[/C][C]0.11523[/C][C]1.1975[/C][C]0.116866[/C][/ROW]
[ROW][C]5[/C][C]-0.041832[/C][C]-0.4347[/C][C]0.332314[/C][/ROW]
[ROW][C]6[/C][C]0.005837[/C][C]0.0607[/C][C]0.475873[/C][/ROW]
[ROW][C]7[/C][C]-0.125226[/C][C]-1.3014[/C][C]0.097947[/C][/ROW]
[ROW][C]8[/C][C]0.160911[/C][C]1.6722[/C][C]0.048686[/C][/ROW]
[ROW][C]9[/C][C]-0.0123[/C][C]-0.1278[/C][C]0.449263[/C][/ROW]
[ROW][C]10[/C][C]0.094655[/C][C]0.9837[/C][C]0.163736[/C][/ROW]
[ROW][C]11[/C][C]-0.242377[/C][C]-2.5189[/C][C]0.006619[/C][/ROW]
[ROW][C]12[/C][C]0.707798[/C][C]7.3557[/C][C]0[/C][/ROW]
[ROW][C]13[/C][C]0.178619[/C][C]1.8563[/C][C]0.033071[/C][/ROW]
[ROW][C]14[/C][C]-0.184464[/C][C]-1.917[/C][C]0.02894[/C][/ROW]
[ROW][C]15[/C][C]0.126787[/C][C]1.3176[/C][C]0.095212[/C][/ROW]
[ROW][C]16[/C][C]-0.011431[/C][C]-0.1188[/C][C]0.452829[/C][/ROW]
[ROW][C]17[/C][C]0.0607[/C][C]0.6308[/C][C]0.264749[/C][/ROW]
[ROW][C]18[/C][C]-0.018909[/C][C]-0.1965[/C][C]0.42229[/C][/ROW]
[ROW][C]19[/C][C]-0.104704[/C][C]-1.0881[/C][C]0.139483[/C][/ROW]
[ROW][C]20[/C][C]-0.090965[/C][C]-0.9453[/C][C]0.1733[/C][/ROW]
[ROW][C]21[/C][C]-0.078056[/C][C]-0.8112[/C][C]0.209522[/C][/ROW]
[ROW][C]22[/C][C]0.055708[/C][C]0.5789[/C][C]0.281919[/C][/ROW]
[ROW][C]23[/C][C]0.075384[/C][C]0.7834[/C][C]0.217548[/C][/ROW]
[ROW][C]24[/C][C]-0.08848[/C][C]-0.9195[/C][C]0.179939[/C][/ROW]
[ROW][C]25[/C][C]-0.062608[/C][C]-0.6506[/C][C]0.258331[/C][/ROW]
[ROW][C]26[/C][C]0.079683[/C][C]0.8281[/C][C]0.204722[/C][/ROW]
[ROW][C]27[/C][C]-0.032334[/C][C]-0.336[/C][C]0.368752[/C][/ROW]
[ROW][C]28[/C][C]-0.066166[/C][C]-0.6876[/C][C]0.246583[/C][/ROW]
[ROW][C]29[/C][C]-0.025705[/C][C]-0.2671[/C][C]0.394937[/C][/ROW]
[ROW][C]30[/C][C]-0.138913[/C][C]-1.4436[/C][C]0.07587[/C][/ROW]
[ROW][C]31[/C][C]-0.077621[/C][C]-0.8067[/C][C]0.210817[/C][/ROW]
[ROW][C]32[/C][C]-0.026443[/C][C]-0.2748[/C][C]0.391998[/C][/ROW]
[ROW][C]33[/C][C]-0.027527[/C][C]-0.2861[/C][C]0.387685[/C][/ROW]
[ROW][C]34[/C][C]-0.007627[/C][C]-0.0793[/C][C]0.468487[/C][/ROW]
[ROW][C]35[/C][C]-0.023698[/C][C]-0.2463[/C][C]0.402969[/C][/ROW]
[ROW][C]36[/C][C]-0.131148[/C][C]-1.3629[/C][C]0.08787[/C][/ROW]
[ROW][C]37[/C][C]-0.045154[/C][C]-0.4692[/C][C]0.319919[/C][/ROW]
[ROW][C]38[/C][C]0.082801[/C][C]0.8605[/C][C]0.195711[/C][/ROW]
[ROW][C]39[/C][C]0.02419[/C][C]0.2514[/C][C]0.400996[/C][/ROW]
[ROW][C]40[/C][C]-0.099559[/C][C]-1.0346[/C][C]0.151572[/C][/ROW]
[ROW][C]41[/C][C]0.026141[/C][C]0.2717[/C][C]0.393198[/C][/ROW]
[ROW][C]42[/C][C]0.047515[/C][C]0.4938[/C][C]0.311228[/C][/ROW]
[ROW][C]43[/C][C]0.097883[/C][C]1.0172[/C][C]0.15566[/C][/ROW]
[ROW][C]44[/C][C]-0.018081[/C][C]-0.1879[/C][C]0.425652[/C][/ROW]
[ROW][C]45[/C][C]-0.008751[/C][C]-0.0909[/C][C]0.463852[/C][/ROW]
[ROW][C]46[/C][C]-0.05287[/C][C]-0.5494[/C][C]0.291917[/C][/ROW]
[ROW][C]47[/C][C]-0.05692[/C][C]-0.5915[/C][C]0.277702[/C][/ROW]
[ROW][C]48[/C][C]-0.098225[/C][C]-1.0208[/C][C]0.154819[/C][/ROW]
[/TABLE]
Source: https://freestatistics.org/blog/index.php?pk=168797&T=2

Globally Unique Identifier (entire table): ba.freestatistics.org/blog/index.php?pk=168797&T=2

As an alternative you can also use a QR Code:  

The GUIDs for individual cells are displayed in the table below:

Partial Autocorrelation Function
Time lag kPACF(k)T-STATP-value
1-0.485868-5.04931e-06
20.1742171.81050.036498
3-0.154427-1.60480.055724
40.115231.19750.116866
5-0.041832-0.43470.332314
60.0058370.06070.475873
7-0.125226-1.30140.097947
80.1609111.67220.048686
9-0.0123-0.12780.449263
100.0946550.98370.163736
11-0.242377-2.51890.006619
120.7077987.35570
130.1786191.85630.033071
14-0.184464-1.9170.02894
150.1267871.31760.095212
16-0.011431-0.11880.452829
170.06070.63080.264749
18-0.018909-0.19650.42229
19-0.104704-1.08810.139483
20-0.090965-0.94530.1733
21-0.078056-0.81120.209522
220.0557080.57890.281919
230.0753840.78340.217548
24-0.08848-0.91950.179939
25-0.062608-0.65060.258331
260.0796830.82810.204722
27-0.032334-0.3360.368752
28-0.066166-0.68760.246583
29-0.025705-0.26710.394937
30-0.138913-1.44360.07587
31-0.077621-0.80670.210817
32-0.026443-0.27480.391998
33-0.027527-0.28610.387685
34-0.007627-0.07930.468487
35-0.023698-0.24630.402969
36-0.131148-1.36290.08787
37-0.045154-0.46920.319919
380.0828010.86050.195711
390.024190.25140.400996
40-0.099559-1.03460.151572
410.0261410.27170.393198
420.0475150.49380.311228
430.0978831.01720.15566
44-0.018081-0.18790.425652
45-0.008751-0.09090.463852
46-0.05287-0.54940.291917
47-0.05692-0.59150.277702
48-0.098225-1.02080.154819


Parameters (Session):
Parameters (R input):
par1 = 48 ; par2 = 1 ; par3 = 0 ; par4 = 0 ; par5 = 12 ; par6 = White Noise ; par7 = 0.95 ; par8 = ;
R code (references can be found in the software module):
if (par1 == 'Default') {
par1 = 10*log10(length(x))
} else {
par1 <- as.numeric(par1)
}
par2 <- as.numeric(par2)
par3 <- as.numeric(par3)
par4 <- as.numeric(par4)
par5 <- as.numeric(par5)
if (par6 == 'White Noise') par6 <- 'white' else par6 <- 'ma'
par7 <- as.numeric(par7)
if (par8 != '') par8 <- as.numeric(par8)
ox <- x
if (par8 == '') {
if (par2 == 0) {
x <- log(x)
} else {
x <- (x ^ par2 - 1) / par2
}
} else {
x <- log(x,base=par8)
}
if (par3 > 0) x <- diff(x,lag=1,difference=par3)
if (par4 > 0) x <- diff(x,lag=par5,difference=par4)
bitmap(file='picts.png')
op <- par(mfrow=c(2,1))
plot(ox,type='l',main='Original Time Series',xlab='time',ylab='value')
if (par8=='') {
mytitle <- paste('Working Time Series (lambda=',par2,', d=',par3,', D=',par4,')',sep='')
mysub <- paste('(lambda=',par2,', d=',par3,', D=',par4,', CI=', par7, ', CI type=',par6,')',sep='')
} else {
mytitle <- paste('Working Time Series (base=',par8,', d=',par3,', D=',par4,')',sep='')
mysub <- paste('(base=',par8,', d=',par3,', D=',par4,', CI=', par7, ', CI type=',par6,')',sep='')
}
plot(x,type='l', main=mytitle,xlab='time',ylab='value')
par(op)
dev.off()
bitmap(file='pic1.png')
racf <- acf(x, par1, main='Autocorrelation', xlab='time lag', ylab='ACF', ci.type=par6, ci=par7, sub=mysub)
dev.off()
bitmap(file='pic2.png')
rpacf <- pacf(x,par1,main='Partial Autocorrelation',xlab='lags',ylab='PACF',sub=mysub)
dev.off()
(myacf <- c(racf$acf))
(mypacf <- c(rpacf$acf))
lengthx <- length(x)
sqrtn <- sqrt(lengthx)
load(file='createtable')
a<-table.start()
a<-table.row.start(a)
a<-table.element(a,'Autocorrelation Function',4,TRUE)
a<-table.row.end(a)
a<-table.row.start(a)
a<-table.element(a,'Time lag k',header=TRUE)
a<-table.element(a,hyperlink('basics.htm','ACF(k)','click here for more information about the Autocorrelation Function'),header=TRUE)
a<-table.element(a,'T-STAT',header=TRUE)
a<-table.element(a,'P-value',header=TRUE)
a<-table.row.end(a)
for (i in 2:(par1+1)) {
a<-table.row.start(a)
a<-table.element(a,i-1,header=TRUE)
a<-table.element(a,round(myacf[i],6))
mytstat <- myacf[i]*sqrtn
a<-table.element(a,round(mytstat,4))
a<-table.element(a,round(1-pt(abs(mytstat),lengthx),6))
a<-table.row.end(a)
}
a<-table.end(a)
table.save(a,file='mytable.tab')
a<-table.start()
a<-table.row.start(a)
a<-table.element(a,'Partial Autocorrelation Function',4,TRUE)
a<-table.row.end(a)
a<-table.row.start(a)
a<-table.element(a,'Time lag k',header=TRUE)
a<-table.element(a,hyperlink('basics.htm','PACF(k)','click here for more information about the Partial Autocorrelation Function'),header=TRUE)
a<-table.element(a,'T-STAT',header=TRUE)
a<-table.element(a,'P-value',header=TRUE)
a<-table.row.end(a)
for (i in 1:par1) {
a<-table.row.start(a)
a<-table.element(a,i,header=TRUE)
a<-table.element(a,round(mypacf[i],6))
mytstat <- mypacf[i]*sqrtn
a<-table.element(a,round(mytstat,4))
a<-table.element(a,round(1-pt(abs(mytstat),lengthx),6))
a<-table.row.end(a)
}
a<-table.end(a)
table.save(a,file='mytable1.tab')