Free Statistics
of Irreproducible Research!
Description of Statistical Computation | |||||||||||||||||||||||||||||||||||||||||||||||||||||||||||||||||||||||||||||
|---|---|---|---|---|---|---|---|---|---|---|---|---|---|---|---|---|---|---|---|---|---|---|---|---|---|---|---|---|---|---|---|---|---|---|---|---|---|---|---|---|---|---|---|---|---|---|---|---|---|---|---|---|---|---|---|---|---|---|---|---|---|---|---|---|---|---|---|---|---|---|---|---|---|---|---|---|---|
| Author's title | |||||||||||||||||||||||||||||||||||||||||||||||||||||||||||||||||||||||||||||
| Author | *Unverified author* | ||||||||||||||||||||||||||||||||||||||||||||||||||||||||||||||||||||||||||||
| R Software Module | rwasp_pairs.wasp | ||||||||||||||||||||||||||||||||||||||||||||||||||||||||||||||||||||||||||||
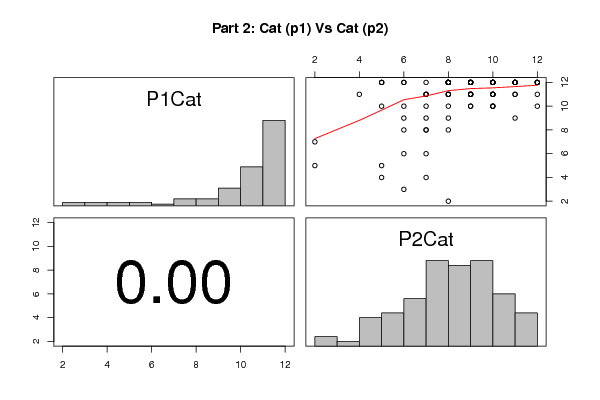
| Title produced by software | Kendall tau Correlation Matrix | ||||||||||||||||||||||||||||||||||||||||||||||||||||||||||||||||||||||||||||
| Date of computation | Thu, 19 Jan 2012 09:03:39 -0500 | ||||||||||||||||||||||||||||||||||||||||||||||||||||||||||||||||||||||||||||
| Cite this page as follows | Statistical Computations at FreeStatistics.org, Office for Research Development and Education, URL https://freestatistics.org/blog/index.php?v=date/2012/Jan/19/t1326981855fusot4ms8n0jy6x.htm/, Retrieved Sun, 05 May 2024 02:33:03 +0000 | ||||||||||||||||||||||||||||||||||||||||||||||||||||||||||||||||||||||||||||
| Statistical Computations at FreeStatistics.org, Office for Research Development and Education, URL https://freestatistics.org/blog/index.php?pk=161249, Retrieved Sun, 05 May 2024 02:33:03 +0000 | |||||||||||||||||||||||||||||||||||||||||||||||||||||||||||||||||||||||||||||
| QR Codes: | |||||||||||||||||||||||||||||||||||||||||||||||||||||||||||||||||||||||||||||
|
| |||||||||||||||||||||||||||||||||||||||||||||||||||||||||||||||||||||||||||||
| Original text written by user: | |||||||||||||||||||||||||||||||||||||||||||||||||||||||||||||||||||||||||||||
| IsPrivate? | No (this computation is public) | ||||||||||||||||||||||||||||||||||||||||||||||||||||||||||||||||||||||||||||
| User-defined keywords | |||||||||||||||||||||||||||||||||||||||||||||||||||||||||||||||||||||||||||||
| Estimated Impact | 154 | ||||||||||||||||||||||||||||||||||||||||||||||||||||||||||||||||||||||||||||
Tree of Dependent Computations | |||||||||||||||||||||||||||||||||||||||||||||||||||||||||||||||||||||||||||||
| Family? (F = Feedback message, R = changed R code, M = changed R Module, P = changed Parameters, D = changed Data) | |||||||||||||||||||||||||||||||||||||||||||||||||||||||||||||||||||||||||||||
| - [Aston University Statistical Software] [Test of Two Means] [2009-11-10 17:16:17] [98fd0e87c3eb04e0cc2efde01dbafab6] - R P [Aston University Statistical Software] [Compare Two Means] [2009-11-11 08:09:40] [74be16979710d4c4e7c6647856088456] - D [Aston University Statistical Software] [PY2236 Week 6 dat...] [2009-11-11 12:53:10] [74be16979710d4c4e7c6647856088456] - P [T-Tests] [Week 9 PY2236] [2010-11-24 14:41:08] [74be16979710d4c4e7c6647856088456] - D [T-Tests] [PY2236 Week 9 Dat...] [2010-11-30 18:04:40] [74be16979710d4c4e7c6647856088456] - RM D [T-Tests] [pt 1 vs pt 2] [2012-01-15 22:29:25] [74be16979710d4c4e7c6647856088456] - RMP [Kendall tau Correlation Matrix] [Histogram for par...] [2012-01-19 14:03:39] [d41d8cd98f00b204e9800998ecf8427e] [Current] | |||||||||||||||||||||||||||||||||||||||||||||||||||||||||||||||||||||||||||||
| Feedback Forum | |||||||||||||||||||||||||||||||||||||||||||||||||||||||||||||||||||||||||||||
Post a new message | |||||||||||||||||||||||||||||||||||||||||||||||||||||||||||||||||||||||||||||
Dataset | |||||||||||||||||||||||||||||||||||||||||||||||||||||||||||||||||||||||||||||
| Dataseries X: | |||||||||||||||||||||||||||||||||||||||||||||||||||||||||||||||||||||||||||||
11 7 12 6 12 10 12 9 12 7 12 9 11 8 10 8 8 6 9 11 12 8 11 12 12 10 12 8 12 10 12 9 12 8 11 9 12 12 11 9 12 5 11 9 12 8 11 10 12 10 12 5 11 11 11 11 12 11 10 7 12 8 5 5 12 6 12 9 12 11 12 11 12 11 12 11 12 9 12 8 12 11 10 9 12 5 11 8 12 10 11 8 12 8 12 9 12 9 4 5 11 7 10 12 12 10 12 8 3 6 12 9 8 7 2 8 7 2 9 7 10 6 12 10 12 10 9 6 10 10 10 10 11 8 9 8 11 9 10 9 11 10 11 10 12 12 12 11 11 9 6 7 12 9 8 7 12 11 11 10 12 8 11 7 12 12 11 9 12 12 5 2 4 7 12 12 8 8 12 8 12 10 12 10 10 10 11 10 11 4 10 5 6 6 | |||||||||||||||||||||||||||||||||||||||||||||||||||||||||||||||||||||||||||||
Tables (Output of Computation) | |||||||||||||||||||||||||||||||||||||||||||||||||||||||||||||||||||||||||||||
| |||||||||||||||||||||||||||||||||||||||||||||||||||||||||||||||||||||||||||||
Figures (Output of Computation) | |||||||||||||||||||||||||||||||||||||||||||||||||||||||||||||||||||||||||||||
Input Parameters & R Code | |||||||||||||||||||||||||||||||||||||||||||||||||||||||||||||||||||||||||||||
| Parameters (Session): | |||||||||||||||||||||||||||||||||||||||||||||||||||||||||||||||||||||||||||||
| par1 = pearson ; | |||||||||||||||||||||||||||||||||||||||||||||||||||||||||||||||||||||||||||||
| Parameters (R input): | |||||||||||||||||||||||||||||||||||||||||||||||||||||||||||||||||||||||||||||
| par1 = pearson ; | |||||||||||||||||||||||||||||||||||||||||||||||||||||||||||||||||||||||||||||
| R code (references can be found in the software module): | |||||||||||||||||||||||||||||||||||||||||||||||||||||||||||||||||||||||||||||
panel.tau <- function(x, y, digits=2, prefix='', cex.cor) | |||||||||||||||||||||||||||||||||||||||||||||||||||||||||||||||||||||||||||||