\begin{tabular}{lllllllll}
\hline
Summary of computational transaction \tabularnewline
Raw Input & view raw input (R code)  \tabularnewline
Raw Output & view raw output of R engine  \tabularnewline
Computing time & 1 seconds \tabularnewline
R Server & 'Gwilym Jenkins' @ jenkins.wessa.net \tabularnewline
\hline
\end{tabular}
%Source: https://freestatistics.org/blog/index.php?pk=162643&T=0
[TABLE]
[ROW][C]Summary of computational transaction[/C][/ROW]
[ROW][C]Raw Input[/C][C]view raw input (R code) [/C][/ROW]
[ROW][C]Raw Output[/C][C]view raw output of R engine [/C][/ROW]
[ROW][C]Computing time[/C][C]1 seconds[/C][/ROW]
[ROW][C]R Server[/C][C]'Gwilym Jenkins' @ jenkins.wessa.net[/C][/ROW]
[/TABLE]
Source: https://freestatistics.org/blog/index.php?pk=162643&T=0
If you paste this QR Code into your document, anyone with a smartphone or tablet will be able to scan it and view this table in a browser.
If you paste this QR Code into your document, anyone with a smartphone or tablet will be able to scan it and view this table in a browser.
If you paste this QR Code into your document, anyone with a smartphone or tablet will be able to scan it and view this table in a browser.
If you paste this QR Code into your document, anyone with a smartphone or tablet will be able to scan it and view this table in a browser.
If you paste this QR Code into your document, anyone with a smartphone or tablet will be able to scan it and view this table in a browser.
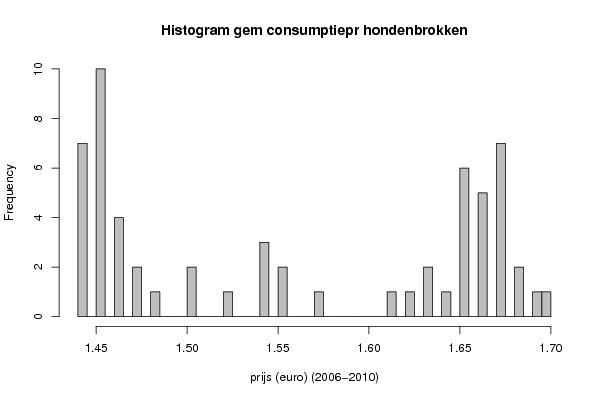
| Frequency Table (Histogram) | | Bins | Midpoint | Abs. Frequency | Rel. Frequency | Cumul. Rel. Freq. | Density | | [1.44,1.445[ | 1.4425 | 7 | 0.116667 | 0.116667 | 23.333333 | | [1.445,1.45[ | 1.4475 | 0 | 0 | 0.116667 | 0 | | [1.45,1.455[ | 1.4525 | 10 | 0.166667 | 0.283333 | 33.333333 | | [1.455,1.46[ | 1.4575 | 0 | 0 | 0.283333 | 0 | | [1.46,1.465[ | 1.4625 | 4 | 0.066667 | 0.35 | 13.333333 | | [1.465,1.47[ | 1.4675 | 0 | 0 | 0.35 | 0 | | [1.47,1.475[ | 1.4725 | 2 | 0.033333 | 0.383333 | 6.666667 | | [1.475,1.48[ | 1.4775 | 0 | 0 | 0.383333 | 0 | | [1.48,1.485[ | 1.4825 | 1 | 0.016667 | 0.4 | 3.333333 | | [1.485,1.49[ | 1.4875 | 0 | 0 | 0.4 | 0 | | [1.49,1.495[ | 1.4925 | 0 | 0 | 0.4 | 0 | | [1.495,1.5[ | 1.4975 | 0 | 0 | 0.4 | 0 | | [1.5,1.505[ | 1.5025 | 2 | 0.033333 | 0.433333 | 6.666667 | | [1.505,1.51[ | 1.5075 | 0 | 0 | 0.433333 | 0 | | [1.51,1.515[ | 1.5125 | 0 | 0 | 0.433333 | 0 | | [1.515,1.52[ | 1.5175 | 0 | 0 | 0.433333 | 0 | | [1.52,1.525[ | 1.5225 | 1 | 0.016667 | 0.45 | 3.333333 | | [1.525,1.53[ | 1.5275 | 0 | 0 | 0.45 | 0 | | [1.53,1.535[ | 1.5325 | 0 | 0 | 0.45 | 0 | | [1.535,1.54[ | 1.5375 | 0 | 0 | 0.45 | 0 | | [1.54,1.545[ | 1.5425 | 3 | 0.05 | 0.5 | 10 | | [1.545,1.55[ | 1.5475 | 0 | 0 | 0.5 | 0 | | [1.55,1.555[ | 1.5525 | 2 | 0.033333 | 0.533333 | 6.666667 | | [1.555,1.56[ | 1.5575 | 0 | 0 | 0.533333 | 0 | | [1.56,1.565[ | 1.5625 | 0 | 0 | 0.533333 | 0 | | [1.565,1.57[ | 1.5675 | 0 | 0 | 0.533333 | 0 | | [1.57,1.575[ | 1.5725 | 1 | 0.016667 | 0.55 | 3.333333 | | [1.575,1.58[ | 1.5775 | 0 | 0 | 0.55 | 0 | | [1.58,1.585[ | 1.5825 | 0 | 0 | 0.55 | 0 | | [1.585,1.59[ | 1.5875 | 0 | 0 | 0.55 | 0 | | [1.59,1.595[ | 1.5925 | 0 | 0 | 0.55 | 0 | | [1.595,1.6[ | 1.5975 | 0 | 0 | 0.55 | 0 | | [1.6,1.605[ | 1.6025 | 0 | 0 | 0.55 | 0 | | [1.605,1.61[ | 1.6075 | 0 | 0 | 0.55 | 0 | | [1.61,1.615[ | 1.6125 | 1 | 0.016667 | 0.566667 | 3.333333 | | [1.615,1.62[ | 1.6175 | 0 | 0 | 0.566667 | 0 | | [1.62,1.625[ | 1.6225 | 1 | 0.016667 | 0.583333 | 3.333333 | | [1.625,1.63[ | 1.6275 | 0 | 0 | 0.583333 | 0 | | [1.63,1.635[ | 1.6325 | 2 | 0.033333 | 0.616667 | 6.666667 | | [1.635,1.64[ | 1.6375 | 0 | 0 | 0.616667 | 0 | | [1.64,1.645[ | 1.6425 | 1 | 0.016667 | 0.633333 | 3.333333 | | [1.645,1.65[ | 1.6475 | 0 | 0 | 0.633333 | 0 | | [1.65,1.655[ | 1.6525 | 6 | 0.1 | 0.733333 | 20 | | [1.655,1.66[ | 1.6575 | 0 | 0 | 0.733333 | 0 | | [1.66,1.665[ | 1.6625 | 5 | 0.083333 | 0.816667 | 16.666667 | | [1.665,1.67[ | 1.6675 | 0 | 0 | 0.816667 | 0 | | [1.67,1.675[ | 1.6725 | 7 | 0.116667 | 0.933333 | 23.333333 | | [1.675,1.68[ | 1.6775 | 0 | 0 | 0.933333 | 0 | | [1.68,1.685[ | 1.6825 | 2 | 0.033333 | 0.966667 | 6.666667 | | [1.685,1.69[ | 1.6875 | 0 | 0 | 0.966667 | 0 | | [1.69,1.695[ | 1.6925 | 1 | 0.016667 | 0.983333 | 3.333333 | | [1.695,1.7] | 1.6975 | 1 | 0.016667 | 1 | 3.333333 |
\begin{tabular}{lllllllll}
\hline
Frequency Table (Histogram) \tabularnewline
Bins & Midpoint & Abs. Frequency & Rel. Frequency & Cumul. Rel. Freq. & Density \tabularnewline
[1.44,1.445[ & 1.4425 & 7 & 0.116667 & 0.116667 & 23.333333 \tabularnewline
[1.445,1.45[ & 1.4475 & 0 & 0 & 0.116667 & 0 \tabularnewline
[1.45,1.455[ & 1.4525 & 10 & 0.166667 & 0.283333 & 33.333333 \tabularnewline
[1.455,1.46[ & 1.4575 & 0 & 0 & 0.283333 & 0 \tabularnewline
[1.46,1.465[ & 1.4625 & 4 & 0.066667 & 0.35 & 13.333333 \tabularnewline
[1.465,1.47[ & 1.4675 & 0 & 0 & 0.35 & 0 \tabularnewline
[1.47,1.475[ & 1.4725 & 2 & 0.033333 & 0.383333 & 6.666667 \tabularnewline
[1.475,1.48[ & 1.4775 & 0 & 0 & 0.383333 & 0 \tabularnewline
[1.48,1.485[ & 1.4825 & 1 & 0.016667 & 0.4 & 3.333333 \tabularnewline
[1.485,1.49[ & 1.4875 & 0 & 0 & 0.4 & 0 \tabularnewline
[1.49,1.495[ & 1.4925 & 0 & 0 & 0.4 & 0 \tabularnewline
[1.495,1.5[ & 1.4975 & 0 & 0 & 0.4 & 0 \tabularnewline
[1.5,1.505[ & 1.5025 & 2 & 0.033333 & 0.433333 & 6.666667 \tabularnewline
[1.505,1.51[ & 1.5075 & 0 & 0 & 0.433333 & 0 \tabularnewline
[1.51,1.515[ & 1.5125 & 0 & 0 & 0.433333 & 0 \tabularnewline
[1.515,1.52[ & 1.5175 & 0 & 0 & 0.433333 & 0 \tabularnewline
[1.52,1.525[ & 1.5225 & 1 & 0.016667 & 0.45 & 3.333333 \tabularnewline
[1.525,1.53[ & 1.5275 & 0 & 0 & 0.45 & 0 \tabularnewline
[1.53,1.535[ & 1.5325 & 0 & 0 & 0.45 & 0 \tabularnewline
[1.535,1.54[ & 1.5375 & 0 & 0 & 0.45 & 0 \tabularnewline
[1.54,1.545[ & 1.5425 & 3 & 0.05 & 0.5 & 10 \tabularnewline
[1.545,1.55[ & 1.5475 & 0 & 0 & 0.5 & 0 \tabularnewline
[1.55,1.555[ & 1.5525 & 2 & 0.033333 & 0.533333 & 6.666667 \tabularnewline
[1.555,1.56[ & 1.5575 & 0 & 0 & 0.533333 & 0 \tabularnewline
[1.56,1.565[ & 1.5625 & 0 & 0 & 0.533333 & 0 \tabularnewline
[1.565,1.57[ & 1.5675 & 0 & 0 & 0.533333 & 0 \tabularnewline
[1.57,1.575[ & 1.5725 & 1 & 0.016667 & 0.55 & 3.333333 \tabularnewline
[1.575,1.58[ & 1.5775 & 0 & 0 & 0.55 & 0 \tabularnewline
[1.58,1.585[ & 1.5825 & 0 & 0 & 0.55 & 0 \tabularnewline
[1.585,1.59[ & 1.5875 & 0 & 0 & 0.55 & 0 \tabularnewline
[1.59,1.595[ & 1.5925 & 0 & 0 & 0.55 & 0 \tabularnewline
[1.595,1.6[ & 1.5975 & 0 & 0 & 0.55 & 0 \tabularnewline
[1.6,1.605[ & 1.6025 & 0 & 0 & 0.55 & 0 \tabularnewline
[1.605,1.61[ & 1.6075 & 0 & 0 & 0.55 & 0 \tabularnewline
[1.61,1.615[ & 1.6125 & 1 & 0.016667 & 0.566667 & 3.333333 \tabularnewline
[1.615,1.62[ & 1.6175 & 0 & 0 & 0.566667 & 0 \tabularnewline
[1.62,1.625[ & 1.6225 & 1 & 0.016667 & 0.583333 & 3.333333 \tabularnewline
[1.625,1.63[ & 1.6275 & 0 & 0 & 0.583333 & 0 \tabularnewline
[1.63,1.635[ & 1.6325 & 2 & 0.033333 & 0.616667 & 6.666667 \tabularnewline
[1.635,1.64[ & 1.6375 & 0 & 0 & 0.616667 & 0 \tabularnewline
[1.64,1.645[ & 1.6425 & 1 & 0.016667 & 0.633333 & 3.333333 \tabularnewline
[1.645,1.65[ & 1.6475 & 0 & 0 & 0.633333 & 0 \tabularnewline
[1.65,1.655[ & 1.6525 & 6 & 0.1 & 0.733333 & 20 \tabularnewline
[1.655,1.66[ & 1.6575 & 0 & 0 & 0.733333 & 0 \tabularnewline
[1.66,1.665[ & 1.6625 & 5 & 0.083333 & 0.816667 & 16.666667 \tabularnewline
[1.665,1.67[ & 1.6675 & 0 & 0 & 0.816667 & 0 \tabularnewline
[1.67,1.675[ & 1.6725 & 7 & 0.116667 & 0.933333 & 23.333333 \tabularnewline
[1.675,1.68[ & 1.6775 & 0 & 0 & 0.933333 & 0 \tabularnewline
[1.68,1.685[ & 1.6825 & 2 & 0.033333 & 0.966667 & 6.666667 \tabularnewline
[1.685,1.69[ & 1.6875 & 0 & 0 & 0.966667 & 0 \tabularnewline
[1.69,1.695[ & 1.6925 & 1 & 0.016667 & 0.983333 & 3.333333 \tabularnewline
[1.695,1.7] & 1.6975 & 1 & 0.016667 & 1 & 3.333333 \tabularnewline
\hline
\end{tabular}
%Source: https://freestatistics.org/blog/index.php?pk=162643&T=1
[TABLE]
[ROW][C]Frequency Table (Histogram)[/C][/ROW]
[ROW][C]Bins[/C][C]Midpoint[/C][C]Abs. Frequency[/C][C]Rel. Frequency[/C][C]Cumul. Rel. Freq.[/C][C]Density[/C][/ROW]
[ROW][C][1.44,1.445[[/C][C]1.4425[/C][C]7[/C][C]0.116667[/C][C]0.116667[/C][C]23.333333[/C][/ROW]
[ROW][C][1.445,1.45[[/C][C]1.4475[/C][C]0[/C][C]0[/C][C]0.116667[/C][C]0[/C][/ROW]
[ROW][C][1.45,1.455[[/C][C]1.4525[/C][C]10[/C][C]0.166667[/C][C]0.283333[/C][C]33.333333[/C][/ROW]
[ROW][C][1.455,1.46[[/C][C]1.4575[/C][C]0[/C][C]0[/C][C]0.283333[/C][C]0[/C][/ROW]
[ROW][C][1.46,1.465[[/C][C]1.4625[/C][C]4[/C][C]0.066667[/C][C]0.35[/C][C]13.333333[/C][/ROW]
[ROW][C][1.465,1.47[[/C][C]1.4675[/C][C]0[/C][C]0[/C][C]0.35[/C][C]0[/C][/ROW]
[ROW][C][1.47,1.475[[/C][C]1.4725[/C][C]2[/C][C]0.033333[/C][C]0.383333[/C][C]6.666667[/C][/ROW]
[ROW][C][1.475,1.48[[/C][C]1.4775[/C][C]0[/C][C]0[/C][C]0.383333[/C][C]0[/C][/ROW]
[ROW][C][1.48,1.485[[/C][C]1.4825[/C][C]1[/C][C]0.016667[/C][C]0.4[/C][C]3.333333[/C][/ROW]
[ROW][C][1.485,1.49[[/C][C]1.4875[/C][C]0[/C][C]0[/C][C]0.4[/C][C]0[/C][/ROW]
[ROW][C][1.49,1.495[[/C][C]1.4925[/C][C]0[/C][C]0[/C][C]0.4[/C][C]0[/C][/ROW]
[ROW][C][1.495,1.5[[/C][C]1.4975[/C][C]0[/C][C]0[/C][C]0.4[/C][C]0[/C][/ROW]
[ROW][C][1.5,1.505[[/C][C]1.5025[/C][C]2[/C][C]0.033333[/C][C]0.433333[/C][C]6.666667[/C][/ROW]
[ROW][C][1.505,1.51[[/C][C]1.5075[/C][C]0[/C][C]0[/C][C]0.433333[/C][C]0[/C][/ROW]
[ROW][C][1.51,1.515[[/C][C]1.5125[/C][C]0[/C][C]0[/C][C]0.433333[/C][C]0[/C][/ROW]
[ROW][C][1.515,1.52[[/C][C]1.5175[/C][C]0[/C][C]0[/C][C]0.433333[/C][C]0[/C][/ROW]
[ROW][C][1.52,1.525[[/C][C]1.5225[/C][C]1[/C][C]0.016667[/C][C]0.45[/C][C]3.333333[/C][/ROW]
[ROW][C][1.525,1.53[[/C][C]1.5275[/C][C]0[/C][C]0[/C][C]0.45[/C][C]0[/C][/ROW]
[ROW][C][1.53,1.535[[/C][C]1.5325[/C][C]0[/C][C]0[/C][C]0.45[/C][C]0[/C][/ROW]
[ROW][C][1.535,1.54[[/C][C]1.5375[/C][C]0[/C][C]0[/C][C]0.45[/C][C]0[/C][/ROW]
[ROW][C][1.54,1.545[[/C][C]1.5425[/C][C]3[/C][C]0.05[/C][C]0.5[/C][C]10[/C][/ROW]
[ROW][C][1.545,1.55[[/C][C]1.5475[/C][C]0[/C][C]0[/C][C]0.5[/C][C]0[/C][/ROW]
[ROW][C][1.55,1.555[[/C][C]1.5525[/C][C]2[/C][C]0.033333[/C][C]0.533333[/C][C]6.666667[/C][/ROW]
[ROW][C][1.555,1.56[[/C][C]1.5575[/C][C]0[/C][C]0[/C][C]0.533333[/C][C]0[/C][/ROW]
[ROW][C][1.56,1.565[[/C][C]1.5625[/C][C]0[/C][C]0[/C][C]0.533333[/C][C]0[/C][/ROW]
[ROW][C][1.565,1.57[[/C][C]1.5675[/C][C]0[/C][C]0[/C][C]0.533333[/C][C]0[/C][/ROW]
[ROW][C][1.57,1.575[[/C][C]1.5725[/C][C]1[/C][C]0.016667[/C][C]0.55[/C][C]3.333333[/C][/ROW]
[ROW][C][1.575,1.58[[/C][C]1.5775[/C][C]0[/C][C]0[/C][C]0.55[/C][C]0[/C][/ROW]
[ROW][C][1.58,1.585[[/C][C]1.5825[/C][C]0[/C][C]0[/C][C]0.55[/C][C]0[/C][/ROW]
[ROW][C][1.585,1.59[[/C][C]1.5875[/C][C]0[/C][C]0[/C][C]0.55[/C][C]0[/C][/ROW]
[ROW][C][1.59,1.595[[/C][C]1.5925[/C][C]0[/C][C]0[/C][C]0.55[/C][C]0[/C][/ROW]
[ROW][C][1.595,1.6[[/C][C]1.5975[/C][C]0[/C][C]0[/C][C]0.55[/C][C]0[/C][/ROW]
[ROW][C][1.6,1.605[[/C][C]1.6025[/C][C]0[/C][C]0[/C][C]0.55[/C][C]0[/C][/ROW]
[ROW][C][1.605,1.61[[/C][C]1.6075[/C][C]0[/C][C]0[/C][C]0.55[/C][C]0[/C][/ROW]
[ROW][C][1.61,1.615[[/C][C]1.6125[/C][C]1[/C][C]0.016667[/C][C]0.566667[/C][C]3.333333[/C][/ROW]
[ROW][C][1.615,1.62[[/C][C]1.6175[/C][C]0[/C][C]0[/C][C]0.566667[/C][C]0[/C][/ROW]
[ROW][C][1.62,1.625[[/C][C]1.6225[/C][C]1[/C][C]0.016667[/C][C]0.583333[/C][C]3.333333[/C][/ROW]
[ROW][C][1.625,1.63[[/C][C]1.6275[/C][C]0[/C][C]0[/C][C]0.583333[/C][C]0[/C][/ROW]
[ROW][C][1.63,1.635[[/C][C]1.6325[/C][C]2[/C][C]0.033333[/C][C]0.616667[/C][C]6.666667[/C][/ROW]
[ROW][C][1.635,1.64[[/C][C]1.6375[/C][C]0[/C][C]0[/C][C]0.616667[/C][C]0[/C][/ROW]
[ROW][C][1.64,1.645[[/C][C]1.6425[/C][C]1[/C][C]0.016667[/C][C]0.633333[/C][C]3.333333[/C][/ROW]
[ROW][C][1.645,1.65[[/C][C]1.6475[/C][C]0[/C][C]0[/C][C]0.633333[/C][C]0[/C][/ROW]
[ROW][C][1.65,1.655[[/C][C]1.6525[/C][C]6[/C][C]0.1[/C][C]0.733333[/C][C]20[/C][/ROW]
[ROW][C][1.655,1.66[[/C][C]1.6575[/C][C]0[/C][C]0[/C][C]0.733333[/C][C]0[/C][/ROW]
[ROW][C][1.66,1.665[[/C][C]1.6625[/C][C]5[/C][C]0.083333[/C][C]0.816667[/C][C]16.666667[/C][/ROW]
[ROW][C][1.665,1.67[[/C][C]1.6675[/C][C]0[/C][C]0[/C][C]0.816667[/C][C]0[/C][/ROW]
[ROW][C][1.67,1.675[[/C][C]1.6725[/C][C]7[/C][C]0.116667[/C][C]0.933333[/C][C]23.333333[/C][/ROW]
[ROW][C][1.675,1.68[[/C][C]1.6775[/C][C]0[/C][C]0[/C][C]0.933333[/C][C]0[/C][/ROW]
[ROW][C][1.68,1.685[[/C][C]1.6825[/C][C]2[/C][C]0.033333[/C][C]0.966667[/C][C]6.666667[/C][/ROW]
[ROW][C][1.685,1.69[[/C][C]1.6875[/C][C]0[/C][C]0[/C][C]0.966667[/C][C]0[/C][/ROW]
[ROW][C][1.69,1.695[[/C][C]1.6925[/C][C]1[/C][C]0.016667[/C][C]0.983333[/C][C]3.333333[/C][/ROW]
[ROW][C][1.695,1.7][/C][C]1.6975[/C][C]1[/C][C]0.016667[/C][C]1[/C][C]3.333333[/C][/ROW]
[/TABLE]
Source: https://freestatistics.org/blog/index.php?pk=162643&T=1
Globally Unique Identifier (entire table): ba.freestatistics.org/blog/index.php?pk=162643&T=1
As an alternative you can also use a QR Code:
The GUIDs for individual cells are displayed in the table below:
| Frequency Table (Histogram) | | Bins | Midpoint | Abs. Frequency | Rel. Frequency | Cumul. Rel. Freq. | Density | | [1.44,1.445[ | 1.4425 | 7 | 0.116667 | 0.116667 | 23.333333 | | [1.445,1.45[ | 1.4475 | 0 | 0 | 0.116667 | 0 | | [1.45,1.455[ | 1.4525 | 10 | 0.166667 | 0.283333 | 33.333333 | | [1.455,1.46[ | 1.4575 | 0 | 0 | 0.283333 | 0 | | [1.46,1.465[ | 1.4625 | 4 | 0.066667 | 0.35 | 13.333333 | | [1.465,1.47[ | 1.4675 | 0 | 0 | 0.35 | 0 | | [1.47,1.475[ | 1.4725 | 2 | 0.033333 | 0.383333 | 6.666667 | | [1.475,1.48[ | 1.4775 | 0 | 0 | 0.383333 | 0 | | [1.48,1.485[ | 1.4825 | 1 | 0.016667 | 0.4 | 3.333333 | | [1.485,1.49[ | 1.4875 | 0 | 0 | 0.4 | 0 | | [1.49,1.495[ | 1.4925 | 0 | 0 | 0.4 | 0 | | [1.495,1.5[ | 1.4975 | 0 | 0 | 0.4 | 0 | | [1.5,1.505[ | 1.5025 | 2 | 0.033333 | 0.433333 | 6.666667 | | [1.505,1.51[ | 1.5075 | 0 | 0 | 0.433333 | 0 | | [1.51,1.515[ | 1.5125 | 0 | 0 | 0.433333 | 0 | | [1.515,1.52[ | 1.5175 | 0 | 0 | 0.433333 | 0 | | [1.52,1.525[ | 1.5225 | 1 | 0.016667 | 0.45 | 3.333333 | | [1.525,1.53[ | 1.5275 | 0 | 0 | 0.45 | 0 | | [1.53,1.535[ | 1.5325 | 0 | 0 | 0.45 | 0 | | [1.535,1.54[ | 1.5375 | 0 | 0 | 0.45 | 0 | | [1.54,1.545[ | 1.5425 | 3 | 0.05 | 0.5 | 10 | | [1.545,1.55[ | 1.5475 | 0 | 0 | 0.5 | 0 | | [1.55,1.555[ | 1.5525 | 2 | 0.033333 | 0.533333 | 6.666667 | | [1.555,1.56[ | 1.5575 | 0 | 0 | 0.533333 | 0 | | [1.56,1.565[ | 1.5625 | 0 | 0 | 0.533333 | 0 | | [1.565,1.57[ | 1.5675 | 0 | 0 | 0.533333 | 0 | | [1.57,1.575[ | 1.5725 | 1 | 0.016667 | 0.55 | 3.333333 | | [1.575,1.58[ | 1.5775 | 0 | 0 | 0.55 | 0 | | [1.58,1.585[ | 1.5825 | 0 | 0 | 0.55 | 0 | | [1.585,1.59[ | 1.5875 | 0 | 0 | 0.55 | 0 | | [1.59,1.595[ | 1.5925 | 0 | 0 | 0.55 | 0 | | [1.595,1.6[ | 1.5975 | 0 | 0 | 0.55 | 0 | | [1.6,1.605[ | 1.6025 | 0 | 0 | 0.55 | 0 | | [1.605,1.61[ | 1.6075 | 0 | 0 | 0.55 | 0 | | [1.61,1.615[ | 1.6125 | 1 | 0.016667 | 0.566667 | 3.333333 | | [1.615,1.62[ | 1.6175 | 0 | 0 | 0.566667 | 0 | | [1.62,1.625[ | 1.6225 | 1 | 0.016667 | 0.583333 | 3.333333 | | [1.625,1.63[ | 1.6275 | 0 | 0 | 0.583333 | 0 | | [1.63,1.635[ | 1.6325 | 2 | 0.033333 | 0.616667 | 6.666667 | | [1.635,1.64[ | 1.6375 | 0 | 0 | 0.616667 | 0 | | [1.64,1.645[ | 1.6425 | 1 | 0.016667 | 0.633333 | 3.333333 | | [1.645,1.65[ | 1.6475 | 0 | 0 | 0.633333 | 0 | | [1.65,1.655[ | 1.6525 | 6 | 0.1 | 0.733333 | 20 | | [1.655,1.66[ | 1.6575 | 0 | 0 | 0.733333 | 0 | | [1.66,1.665[ | 1.6625 | 5 | 0.083333 | 0.816667 | 16.666667 | | [1.665,1.67[ | 1.6675 | 0 | 0 | 0.816667 | 0 | | [1.67,1.675[ | 1.6725 | 7 | 0.116667 | 0.933333 | 23.333333 | | [1.675,1.68[ | 1.6775 | 0 | 0 | 0.933333 | 0 | | [1.68,1.685[ | 1.6825 | 2 | 0.033333 | 0.966667 | 6.666667 | | [1.685,1.69[ | 1.6875 | 0 | 0 | 0.966667 | 0 | | [1.69,1.695[ | 1.6925 | 1 | 0.016667 | 0.983333 | 3.333333 | | [1.695,1.7] | 1.6975 | 1 | 0.016667 | 1 | 3.333333 |
If you paste this QR Code into your document, anyone with a smartphone or tablet will be able to scan it and view this table in a browser.
If you paste this QR Code into your document, anyone with a smartphone or tablet will be able to scan it and view this table in a browser.
If you paste this QR Code into your document, anyone with a smartphone or tablet will be able to scan it and view this table in a browser.
If you paste this QR Code into your document, anyone with a smartphone or tablet will be able to scan it and view this table in a browser.
If you paste this QR Code into your document, anyone with a smartphone or tablet will be able to scan it and view this table in a browser.
|