\begin{tabular}{lllllllll}
\hline
Summary of computational transaction \tabularnewline
Raw Input & view raw input (R code)  \tabularnewline
Raw Output & view raw output of R engine  \tabularnewline
Computing time & 1 seconds \tabularnewline
R Server & 'Herman Ole Andreas Wold' @ wold.wessa.net \tabularnewline
\hline
\end{tabular}
%Source: https://freestatistics.org/blog/index.php?pk=162352&T=0
[TABLE]
[ROW][C]Summary of computational transaction[/C][/ROW]
[ROW][C]Raw Input[/C][C]view raw input (R code) [/C][/ROW]
[ROW][C]Raw Output[/C][C]view raw output of R engine [/C][/ROW]
[ROW][C]Computing time[/C][C]1 seconds[/C][/ROW]
[ROW][C]R Server[/C][C]'Herman Ole Andreas Wold' @ wold.wessa.net[/C][/ROW]
[/TABLE]
Source: https://freestatistics.org/blog/index.php?pk=162352&T=0
If you paste this QR Code into your document, anyone with a smartphone or tablet will be able to scan it and view this table in a browser.
If you paste this QR Code into your document, anyone with a smartphone or tablet will be able to scan it and view this table in a browser.
If you paste this QR Code into your document, anyone with a smartphone or tablet will be able to scan it and view this table in a browser.
If you paste this QR Code into your document, anyone with a smartphone or tablet will be able to scan it and view this table in a browser.
If you paste this QR Code into your document, anyone with a smartphone or tablet will be able to scan it and view this table in a browser.
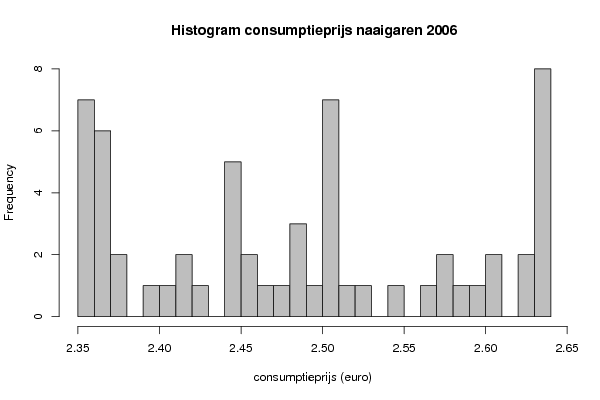
| Frequency Table (Histogram) | | Bins | Midpoint | Abs. Frequency | Rel. Frequency | Cumul. Rel. Freq. | Density | | [2.35,2.36[ | 2.355 | 7 | 0.116667 | 0.116667 | 11.666667 | | [2.36,2.37[ | 2.365 | 6 | 0.1 | 0.216667 | 10 | | [2.37,2.38[ | 2.375 | 2 | 0.033333 | 0.25 | 3.333333 | | [2.38,2.39[ | 2.385 | 0 | 0 | 0.25 | 0 | | [2.39,2.4[ | 2.395 | 1 | 0.016667 | 0.266667 | 1.666667 | | [2.4,2.41[ | 2.405 | 1 | 0.016667 | 0.283333 | 1.666667 | | [2.41,2.42[ | 2.415 | 2 | 0.033333 | 0.316667 | 3.333333 | | [2.42,2.43[ | 2.425 | 1 | 0.016667 | 0.333333 | 1.666667 | | [2.43,2.44[ | 2.435 | 0 | 0 | 0.333333 | 0 | | [2.44,2.45[ | 2.445 | 5 | 0.083333 | 0.416667 | 8.333333 | | [2.45,2.46[ | 2.455 | 2 | 0.033333 | 0.45 | 3.333333 | | [2.46,2.47[ | 2.465 | 1 | 0.016667 | 0.466667 | 1.666667 | | [2.47,2.48[ | 2.475 | 1 | 0.016667 | 0.483333 | 1.666667 | | [2.48,2.49[ | 2.485 | 3 | 0.05 | 0.533333 | 5 | | [2.49,2.5[ | 2.495 | 1 | 0.016667 | 0.55 | 1.666667 | | [2.5,2.51[ | 2.505 | 7 | 0.116667 | 0.666667 | 11.666667 | | [2.51,2.52[ | 2.515 | 1 | 0.016667 | 0.683333 | 1.666667 | | [2.52,2.53[ | 2.525 | 1 | 0.016667 | 0.7 | 1.666667 | | [2.53,2.54[ | 2.535 | 0 | 0 | 0.7 | 0 | | [2.54,2.55[ | 2.545 | 1 | 0.016667 | 0.716667 | 1.666667 | | [2.55,2.56[ | 2.555 | 0 | 0 | 0.716667 | 0 | | [2.56,2.57[ | 2.565 | 1 | 0.016667 | 0.733333 | 1.666667 | | [2.57,2.58[ | 2.575 | 2 | 0.033333 | 0.766667 | 3.333333 | | [2.58,2.59[ | 2.585 | 1 | 0.016667 | 0.783333 | 1.666667 | | [2.59,2.6[ | 2.595 | 1 | 0.016667 | 0.8 | 1.666667 | | [2.6,2.61[ | 2.605 | 2 | 0.033333 | 0.833333 | 3.333333 | | [2.61,2.62[ | 2.615 | 0 | 0 | 0.833333 | 0 | | [2.62,2.63[ | 2.625 | 2 | 0.033333 | 0.866667 | 3.333333 | | [2.63,2.64] | 2.635 | 8 | 0.133333 | 1 | 13.333333 |
\begin{tabular}{lllllllll}
\hline
Frequency Table (Histogram) \tabularnewline
Bins & Midpoint & Abs. Frequency & Rel. Frequency & Cumul. Rel. Freq. & Density \tabularnewline
[2.35,2.36[ & 2.355 & 7 & 0.116667 & 0.116667 & 11.666667 \tabularnewline
[2.36,2.37[ & 2.365 & 6 & 0.1 & 0.216667 & 10 \tabularnewline
[2.37,2.38[ & 2.375 & 2 & 0.033333 & 0.25 & 3.333333 \tabularnewline
[2.38,2.39[ & 2.385 & 0 & 0 & 0.25 & 0 \tabularnewline
[2.39,2.4[ & 2.395 & 1 & 0.016667 & 0.266667 & 1.666667 \tabularnewline
[2.4,2.41[ & 2.405 & 1 & 0.016667 & 0.283333 & 1.666667 \tabularnewline
[2.41,2.42[ & 2.415 & 2 & 0.033333 & 0.316667 & 3.333333 \tabularnewline
[2.42,2.43[ & 2.425 & 1 & 0.016667 & 0.333333 & 1.666667 \tabularnewline
[2.43,2.44[ & 2.435 & 0 & 0 & 0.333333 & 0 \tabularnewline
[2.44,2.45[ & 2.445 & 5 & 0.083333 & 0.416667 & 8.333333 \tabularnewline
[2.45,2.46[ & 2.455 & 2 & 0.033333 & 0.45 & 3.333333 \tabularnewline
[2.46,2.47[ & 2.465 & 1 & 0.016667 & 0.466667 & 1.666667 \tabularnewline
[2.47,2.48[ & 2.475 & 1 & 0.016667 & 0.483333 & 1.666667 \tabularnewline
[2.48,2.49[ & 2.485 & 3 & 0.05 & 0.533333 & 5 \tabularnewline
[2.49,2.5[ & 2.495 & 1 & 0.016667 & 0.55 & 1.666667 \tabularnewline
[2.5,2.51[ & 2.505 & 7 & 0.116667 & 0.666667 & 11.666667 \tabularnewline
[2.51,2.52[ & 2.515 & 1 & 0.016667 & 0.683333 & 1.666667 \tabularnewline
[2.52,2.53[ & 2.525 & 1 & 0.016667 & 0.7 & 1.666667 \tabularnewline
[2.53,2.54[ & 2.535 & 0 & 0 & 0.7 & 0 \tabularnewline
[2.54,2.55[ & 2.545 & 1 & 0.016667 & 0.716667 & 1.666667 \tabularnewline
[2.55,2.56[ & 2.555 & 0 & 0 & 0.716667 & 0 \tabularnewline
[2.56,2.57[ & 2.565 & 1 & 0.016667 & 0.733333 & 1.666667 \tabularnewline
[2.57,2.58[ & 2.575 & 2 & 0.033333 & 0.766667 & 3.333333 \tabularnewline
[2.58,2.59[ & 2.585 & 1 & 0.016667 & 0.783333 & 1.666667 \tabularnewline
[2.59,2.6[ & 2.595 & 1 & 0.016667 & 0.8 & 1.666667 \tabularnewline
[2.6,2.61[ & 2.605 & 2 & 0.033333 & 0.833333 & 3.333333 \tabularnewline
[2.61,2.62[ & 2.615 & 0 & 0 & 0.833333 & 0 \tabularnewline
[2.62,2.63[ & 2.625 & 2 & 0.033333 & 0.866667 & 3.333333 \tabularnewline
[2.63,2.64] & 2.635 & 8 & 0.133333 & 1 & 13.333333 \tabularnewline
\hline
\end{tabular}
%Source: https://freestatistics.org/blog/index.php?pk=162352&T=1
[TABLE]
[ROW][C]Frequency Table (Histogram)[/C][/ROW]
[ROW][C]Bins[/C][C]Midpoint[/C][C]Abs. Frequency[/C][C]Rel. Frequency[/C][C]Cumul. Rel. Freq.[/C][C]Density[/C][/ROW]
[ROW][C][2.35,2.36[[/C][C]2.355[/C][C]7[/C][C]0.116667[/C][C]0.116667[/C][C]11.666667[/C][/ROW]
[ROW][C][2.36,2.37[[/C][C]2.365[/C][C]6[/C][C]0.1[/C][C]0.216667[/C][C]10[/C][/ROW]
[ROW][C][2.37,2.38[[/C][C]2.375[/C][C]2[/C][C]0.033333[/C][C]0.25[/C][C]3.333333[/C][/ROW]
[ROW][C][2.38,2.39[[/C][C]2.385[/C][C]0[/C][C]0[/C][C]0.25[/C][C]0[/C][/ROW]
[ROW][C][2.39,2.4[[/C][C]2.395[/C][C]1[/C][C]0.016667[/C][C]0.266667[/C][C]1.666667[/C][/ROW]
[ROW][C][2.4,2.41[[/C][C]2.405[/C][C]1[/C][C]0.016667[/C][C]0.283333[/C][C]1.666667[/C][/ROW]
[ROW][C][2.41,2.42[[/C][C]2.415[/C][C]2[/C][C]0.033333[/C][C]0.316667[/C][C]3.333333[/C][/ROW]
[ROW][C][2.42,2.43[[/C][C]2.425[/C][C]1[/C][C]0.016667[/C][C]0.333333[/C][C]1.666667[/C][/ROW]
[ROW][C][2.43,2.44[[/C][C]2.435[/C][C]0[/C][C]0[/C][C]0.333333[/C][C]0[/C][/ROW]
[ROW][C][2.44,2.45[[/C][C]2.445[/C][C]5[/C][C]0.083333[/C][C]0.416667[/C][C]8.333333[/C][/ROW]
[ROW][C][2.45,2.46[[/C][C]2.455[/C][C]2[/C][C]0.033333[/C][C]0.45[/C][C]3.333333[/C][/ROW]
[ROW][C][2.46,2.47[[/C][C]2.465[/C][C]1[/C][C]0.016667[/C][C]0.466667[/C][C]1.666667[/C][/ROW]
[ROW][C][2.47,2.48[[/C][C]2.475[/C][C]1[/C][C]0.016667[/C][C]0.483333[/C][C]1.666667[/C][/ROW]
[ROW][C][2.48,2.49[[/C][C]2.485[/C][C]3[/C][C]0.05[/C][C]0.533333[/C][C]5[/C][/ROW]
[ROW][C][2.49,2.5[[/C][C]2.495[/C][C]1[/C][C]0.016667[/C][C]0.55[/C][C]1.666667[/C][/ROW]
[ROW][C][2.5,2.51[[/C][C]2.505[/C][C]7[/C][C]0.116667[/C][C]0.666667[/C][C]11.666667[/C][/ROW]
[ROW][C][2.51,2.52[[/C][C]2.515[/C][C]1[/C][C]0.016667[/C][C]0.683333[/C][C]1.666667[/C][/ROW]
[ROW][C][2.52,2.53[[/C][C]2.525[/C][C]1[/C][C]0.016667[/C][C]0.7[/C][C]1.666667[/C][/ROW]
[ROW][C][2.53,2.54[[/C][C]2.535[/C][C]0[/C][C]0[/C][C]0.7[/C][C]0[/C][/ROW]
[ROW][C][2.54,2.55[[/C][C]2.545[/C][C]1[/C][C]0.016667[/C][C]0.716667[/C][C]1.666667[/C][/ROW]
[ROW][C][2.55,2.56[[/C][C]2.555[/C][C]0[/C][C]0[/C][C]0.716667[/C][C]0[/C][/ROW]
[ROW][C][2.56,2.57[[/C][C]2.565[/C][C]1[/C][C]0.016667[/C][C]0.733333[/C][C]1.666667[/C][/ROW]
[ROW][C][2.57,2.58[[/C][C]2.575[/C][C]2[/C][C]0.033333[/C][C]0.766667[/C][C]3.333333[/C][/ROW]
[ROW][C][2.58,2.59[[/C][C]2.585[/C][C]1[/C][C]0.016667[/C][C]0.783333[/C][C]1.666667[/C][/ROW]
[ROW][C][2.59,2.6[[/C][C]2.595[/C][C]1[/C][C]0.016667[/C][C]0.8[/C][C]1.666667[/C][/ROW]
[ROW][C][2.6,2.61[[/C][C]2.605[/C][C]2[/C][C]0.033333[/C][C]0.833333[/C][C]3.333333[/C][/ROW]
[ROW][C][2.61,2.62[[/C][C]2.615[/C][C]0[/C][C]0[/C][C]0.833333[/C][C]0[/C][/ROW]
[ROW][C][2.62,2.63[[/C][C]2.625[/C][C]2[/C][C]0.033333[/C][C]0.866667[/C][C]3.333333[/C][/ROW]
[ROW][C][2.63,2.64][/C][C]2.635[/C][C]8[/C][C]0.133333[/C][C]1[/C][C]13.333333[/C][/ROW]
[/TABLE]
Source: https://freestatistics.org/blog/index.php?pk=162352&T=1
Globally Unique Identifier (entire table): ba.freestatistics.org/blog/index.php?pk=162352&T=1
As an alternative you can also use a QR Code:
The GUIDs for individual cells are displayed in the table below:
| Frequency Table (Histogram) | | Bins | Midpoint | Abs. Frequency | Rel. Frequency | Cumul. Rel. Freq. | Density | | [2.35,2.36[ | 2.355 | 7 | 0.116667 | 0.116667 | 11.666667 | | [2.36,2.37[ | 2.365 | 6 | 0.1 | 0.216667 | 10 | | [2.37,2.38[ | 2.375 | 2 | 0.033333 | 0.25 | 3.333333 | | [2.38,2.39[ | 2.385 | 0 | 0 | 0.25 | 0 | | [2.39,2.4[ | 2.395 | 1 | 0.016667 | 0.266667 | 1.666667 | | [2.4,2.41[ | 2.405 | 1 | 0.016667 | 0.283333 | 1.666667 | | [2.41,2.42[ | 2.415 | 2 | 0.033333 | 0.316667 | 3.333333 | | [2.42,2.43[ | 2.425 | 1 | 0.016667 | 0.333333 | 1.666667 | | [2.43,2.44[ | 2.435 | 0 | 0 | 0.333333 | 0 | | [2.44,2.45[ | 2.445 | 5 | 0.083333 | 0.416667 | 8.333333 | | [2.45,2.46[ | 2.455 | 2 | 0.033333 | 0.45 | 3.333333 | | [2.46,2.47[ | 2.465 | 1 | 0.016667 | 0.466667 | 1.666667 | | [2.47,2.48[ | 2.475 | 1 | 0.016667 | 0.483333 | 1.666667 | | [2.48,2.49[ | 2.485 | 3 | 0.05 | 0.533333 | 5 | | [2.49,2.5[ | 2.495 | 1 | 0.016667 | 0.55 | 1.666667 | | [2.5,2.51[ | 2.505 | 7 | 0.116667 | 0.666667 | 11.666667 | | [2.51,2.52[ | 2.515 | 1 | 0.016667 | 0.683333 | 1.666667 | | [2.52,2.53[ | 2.525 | 1 | 0.016667 | 0.7 | 1.666667 | | [2.53,2.54[ | 2.535 | 0 | 0 | 0.7 | 0 | | [2.54,2.55[ | 2.545 | 1 | 0.016667 | 0.716667 | 1.666667 | | [2.55,2.56[ | 2.555 | 0 | 0 | 0.716667 | 0 | | [2.56,2.57[ | 2.565 | 1 | 0.016667 | 0.733333 | 1.666667 | | [2.57,2.58[ | 2.575 | 2 | 0.033333 | 0.766667 | 3.333333 | | [2.58,2.59[ | 2.585 | 1 | 0.016667 | 0.783333 | 1.666667 | | [2.59,2.6[ | 2.595 | 1 | 0.016667 | 0.8 | 1.666667 | | [2.6,2.61[ | 2.605 | 2 | 0.033333 | 0.833333 | 3.333333 | | [2.61,2.62[ | 2.615 | 0 | 0 | 0.833333 | 0 | | [2.62,2.63[ | 2.625 | 2 | 0.033333 | 0.866667 | 3.333333 | | [2.63,2.64] | 2.635 | 8 | 0.133333 | 1 | 13.333333 |
If you paste this QR Code into your document, anyone with a smartphone or tablet will be able to scan it and view this table in a browser.
If you paste this QR Code into your document, anyone with a smartphone or tablet will be able to scan it and view this table in a browser.
If you paste this QR Code into your document, anyone with a smartphone or tablet will be able to scan it and view this table in a browser.
If you paste this QR Code into your document, anyone with a smartphone or tablet will be able to scan it and view this table in a browser.
If you paste this QR Code into your document, anyone with a smartphone or tablet will be able to scan it and view this table in a browser.
|