Free Statistics

of Irreproducible Research!

Author's title

Author*Unverified author*
R Software Modulerwasp_exponentialsmoothing.wasp
Title produced by softwareExponential Smoothing
Date of computationSat, 29 Dec 2012 12:08:31 -0500
Cite this page as followsStatistical Computations at FreeStatistics.org, Office for Research Development and Education, URL https://freestatistics.org/blog/index.php?v=date/2012/Dec/29/t1356800947e0mj4cfesja3u3r.htm/, Retrieved Thu, 02 May 2024 00:46:51 +0000
Statistical Computations at FreeStatistics.org, Office for Research Development and Education, URL https://freestatistics.org/blog/index.php?pk=204896, Retrieved Thu, 02 May 2024 00:46:51 +0000
QR Codes:

Original text written by user:
IsPrivate?No (this computation is public)
User-defined keywords
Estimated Impact110
Family? (F = Feedback message, R = changed R code, M = changed R Module, P = changed Parameters, D = changed Data)
-       [Exponential Smoothing] [] [2012-12-29 17:08:31] [76c30f62b7052b57088120e90a652e05] [Current]
Feedback Forum

Post a new message
Dataseries X:
0,68
0,68
0,69
0,69
0,7
0,7
0,7
0,7
0,7
0,71
0,71
0,71
0,71
0,71
0,71
0,71
0,71
0,71
0,76
0,77
0,78
0,85
0,89
0,9
0,91
0,91
0,91
0,9
0,89
0,88
0,87
0,86
0,87
0,87
0,87
0,85
0,84
0,84
0,84
0,84
0,84
0,82
0,87
0,92
0,92
0,92
0,93
0,94
0,87
0,84
0,83
0,81
0,81
0,81
0,8
0,8
0,8
0,8
0,8
0,8
0,79
0,8
0,8
0,8
0,81
0,83
0,83
0,83
0,83
0,82
0,82
0,82


Summary of computational transaction
Raw Inputview raw input (R code)
Raw Outputview raw output of R engine
Computing time3 seconds
R Server'Sir Ronald Aylmer Fisher' @ fisher.wessa.net

\begin{tabular}{lllllllll}
\hline
Summary of computational transaction \tabularnewline
Raw Input & view raw input (R code)  \tabularnewline
Raw Output & view raw output of R engine  \tabularnewline
Computing time & 3 seconds \tabularnewline
R Server & 'Sir Ronald Aylmer Fisher' @ fisher.wessa.net \tabularnewline
\hline
\end{tabular}
%Source: https://freestatistics.org/blog/index.php?pk=204896&T=0

[TABLE]
[ROW][C]Summary of computational transaction[/C][/ROW]
[ROW][C]Raw Input[/C][C]view raw input (R code) [/C][/ROW]
[ROW][C]Raw Output[/C][C]view raw output of R engine [/C][/ROW]
[ROW][C]Computing time[/C][C]3 seconds[/C][/ROW]
[ROW][C]R Server[/C][C]'Sir Ronald Aylmer Fisher' @ fisher.wessa.net[/C][/ROW]
[/TABLE]
Source: https://freestatistics.org/blog/index.php?pk=204896&T=0

Globally Unique Identifier (entire table): ba.freestatistics.org/blog/index.php?pk=204896&T=0

As an alternative you can also use a QR Code:  

The GUIDs for individual cells are displayed in the table below:

Summary of computational transaction
Raw Inputview raw input (R code)
Raw Outputview raw output of R engine
Computing time3 seconds
R Server'Sir Ronald Aylmer Fisher' @ fisher.wessa.net


Estimated Parameters of Exponential Smoothing
ParameterValue
alpha1
beta0
gammaFALSE

\begin{tabular}{lllllllll}
\hline
Estimated Parameters of Exponential Smoothing \tabularnewline
Parameter & Value \tabularnewline
alpha & 1 \tabularnewline
beta & 0 \tabularnewline
gamma & FALSE \tabularnewline
\hline
\end{tabular}
%Source: https://freestatistics.org/blog/index.php?pk=204896&T=1

[TABLE]
[ROW][C]Estimated Parameters of Exponential Smoothing[/C][/ROW]
[ROW][C]Parameter[/C][C]Value[/C][/ROW]
[ROW][C]alpha[/C][C]1[/C][/ROW]
[ROW][C]beta[/C][C]0[/C][/ROW]
[ROW][C]gamma[/C][C]FALSE[/C][/ROW]
[/TABLE]
Source: https://freestatistics.org/blog/index.php?pk=204896&T=1

Globally Unique Identifier (entire table): ba.freestatistics.org/blog/index.php?pk=204896&T=1

As an alternative you can also use a QR Code:  

The GUIDs for individual cells are displayed in the table below:

Estimated Parameters of Exponential Smoothing
ParameterValue
alpha1
beta0
gammaFALSE


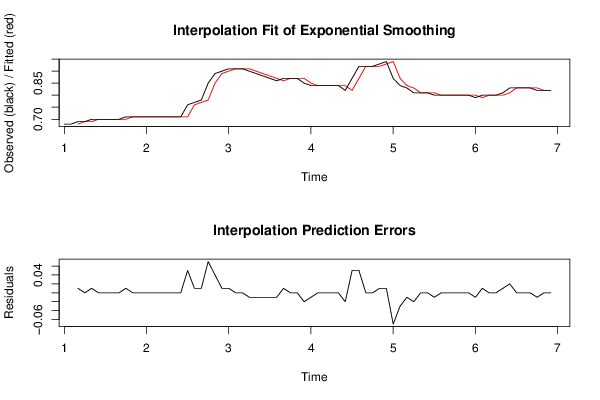
Interpolation Forecasts of Exponential Smoothing
tObservedFittedResiduals
30.690.680.0099999999999999
40.690.690
50.70.690.01
60.70.70
70.70.70
80.70.70
90.70.70
100.710.70.01
110.710.710
120.710.710
130.710.710
140.710.710
150.710.710
160.710.710
170.710.710
180.710.710
190.760.710.05
200.770.760.01
210.780.770.01
220.850.780.07
230.890.850.04
240.90.890.01
250.910.90.01
260.910.910
270.910.910
280.90.91-0.01
290.890.9-0.01
300.880.89-0.01
310.870.88-0.01
320.860.87-0.01
330.870.860.01
340.870.870
350.870.870
360.850.87-0.02
370.840.85-0.01
380.840.840
390.840.840
400.840.840
410.840.840
420.820.84-0.02
430.870.820.05
440.920.870.05
450.920.920
460.920.920
470.930.920.01
480.940.930.0099999999999999
490.870.94-0.07
500.840.87-0.03
510.830.84-0.01
520.810.83-0.0199999999999999
530.810.810
540.810.810
550.80.81-0.01
560.80.80
570.80.80
580.80.80
590.80.80
600.80.80
610.790.8-0.01
620.80.790.01
630.80.80
640.80.80
650.810.80.01
660.830.810.0199999999999999
670.830.830
680.830.830
690.830.830
700.820.83-0.01
710.820.820
720.820.820

\begin{tabular}{lllllllll}
\hline
Interpolation Forecasts of Exponential Smoothing \tabularnewline
t & Observed & Fitted & Residuals \tabularnewline
3 & 0.69 & 0.68 & 0.0099999999999999 \tabularnewline
4 & 0.69 & 0.69 & 0 \tabularnewline
5 & 0.7 & 0.69 & 0.01 \tabularnewline
6 & 0.7 & 0.7 & 0 \tabularnewline
7 & 0.7 & 0.7 & 0 \tabularnewline
8 & 0.7 & 0.7 & 0 \tabularnewline
9 & 0.7 & 0.7 & 0 \tabularnewline
10 & 0.71 & 0.7 & 0.01 \tabularnewline
11 & 0.71 & 0.71 & 0 \tabularnewline
12 & 0.71 & 0.71 & 0 \tabularnewline
13 & 0.71 & 0.71 & 0 \tabularnewline
14 & 0.71 & 0.71 & 0 \tabularnewline
15 & 0.71 & 0.71 & 0 \tabularnewline
16 & 0.71 & 0.71 & 0 \tabularnewline
17 & 0.71 & 0.71 & 0 \tabularnewline
18 & 0.71 & 0.71 & 0 \tabularnewline
19 & 0.76 & 0.71 & 0.05 \tabularnewline
20 & 0.77 & 0.76 & 0.01 \tabularnewline
21 & 0.78 & 0.77 & 0.01 \tabularnewline
22 & 0.85 & 0.78 & 0.07 \tabularnewline
23 & 0.89 & 0.85 & 0.04 \tabularnewline
24 & 0.9 & 0.89 & 0.01 \tabularnewline
25 & 0.91 & 0.9 & 0.01 \tabularnewline
26 & 0.91 & 0.91 & 0 \tabularnewline
27 & 0.91 & 0.91 & 0 \tabularnewline
28 & 0.9 & 0.91 & -0.01 \tabularnewline
29 & 0.89 & 0.9 & -0.01 \tabularnewline
30 & 0.88 & 0.89 & -0.01 \tabularnewline
31 & 0.87 & 0.88 & -0.01 \tabularnewline
32 & 0.86 & 0.87 & -0.01 \tabularnewline
33 & 0.87 & 0.86 & 0.01 \tabularnewline
34 & 0.87 & 0.87 & 0 \tabularnewline
35 & 0.87 & 0.87 & 0 \tabularnewline
36 & 0.85 & 0.87 & -0.02 \tabularnewline
37 & 0.84 & 0.85 & -0.01 \tabularnewline
38 & 0.84 & 0.84 & 0 \tabularnewline
39 & 0.84 & 0.84 & 0 \tabularnewline
40 & 0.84 & 0.84 & 0 \tabularnewline
41 & 0.84 & 0.84 & 0 \tabularnewline
42 & 0.82 & 0.84 & -0.02 \tabularnewline
43 & 0.87 & 0.82 & 0.05 \tabularnewline
44 & 0.92 & 0.87 & 0.05 \tabularnewline
45 & 0.92 & 0.92 & 0 \tabularnewline
46 & 0.92 & 0.92 & 0 \tabularnewline
47 & 0.93 & 0.92 & 0.01 \tabularnewline
48 & 0.94 & 0.93 & 0.0099999999999999 \tabularnewline
49 & 0.87 & 0.94 & -0.07 \tabularnewline
50 & 0.84 & 0.87 & -0.03 \tabularnewline
51 & 0.83 & 0.84 & -0.01 \tabularnewline
52 & 0.81 & 0.83 & -0.0199999999999999 \tabularnewline
53 & 0.81 & 0.81 & 0 \tabularnewline
54 & 0.81 & 0.81 & 0 \tabularnewline
55 & 0.8 & 0.81 & -0.01 \tabularnewline
56 & 0.8 & 0.8 & 0 \tabularnewline
57 & 0.8 & 0.8 & 0 \tabularnewline
58 & 0.8 & 0.8 & 0 \tabularnewline
59 & 0.8 & 0.8 & 0 \tabularnewline
60 & 0.8 & 0.8 & 0 \tabularnewline
61 & 0.79 & 0.8 & -0.01 \tabularnewline
62 & 0.8 & 0.79 & 0.01 \tabularnewline
63 & 0.8 & 0.8 & 0 \tabularnewline
64 & 0.8 & 0.8 & 0 \tabularnewline
65 & 0.81 & 0.8 & 0.01 \tabularnewline
66 & 0.83 & 0.81 & 0.0199999999999999 \tabularnewline
67 & 0.83 & 0.83 & 0 \tabularnewline
68 & 0.83 & 0.83 & 0 \tabularnewline
69 & 0.83 & 0.83 & 0 \tabularnewline
70 & 0.82 & 0.83 & -0.01 \tabularnewline
71 & 0.82 & 0.82 & 0 \tabularnewline
72 & 0.82 & 0.82 & 0 \tabularnewline
\hline
\end{tabular}
%Source: https://freestatistics.org/blog/index.php?pk=204896&T=2

[TABLE]
[ROW][C]Interpolation Forecasts of Exponential Smoothing[/C][/ROW]
[ROW][C]t[/C][C]Observed[/C][C]Fitted[/C][C]Residuals[/C][/ROW]
[ROW][C]3[/C][C]0.69[/C][C]0.68[/C][C]0.0099999999999999[/C][/ROW]
[ROW][C]4[/C][C]0.69[/C][C]0.69[/C][C]0[/C][/ROW]
[ROW][C]5[/C][C]0.7[/C][C]0.69[/C][C]0.01[/C][/ROW]
[ROW][C]6[/C][C]0.7[/C][C]0.7[/C][C]0[/C][/ROW]
[ROW][C]7[/C][C]0.7[/C][C]0.7[/C][C]0[/C][/ROW]
[ROW][C]8[/C][C]0.7[/C][C]0.7[/C][C]0[/C][/ROW]
[ROW][C]9[/C][C]0.7[/C][C]0.7[/C][C]0[/C][/ROW]
[ROW][C]10[/C][C]0.71[/C][C]0.7[/C][C]0.01[/C][/ROW]
[ROW][C]11[/C][C]0.71[/C][C]0.71[/C][C]0[/C][/ROW]
[ROW][C]12[/C][C]0.71[/C][C]0.71[/C][C]0[/C][/ROW]
[ROW][C]13[/C][C]0.71[/C][C]0.71[/C][C]0[/C][/ROW]
[ROW][C]14[/C][C]0.71[/C][C]0.71[/C][C]0[/C][/ROW]
[ROW][C]15[/C][C]0.71[/C][C]0.71[/C][C]0[/C][/ROW]
[ROW][C]16[/C][C]0.71[/C][C]0.71[/C][C]0[/C][/ROW]
[ROW][C]17[/C][C]0.71[/C][C]0.71[/C][C]0[/C][/ROW]
[ROW][C]18[/C][C]0.71[/C][C]0.71[/C][C]0[/C][/ROW]
[ROW][C]19[/C][C]0.76[/C][C]0.71[/C][C]0.05[/C][/ROW]
[ROW][C]20[/C][C]0.77[/C][C]0.76[/C][C]0.01[/C][/ROW]
[ROW][C]21[/C][C]0.78[/C][C]0.77[/C][C]0.01[/C][/ROW]
[ROW][C]22[/C][C]0.85[/C][C]0.78[/C][C]0.07[/C][/ROW]
[ROW][C]23[/C][C]0.89[/C][C]0.85[/C][C]0.04[/C][/ROW]
[ROW][C]24[/C][C]0.9[/C][C]0.89[/C][C]0.01[/C][/ROW]
[ROW][C]25[/C][C]0.91[/C][C]0.9[/C][C]0.01[/C][/ROW]
[ROW][C]26[/C][C]0.91[/C][C]0.91[/C][C]0[/C][/ROW]
[ROW][C]27[/C][C]0.91[/C][C]0.91[/C][C]0[/C][/ROW]
[ROW][C]28[/C][C]0.9[/C][C]0.91[/C][C]-0.01[/C][/ROW]
[ROW][C]29[/C][C]0.89[/C][C]0.9[/C][C]-0.01[/C][/ROW]
[ROW][C]30[/C][C]0.88[/C][C]0.89[/C][C]-0.01[/C][/ROW]
[ROW][C]31[/C][C]0.87[/C][C]0.88[/C][C]-0.01[/C][/ROW]
[ROW][C]32[/C][C]0.86[/C][C]0.87[/C][C]-0.01[/C][/ROW]
[ROW][C]33[/C][C]0.87[/C][C]0.86[/C][C]0.01[/C][/ROW]
[ROW][C]34[/C][C]0.87[/C][C]0.87[/C][C]0[/C][/ROW]
[ROW][C]35[/C][C]0.87[/C][C]0.87[/C][C]0[/C][/ROW]
[ROW][C]36[/C][C]0.85[/C][C]0.87[/C][C]-0.02[/C][/ROW]
[ROW][C]37[/C][C]0.84[/C][C]0.85[/C][C]-0.01[/C][/ROW]
[ROW][C]38[/C][C]0.84[/C][C]0.84[/C][C]0[/C][/ROW]
[ROW][C]39[/C][C]0.84[/C][C]0.84[/C][C]0[/C][/ROW]
[ROW][C]40[/C][C]0.84[/C][C]0.84[/C][C]0[/C][/ROW]
[ROW][C]41[/C][C]0.84[/C][C]0.84[/C][C]0[/C][/ROW]
[ROW][C]42[/C][C]0.82[/C][C]0.84[/C][C]-0.02[/C][/ROW]
[ROW][C]43[/C][C]0.87[/C][C]0.82[/C][C]0.05[/C][/ROW]
[ROW][C]44[/C][C]0.92[/C][C]0.87[/C][C]0.05[/C][/ROW]
[ROW][C]45[/C][C]0.92[/C][C]0.92[/C][C]0[/C][/ROW]
[ROW][C]46[/C][C]0.92[/C][C]0.92[/C][C]0[/C][/ROW]
[ROW][C]47[/C][C]0.93[/C][C]0.92[/C][C]0.01[/C][/ROW]
[ROW][C]48[/C][C]0.94[/C][C]0.93[/C][C]0.0099999999999999[/C][/ROW]
[ROW][C]49[/C][C]0.87[/C][C]0.94[/C][C]-0.07[/C][/ROW]
[ROW][C]50[/C][C]0.84[/C][C]0.87[/C][C]-0.03[/C][/ROW]
[ROW][C]51[/C][C]0.83[/C][C]0.84[/C][C]-0.01[/C][/ROW]
[ROW][C]52[/C][C]0.81[/C][C]0.83[/C][C]-0.0199999999999999[/C][/ROW]
[ROW][C]53[/C][C]0.81[/C][C]0.81[/C][C]0[/C][/ROW]
[ROW][C]54[/C][C]0.81[/C][C]0.81[/C][C]0[/C][/ROW]
[ROW][C]55[/C][C]0.8[/C][C]0.81[/C][C]-0.01[/C][/ROW]
[ROW][C]56[/C][C]0.8[/C][C]0.8[/C][C]0[/C][/ROW]
[ROW][C]57[/C][C]0.8[/C][C]0.8[/C][C]0[/C][/ROW]
[ROW][C]58[/C][C]0.8[/C][C]0.8[/C][C]0[/C][/ROW]
[ROW][C]59[/C][C]0.8[/C][C]0.8[/C][C]0[/C][/ROW]
[ROW][C]60[/C][C]0.8[/C][C]0.8[/C][C]0[/C][/ROW]
[ROW][C]61[/C][C]0.79[/C][C]0.8[/C][C]-0.01[/C][/ROW]
[ROW][C]62[/C][C]0.8[/C][C]0.79[/C][C]0.01[/C][/ROW]
[ROW][C]63[/C][C]0.8[/C][C]0.8[/C][C]0[/C][/ROW]
[ROW][C]64[/C][C]0.8[/C][C]0.8[/C][C]0[/C][/ROW]
[ROW][C]65[/C][C]0.81[/C][C]0.8[/C][C]0.01[/C][/ROW]
[ROW][C]66[/C][C]0.83[/C][C]0.81[/C][C]0.0199999999999999[/C][/ROW]
[ROW][C]67[/C][C]0.83[/C][C]0.83[/C][C]0[/C][/ROW]
[ROW][C]68[/C][C]0.83[/C][C]0.83[/C][C]0[/C][/ROW]
[ROW][C]69[/C][C]0.83[/C][C]0.83[/C][C]0[/C][/ROW]
[ROW][C]70[/C][C]0.82[/C][C]0.83[/C][C]-0.01[/C][/ROW]
[ROW][C]71[/C][C]0.82[/C][C]0.82[/C][C]0[/C][/ROW]
[ROW][C]72[/C][C]0.82[/C][C]0.82[/C][C]0[/C][/ROW]
[/TABLE]
Source: https://freestatistics.org/blog/index.php?pk=204896&T=2

Globally Unique Identifier (entire table): ba.freestatistics.org/blog/index.php?pk=204896&T=2

As an alternative you can also use a QR Code:  

The GUIDs for individual cells are displayed in the table below:

Interpolation Forecasts of Exponential Smoothing
tObservedFittedResiduals
30.690.680.0099999999999999
40.690.690
50.70.690.01
60.70.70
70.70.70
80.70.70
90.70.70
100.710.70.01
110.710.710
120.710.710
130.710.710
140.710.710
150.710.710
160.710.710
170.710.710
180.710.710
190.760.710.05
200.770.760.01
210.780.770.01
220.850.780.07
230.890.850.04
240.90.890.01
250.910.90.01
260.910.910
270.910.910
280.90.91-0.01
290.890.9-0.01
300.880.89-0.01
310.870.88-0.01
320.860.87-0.01
330.870.860.01
340.870.870
350.870.870
360.850.87-0.02
370.840.85-0.01
380.840.840
390.840.840
400.840.840
410.840.840
420.820.84-0.02
430.870.820.05
440.920.870.05
450.920.920
460.920.920
470.930.920.01
480.940.930.0099999999999999
490.870.94-0.07
500.840.87-0.03
510.830.84-0.01
520.810.83-0.0199999999999999
530.810.810
540.810.810
550.80.81-0.01
560.80.80
570.80.80
580.80.80
590.80.80
600.80.80
610.790.8-0.01
620.80.790.01
630.80.80
640.80.80
650.810.80.01
660.830.810.0199999999999999
670.830.830
680.830.830
690.830.830
700.820.83-0.01
710.820.820
720.820.820


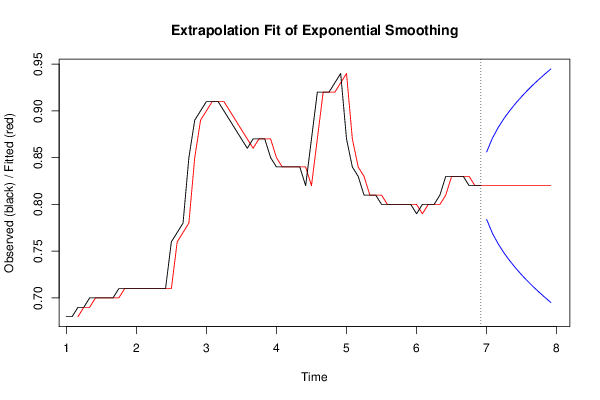
Extrapolation Forecasts of Exponential Smoothing
tForecast95% Lower Bound95% Upper Bound
730.820.7839680456433160.856031954356684
740.820.769043121469970.87095687853003
750.820.7575908243582210.882409175641779
760.820.7479360912866330.892063908713367
770.820.7394301006962860.900569899303714
780.820.7317400973908720.908259902609128
790.820.7246684095205850.915331590479415
800.820.7180862429399390.921913757060061
810.820.7119041369299490.928095863070051
820.820.7060569556856530.933943044314347
830.820.7004955269356690.939504473064331
840.820.6951816487164430.944818351283557

\begin{tabular}{lllllllll}
\hline
Extrapolation Forecasts of Exponential Smoothing \tabularnewline
t & Forecast & 95% Lower Bound & 95% Upper Bound \tabularnewline
73 & 0.82 & 0.783968045643316 & 0.856031954356684 \tabularnewline
74 & 0.82 & 0.76904312146997 & 0.87095687853003 \tabularnewline
75 & 0.82 & 0.757590824358221 & 0.882409175641779 \tabularnewline
76 & 0.82 & 0.747936091286633 & 0.892063908713367 \tabularnewline
77 & 0.82 & 0.739430100696286 & 0.900569899303714 \tabularnewline
78 & 0.82 & 0.731740097390872 & 0.908259902609128 \tabularnewline
79 & 0.82 & 0.724668409520585 & 0.915331590479415 \tabularnewline
80 & 0.82 & 0.718086242939939 & 0.921913757060061 \tabularnewline
81 & 0.82 & 0.711904136929949 & 0.928095863070051 \tabularnewline
82 & 0.82 & 0.706056955685653 & 0.933943044314347 \tabularnewline
83 & 0.82 & 0.700495526935669 & 0.939504473064331 \tabularnewline
84 & 0.82 & 0.695181648716443 & 0.944818351283557 \tabularnewline
\hline
\end{tabular}
%Source: https://freestatistics.org/blog/index.php?pk=204896&T=3

[TABLE]
[ROW][C]Extrapolation Forecasts of Exponential Smoothing[/C][/ROW]
[ROW][C]t[/C][C]Forecast[/C][C]95% Lower Bound[/C][C]95% Upper Bound[/C][/ROW]
[ROW][C]73[/C][C]0.82[/C][C]0.783968045643316[/C][C]0.856031954356684[/C][/ROW]
[ROW][C]74[/C][C]0.82[/C][C]0.76904312146997[/C][C]0.87095687853003[/C][/ROW]
[ROW][C]75[/C][C]0.82[/C][C]0.757590824358221[/C][C]0.882409175641779[/C][/ROW]
[ROW][C]76[/C][C]0.82[/C][C]0.747936091286633[/C][C]0.892063908713367[/C][/ROW]
[ROW][C]77[/C][C]0.82[/C][C]0.739430100696286[/C][C]0.900569899303714[/C][/ROW]
[ROW][C]78[/C][C]0.82[/C][C]0.731740097390872[/C][C]0.908259902609128[/C][/ROW]
[ROW][C]79[/C][C]0.82[/C][C]0.724668409520585[/C][C]0.915331590479415[/C][/ROW]
[ROW][C]80[/C][C]0.82[/C][C]0.718086242939939[/C][C]0.921913757060061[/C][/ROW]
[ROW][C]81[/C][C]0.82[/C][C]0.711904136929949[/C][C]0.928095863070051[/C][/ROW]
[ROW][C]82[/C][C]0.82[/C][C]0.706056955685653[/C][C]0.933943044314347[/C][/ROW]
[ROW][C]83[/C][C]0.82[/C][C]0.700495526935669[/C][C]0.939504473064331[/C][/ROW]
[ROW][C]84[/C][C]0.82[/C][C]0.695181648716443[/C][C]0.944818351283557[/C][/ROW]
[/TABLE]
Source: https://freestatistics.org/blog/index.php?pk=204896&T=3

Globally Unique Identifier (entire table): ba.freestatistics.org/blog/index.php?pk=204896&T=3

As an alternative you can also use a QR Code:  

The GUIDs for individual cells are displayed in the table below:

Extrapolation Forecasts of Exponential Smoothing
tForecast95% Lower Bound95% Upper Bound
730.820.7839680456433160.856031954356684
740.820.769043121469970.87095687853003
750.820.7575908243582210.882409175641779
760.820.7479360912866330.892063908713367
770.820.7394301006962860.900569899303714
780.820.7317400973908720.908259902609128
790.820.7246684095205850.915331590479415
800.820.7180862429399390.921913757060061
810.820.7119041369299490.928095863070051
820.820.7060569556856530.933943044314347
830.820.7004955269356690.939504473064331
840.820.6951816487164430.944818351283557


Parameters (Session):
par1 = 12 ; par2 = Double ; par3 = multiplicative ;
Parameters (R input):
par1 = 12 ; par2 = Double ; par3 = multiplicative ;
R code (references can be found in the software module):
par1 <- as.numeric(par1)
if (par2 == 'Single') K <- 1
if (par2 == 'Double') K <- 2
if (par2 == 'Triple') K <- par1
nx <- length(x)
nxmK <- nx - K
x <- ts(x, frequency = par1)
if (par2 == 'Single') fit <- HoltWinters(x, gamma=F, beta=F)
if (par2 == 'Double') fit <- HoltWinters(x, gamma=F)
if (par2 == 'Triple') fit <- HoltWinters(x, seasonal=par3)
fit
myresid <- x - fit$fitted[,'xhat']
bitmap(file='test1.png')
op <- par(mfrow=c(2,1))
plot(fit,ylab='Observed (black) / Fitted (red)',main='Interpolation Fit of Exponential Smoothing')
plot(myresid,ylab='Residuals',main='Interpolation Prediction Errors')
par(op)
dev.off()
bitmap(file='test2.png')
p <- predict(fit, par1, prediction.interval=TRUE)
np <- length(p[,1])
plot(fit,p,ylab='Observed (black) / Fitted (red)',main='Extrapolation Fit of Exponential Smoothing')
dev.off()
bitmap(file='test3.png')
op <- par(mfrow = c(2,2))
acf(as.numeric(myresid),lag.max = nx/2,main='Residual ACF')
spectrum(myresid,main='Residals Periodogram')
cpgram(myresid,main='Residal Cumulative Periodogram')
qqnorm(myresid,main='Residual Normal QQ Plot')
qqline(myresid)
par(op)
dev.off()
load(file='createtable')
a<-table.start()
a<-table.row.start(a)
a<-table.element(a,'Estimated Parameters of Exponential Smoothing',2,TRUE)
a<-table.row.end(a)
a<-table.row.start(a)
a<-table.element(a,'Parameter',header=TRUE)
a<-table.element(a,'Value',header=TRUE)
a<-table.row.end(a)
a<-table.row.start(a)
a<-table.element(a,'alpha',header=TRUE)
a<-table.element(a,fit$alpha)
a<-table.row.end(a)
a<-table.row.start(a)
a<-table.element(a,'beta',header=TRUE)
a<-table.element(a,fit$beta)
a<-table.row.end(a)
a<-table.row.start(a)
a<-table.element(a,'gamma',header=TRUE)
a<-table.element(a,fit$gamma)
a<-table.row.end(a)
a<-table.end(a)
table.save(a,file='mytable.tab')
a<-table.start()
a<-table.row.start(a)
a<-table.element(a,'Interpolation Forecasts of Exponential Smoothing',4,TRUE)
a<-table.row.end(a)
a<-table.row.start(a)
a<-table.element(a,'t',header=TRUE)
a<-table.element(a,'Observed',header=TRUE)
a<-table.element(a,'Fitted',header=TRUE)
a<-table.element(a,'Residuals',header=TRUE)
a<-table.row.end(a)
for (i in 1:nxmK) {
a<-table.row.start(a)
a<-table.element(a,i+K,header=TRUE)
a<-table.element(a,x[i+K])
a<-table.element(a,fit$fitted[i,'xhat'])
a<-table.element(a,myresid[i])
a<-table.row.end(a)
}
a<-table.end(a)
table.save(a,file='mytable1.tab')
a<-table.start()
a<-table.row.start(a)
a<-table.element(a,'Extrapolation Forecasts of Exponential Smoothing',4,TRUE)
a<-table.row.end(a)
a<-table.row.start(a)
a<-table.element(a,'t',header=TRUE)
a<-table.element(a,'Forecast',header=TRUE)
a<-table.element(a,'95% Lower Bound',header=TRUE)
a<-table.element(a,'95% Upper Bound',header=TRUE)
a<-table.row.end(a)
for (i in 1:np) {
a<-table.row.start(a)
a<-table.element(a,nx+i,header=TRUE)
a<-table.element(a,p[i,'fit'])
a<-table.element(a,p[i,'lwr'])
a<-table.element(a,p[i,'upr'])
a<-table.row.end(a)
}
a<-table.end(a)
table.save(a,file='mytable2.tab')