Free Statistics

of Irreproducible Research!

Author's title

Author*The author of this computation has been verified*
R Software Module--
Title produced by softwarePaired and Unpaired Two Samples Tests about the Mean
Date of computationSat, 29 Dec 2012 09:52:22 -0500
Cite this page as followsStatistical Computations at FreeStatistics.org, Office for Research Development and Education, URL https://freestatistics.org/blog/index.php?v=date/2012/Dec/29/t1356793572xleteum2ypi9plg.htm/, Retrieved Thu, 02 May 2024 08:24:13 +0000
Statistical Computations at FreeStatistics.org, Office for Research Development and Education, URL https://freestatistics.org/blog/index.php?pk=204878, Retrieved Thu, 02 May 2024 08:24:13 +0000
QR Codes:

Original text written by user:
IsPrivate?No (this computation is public)
User-defined keywords
Estimated Impact108
Family? (F = Feedback message, R = changed R code, M = changed R Module, P = changed Parameters, D = changed Data)
-     [Paired and Unpaired Two Samples Tests about the Mean] [] [2012-11-27 07:51:28] [b98453cac15ba1066b407e146608df68]
- RM      [Paired and Unpaired Two Samples Tests about the Mean] [] [2012-12-29 14:52:22] [7338cd26db379c04f0557b08db763c32] [Current]
Feedback Forum

Post a new message
Dataseries X:
30	31	122	111
34	27	114	69
36	34	140	116
37	35	143	103
30	37	122	139
35	40	127	135
30	30	113	113
31	28	118	99
37	28	161	76
32	32	134	110
30	33	96	121
30	28	104	95
35	25	135	66
30	34	110	111
32	30	128	77
35	38	142	101
30	28	117	108
29	35	94	135
35	33	135	70
30	39	121	124
31	30	103	92
31	31	118	104
31	33	127	113
30	30	116	95
31	24	129	89
30	31	115	83
34	27	135	96
34	26	133	95
31	33	113	110
30	33	111	106
23	26	92	78
30	35	118	115
32	26	134	74
30	30	106	93
36	28	137	88
28	27	100	104
29	34	102	86
36	29	134	104
34	28	130	99
37	32	144	101
30	26	120	53
30	29	91	96
27	25	100	58
32	37	134	117
39	24	161	82
31	24	128	57
31	23	124	71
30	31	115	105
30	26	123	60
29	31	117	77
29	31	111	73
35	25	146	78
27	23	101	81
33	31	131	101
30	38	122	118
19	18	78	59
36	29	120	101
30	28	115	22
37	30	142	77
30	28	94	100
29	23	114	39
33	25	108	42
30	27	119	80
30	20	117	48
26	35	86	131
36	19	138	46
30	24	119	89
30	24	117	51
32	29	117	108
21	26	76	86
31	28	119	105
30	32	119	85
33	28	124	103
29	23	116	83
35	27	118	77
43	31	102	26
30	24	116	73
31	23	103	42
31	26	117	71
30	32	108	105
30	20	122	73
35	29	90	98
36	28	133	108
33	27	116	57
31	20	110	37
28	21	90	70
32	31	74	73
20	21	75	47
30	21	107	73
27	24	90	91
30	29	96	110
29	26	115	78
29	29	91	92
22	27	77	52
30	32	108	88
30	26	83	100
26	18	77	33
28	25	99	42
30	19	115	81
30	27	99	67
31	14	106	8
25	16	77	46
30	25	115	83
19	26	67	87
2	25	8	82
32	24	69	63
24	29	88	27
31	10	107	14
30	24	120	83
4	22	3	168
1	22	1	67
4	10	0	21
0	24	0	55
0	24	0	54
NA	33	NA	118
NA	27	NA	69
NA	24	NA	77
NA	25	NA	72
NA	24	NA	53
NA	16	NA	40
NA	37	NA	102
NA	28	NA	25
NA	20	NA	31
NA	24	NA	77
NA	24	NA	38
NA	30	NA	23
NA	26	NA	91
NA	20	NA	58
NA	23	NA	42
NA	12	NA	44
NA	24	NA	58
NA	16	NA	35
NA	26	NA	88
NA	11	NA	25
NA	25	NA	39
NA	3	NA	0
NA	24	NA	48
NA	34	NA	64
NA	26	NA	65
NA	29	NA	95
NA	26	NA	29
NA	1	NA	2
NA	29	NA	83
NA	10	NA	11
NA	8	NA	16
NA	10	NA	9
NA	23	NA	46
NA	15	NA	41
NA	12	NA	14
NA	24	NA	63
NA	3	NA	9
NA	6	NA	0
NA	21	NA	58
NA	24	NA	18
NA	14	NA	42
NA	1	NA	0
NA	15	NA	26
NA	21	NA	38
NA	0	NA	0
NA	0	NA	0
NA	18	NA	1
NA	0	NA	0
NA	4	NA	13
NA	0	NA	0
NA	0	NA	0
NA	0	NA	0
NA	0	NA	0
NA	0	NA	0


Summary of computational transaction
Raw Inputview raw input (R code)
Raw Outputview raw output of R engine
Computing time3 seconds
R Server'Sir Ronald Aylmer Fisher' @ fisher.wessa.net

\begin{tabular}{lllllllll}
\hline
Summary of computational transaction \tabularnewline
Raw Input & view raw input (R code)  \tabularnewline
Raw Output & view raw output of R engine  \tabularnewline
Computing time & 3 seconds \tabularnewline
R Server & 'Sir Ronald Aylmer Fisher' @ fisher.wessa.net \tabularnewline
\hline
\end{tabular}
%Source: https://freestatistics.org/blog/index.php?pk=204878&T=0

[TABLE]
[ROW][C]Summary of computational transaction[/C][/ROW]
[ROW][C]Raw Input[/C][C]view raw input (R code) [/C][/ROW]
[ROW][C]Raw Output[/C][C]view raw output of R engine [/C][/ROW]
[ROW][C]Computing time[/C][C]3 seconds[/C][/ROW]
[ROW][C]R Server[/C][C]'Sir Ronald Aylmer Fisher' @ fisher.wessa.net[/C][/ROW]
[/TABLE]
Source: https://freestatistics.org/blog/index.php?pk=204878&T=0

Globally Unique Identifier (entire table): ba.freestatistics.org/blog/index.php?pk=204878&T=0

As an alternative you can also use a QR Code:  

The GUIDs for individual cells are displayed in the table below:

Summary of computational transaction
Raw Inputview raw input (R code)
Raw Outputview raw output of R engine
Computing time3 seconds
R Server'Sir Ronald Aylmer Fisher' @ fisher.wessa.net


Two Sample t-test (paired)
Difference: Mean1 - Mean21.87719298245614
t-stat2.62610671378515
df113
p-value0.00983373038385035
H0 value0
Alternativetwo.sided
CI Level0.99
CI[0.00433735262060763,3.75004861229167]
F-test to compare two variances
F-stat0.672938331138937
df113
p-value0.0245462100857569
H0 value1
Alternativetwo.sided
CI Level0.99
CI[0.434211112933832,1.06040601460349]

\begin{tabular}{lllllllll}
\hline
Two Sample t-test (paired) \tabularnewline
Difference: Mean1 - Mean2 & 1.87719298245614 \tabularnewline
t-stat & 2.62610671378515 \tabularnewline
df & 113 \tabularnewline
p-value & 0.00983373038385035 \tabularnewline
H0 value & 0 \tabularnewline
Alternative & two.sided \tabularnewline
CI Level & 0.99 \tabularnewline
CI & [0.00433735262060763,3.75004861229167] \tabularnewline
F-test to compare two variances \tabularnewline
F-stat & 0.672938331138937 \tabularnewline
df & 113 \tabularnewline
p-value & 0.0245462100857569 \tabularnewline
H0 value & 1 \tabularnewline
Alternative & two.sided \tabularnewline
CI Level & 0.99 \tabularnewline
CI & [0.434211112933832,1.06040601460349] \tabularnewline
\hline
\end{tabular}
%Source: https://freestatistics.org/blog/index.php?pk=204878&T=1

[TABLE]
[ROW][C]Two Sample t-test (paired)[/C][/ROW]
[ROW][C]Difference: Mean1 - Mean2[/C][C]1.87719298245614[/C][/ROW]
[ROW][C]t-stat[/C][C]2.62610671378515[/C][/ROW]
[ROW][C]df[/C][C]113[/C][/ROW]
[ROW][C]p-value[/C][C]0.00983373038385035[/C][/ROW]
[ROW][C]H0 value[/C][C]0[/C][/ROW]
[ROW][C]Alternative[/C][C]two.sided[/C][/ROW]
[ROW][C]CI Level[/C][C]0.99[/C][/ROW]
[ROW][C]CI[/C][C][0.00433735262060763,3.75004861229167][/C][/ROW]
[ROW][C]F-test to compare two variances[/C][/ROW]
[ROW][C]F-stat[/C][C]0.672938331138937[/C][/ROW]
[ROW][C]df[/C][C]113[/C][/ROW]
[ROW][C]p-value[/C][C]0.0245462100857569[/C][/ROW]
[ROW][C]H0 value[/C][C]1[/C][/ROW]
[ROW][C]Alternative[/C][C]two.sided[/C][/ROW]
[ROW][C]CI Level[/C][C]0.99[/C][/ROW]
[ROW][C]CI[/C][C][0.434211112933832,1.06040601460349][/C][/ROW]
[/TABLE]
Source: https://freestatistics.org/blog/index.php?pk=204878&T=1

Globally Unique Identifier (entire table): ba.freestatistics.org/blog/index.php?pk=204878&T=1

As an alternative you can also use a QR Code:  

The GUIDs for individual cells are displayed in the table below:

Two Sample t-test (paired)
Difference: Mean1 - Mean21.87719298245614
t-stat2.62610671378515
df113
p-value0.00983373038385035
H0 value0
Alternativetwo.sided
CI Level0.99
CI[0.00433735262060763,3.75004861229167]
F-test to compare two variances
F-stat0.672938331138937
df113
p-value0.0245462100857569
H0 value1
Alternativetwo.sided
CI Level0.99
CI[0.434211112933832,1.06040601460349]


Welch Two Sample t-test (paired)
Difference: Mean1 - Mean21.87719298245614
t-stat2.62610671378515
df113
p-value0.00983373038385035
H0 value0
Alternativetwo.sided
CI Level0.99
CI[0.00433735262060763,3.75004861229167]

\begin{tabular}{lllllllll}
\hline
Welch Two Sample t-test (paired) \tabularnewline
Difference: Mean1 - Mean2 & 1.87719298245614 \tabularnewline
t-stat & 2.62610671378515 \tabularnewline
df & 113 \tabularnewline
p-value & 0.00983373038385035 \tabularnewline
H0 value & 0 \tabularnewline
Alternative & two.sided \tabularnewline
CI Level & 0.99 \tabularnewline
CI & [0.00433735262060763,3.75004861229167] \tabularnewline
\hline
\end{tabular}
%Source: https://freestatistics.org/blog/index.php?pk=204878&T=2

[TABLE]
[ROW][C]Welch Two Sample t-test (paired)[/C][/ROW]
[ROW][C]Difference: Mean1 - Mean2[/C][C]1.87719298245614[/C][/ROW]
[ROW][C]t-stat[/C][C]2.62610671378515[/C][/ROW]
[ROW][C]df[/C][C]113[/C][/ROW]
[ROW][C]p-value[/C][C]0.00983373038385035[/C][/ROW]
[ROW][C]H0 value[/C][C]0[/C][/ROW]
[ROW][C]Alternative[/C][C]two.sided[/C][/ROW]
[ROW][C]CI Level[/C][C]0.99[/C][/ROW]
[ROW][C]CI[/C][C][0.00433735262060763,3.75004861229167][/C][/ROW]
[/TABLE]
Source: https://freestatistics.org/blog/index.php?pk=204878&T=2

Globally Unique Identifier (entire table): ba.freestatistics.org/blog/index.php?pk=204878&T=2

As an alternative you can also use a QR Code:  

The GUIDs for individual cells are displayed in the table below:

Welch Two Sample t-test (paired)
Difference: Mean1 - Mean21.87719298245614
t-stat2.62610671378515
df113
p-value0.00983373038385035
H0 value0
Alternativetwo.sided
CI Level0.99
CI[0.00433735262060763,3.75004861229167]


Wicoxon rank sum test with continuity correction (paired)
W4146
p-value0.000223804210480255
H0 value0
Alternativetwo.sided
Kolmogorov-Smirnov Test to compare Distributions of two Samples
KS Statistic0.49749373433584
p-value4.9960036108132e-15
Kolmogorov-Smirnov Test to compare Distributional Shape of two Samples
KS Statistic0.219611528822055
p-value0.00285747188529328

\begin{tabular}{lllllllll}
\hline
Wicoxon rank sum test with continuity correction (paired) \tabularnewline
W & 4146 \tabularnewline
p-value & 0.000223804210480255 \tabularnewline
H0 value & 0 \tabularnewline
Alternative & two.sided \tabularnewline
Kolmogorov-Smirnov Test to compare Distributions of two Samples \tabularnewline
KS Statistic & 0.49749373433584 \tabularnewline
p-value & 4.9960036108132e-15 \tabularnewline
Kolmogorov-Smirnov Test to compare Distributional Shape of two Samples \tabularnewline
KS Statistic & 0.219611528822055 \tabularnewline
p-value & 0.00285747188529328 \tabularnewline
\hline
\end{tabular}
%Source: https://freestatistics.org/blog/index.php?pk=204878&T=3

[TABLE]
[ROW][C]Wicoxon rank sum test with continuity correction (paired)[/C][/ROW]
[ROW][C]W[/C][C]4146[/C][/ROW]
[ROW][C]p-value[/C][C]0.000223804210480255[/C][/ROW]
[ROW][C]H0 value[/C][C]0[/C][/ROW]
[ROW][C]Alternative[/C][C]two.sided[/C][/ROW]
[ROW][C]Kolmogorov-Smirnov Test to compare Distributions of two Samples[/C][/ROW]
[ROW][C]KS Statistic[/C][C]0.49749373433584[/C][/ROW]
[ROW][C]p-value[/C][C]4.9960036108132e-15[/C][/ROW]
[ROW][C]Kolmogorov-Smirnov Test to compare Distributional Shape of two Samples[/C][/ROW]
[ROW][C]KS Statistic[/C][C]0.219611528822055[/C][/ROW]
[ROW][C]p-value[/C][C]0.00285747188529328[/C][/ROW]
[/TABLE]
Source: https://freestatistics.org/blog/index.php?pk=204878&T=3

Globally Unique Identifier (entire table): ba.freestatistics.org/blog/index.php?pk=204878&T=3

As an alternative you can also use a QR Code:  

The GUIDs for individual cells are displayed in the table below:

Wicoxon rank sum test with continuity correction (paired)
W4146
p-value0.000223804210480255
H0 value0
Alternativetwo.sided
Kolmogorov-Smirnov Test to compare Distributions of two Samples
KS Statistic0.49749373433584
p-value4.9960036108132e-15
Kolmogorov-Smirnov Test to compare Distributional Shape of two Samples
KS Statistic0.219611528822055
p-value0.00285747188529328


Parameters (Session):
par1 = 1 ; par2 = 2 ; par3 = 0.99 ; par4 = two.sided ; par5 = paired ; par6 = 0.0 ;
Parameters (R input):
par1 = 1 ; par2 = 2 ; par3 = 0.99 ; par4 = two.sided ; par5 = paired ; par6 = 0.0 ; par7 = ; par8 = ; par9 = ; par10 = ; par11 = ; par12 = ; par13 = ; par14 = ; par15 = ; par16 = ; par17 = ; par18 = ; par19 = ; par20 = ;
R code (references can be found in the software module):
par1 <- as.numeric(par1) #column number of first sample
par2 <- as.numeric(par2) #column number of second sample
par3 <- as.numeric(par3) #confidence (= 1 - alpha)
if (par5 == 'unpaired') paired <- FALSE else paired <- TRUE
par6 <- as.numeric(par6) #H0
z <- t(y)
if (par1 == par2) stop('Please, select two different column numbers')
if (par1 < 1) stop('Please, select a column number greater than zero for the first sample')
if (par2 < 1) stop('Please, select a column number greater than zero for the second sample')
if (par1 > length(z[1,])) stop('The column number for the first sample should be smaller')
if (par2 > length(z[1,])) stop('The column number for the second sample should be smaller')
if (par3 <= 0) stop('The confidence level should be larger than zero')
if (par3 >= 1) stop('The confidence level should be smaller than zero')
(r.t <- t.test(z[,par1],z[,par2],var.equal=TRUE,alternative=par4,paired=paired,mu=par6,conf.level=par3))
(v.t <- var.test(z[,par1],z[,par2],conf.level=par3))
(r.w <- t.test(z[,par1],z[,par2],var.equal=FALSE,alternative=par4,paired=paired,mu=par6,conf.level=par3))
(w.t <- wilcox.test(z[,par1],z[,par2],alternative=par4,paired=paired,mu=par6,conf.level=par3))
(ks.t <- ks.test(z[,par1],z[,par2],alternative=par4))
m1 <- mean(z[,par1],na.rm=T)
m2 <- mean(z[,par2],na.rm=T)
mdiff <- m1 - m2
newsam1 <- z[!is.na(z[,par1]),par1]
newsam2 <- z[,par2]+mdiff
newsam2 <- newsam2[!is.na(newsam2)]
(ks1.t <- ks.test(newsam1,newsam2,alternative=par4))
mydf <- data.frame(cbind(z[,par1],z[,par2]))
colnames(mydf) <- c('Variable 1','Variable 2')
bitmap(file='test1.png')
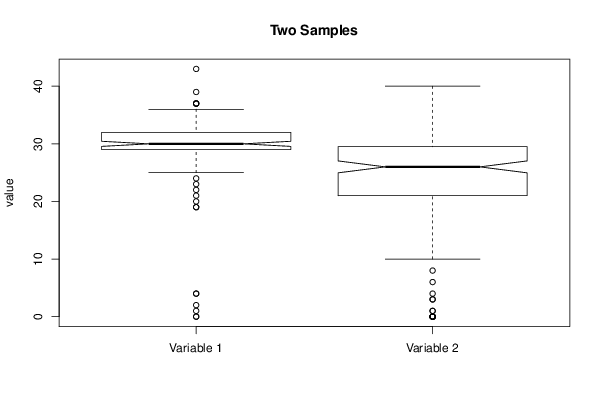
boxplot(mydf, notch=TRUE, ylab='value',main=main)
dev.off()
bitmap(file='test2.png')
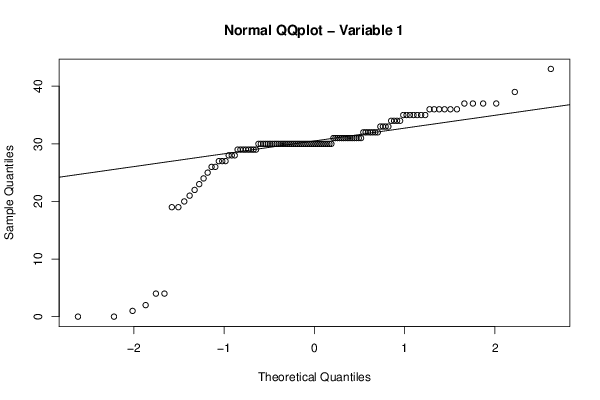
qqnorm(z[,par1],main='Normal QQplot - Variable 1')
qqline(z[,par1])
dev.off()
bitmap(file='test3.png')
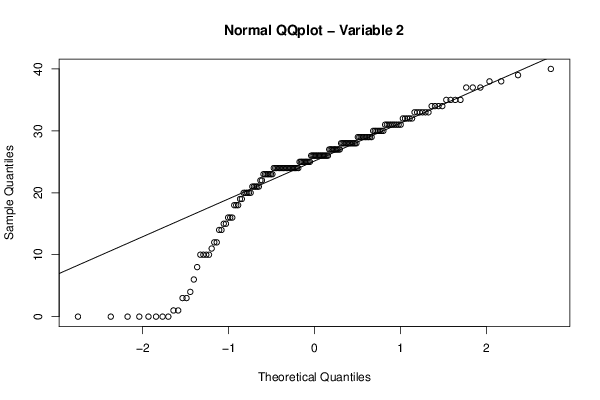
qqnorm(z[,par2],main='Normal QQplot - Variable 2')
qqline(z[,par2])
dev.off()
load(file='createtable')
a<-table.start()
a<-table.row.start(a)
a<-table.element(a,paste('Two Sample t-test (',par5,')',sep=''),2,TRUE)
a<-table.row.end(a)
if(!paired){
a<-table.row.start(a)
a<-table.element(a,'Mean of Sample 1',header=TRUE)
a<-table.element(a,r.t$estimate[[1]])
a<-table.row.end(a)
a<-table.row.start(a)
a<-table.element(a,'Mean of Sample 2',header=TRUE)
a<-table.element(a,r.t$estimate[[2]])
a<-table.row.end(a)
} else {
a<-table.row.start(a)
a<-table.element(a,'Difference: Mean1 - Mean2',header=TRUE)
a<-table.element(a,r.t$estimate)
a<-table.row.end(a)
}
a<-table.row.start(a)
a<-table.element(a,'t-stat',header=TRUE)
a<-table.element(a,r.t$statistic[[1]])
a<-table.row.end(a)
a<-table.row.start(a)
a<-table.element(a,'df',header=TRUE)
a<-table.element(a,r.t$parameter[[1]])
a<-table.row.end(a)
a<-table.row.start(a)
a<-table.element(a,'p-value',header=TRUE)
a<-table.element(a,r.t$p.value)
a<-table.row.end(a)
a<-table.row.start(a)
a<-table.element(a,'H0 value',header=TRUE)
a<-table.element(a,r.t$null.value[[1]])
a<-table.row.end(a)
a<-table.row.start(a)
a<-table.element(a,'Alternative',header=TRUE)
a<-table.element(a,r.t$alternative)
a<-table.row.end(a)
a<-table.row.start(a)
a<-table.element(a,'CI Level',header=TRUE)
a<-table.element(a,attr(r.t$conf.int,'conf.level'))
a<-table.row.end(a)
a<-table.row.start(a)
a<-table.element(a,'CI',header=TRUE)
a<-table.element(a,paste('[',r.t$conf.int[1],',',r.t$conf.int[2],']',sep=''))
a<-table.row.end(a)
a<-table.row.start(a)
a<-table.element(a,'F-test to compare two variances',2,TRUE)
a<-table.row.end(a)
a<-table.row.start(a)
a<-table.element(a,'F-stat',header=TRUE)
a<-table.element(a,v.t$statistic[[1]])
a<-table.row.end(a)
a<-table.row.start(a)
a<-table.element(a,'df',header=TRUE)
a<-table.element(a,v.t$parameter[[1]])
a<-table.row.end(a)
a<-table.row.start(a)
a<-table.element(a,'p-value',header=TRUE)
a<-table.element(a,v.t$p.value)
a<-table.row.end(a)
a<-table.row.start(a)
a<-table.element(a,'H0 value',header=TRUE)
a<-table.element(a,v.t$null.value[[1]])
a<-table.row.end(a)
a<-table.row.start(a)
a<-table.element(a,'Alternative',header=TRUE)
a<-table.element(a,v.t$alternative)
a<-table.row.end(a)
a<-table.row.start(a)
a<-table.element(a,'CI Level',header=TRUE)
a<-table.element(a,attr(v.t$conf.int,'conf.level'))
a<-table.row.end(a)
a<-table.row.start(a)
a<-table.element(a,'CI',header=TRUE)
a<-table.element(a,paste('[',v.t$conf.int[1],',',v.t$conf.int[2],']',sep=''))
a<-table.row.end(a)
a<-table.end(a)
table.save(a,file='mytable.tab')
a<-table.start()
a<-table.row.start(a)
a<-table.element(a,paste('Welch Two Sample t-test (',par5,')',sep=''),2,TRUE)
a<-table.row.end(a)
if(!paired){
a<-table.row.start(a)
a<-table.element(a,'Mean of Sample 1',header=TRUE)
a<-table.element(a,r.w$estimate[[1]])
a<-table.row.end(a)
a<-table.row.start(a)
a<-table.element(a,'Mean of Sample 2',header=TRUE)
a<-table.element(a,r.w$estimate[[2]])
a<-table.row.end(a)
} else {
a<-table.row.start(a)
a<-table.element(a,'Difference: Mean1 - Mean2',header=TRUE)
a<-table.element(a,r.w$estimate)
a<-table.row.end(a)
}
a<-table.row.start(a)
a<-table.element(a,'t-stat',header=TRUE)
a<-table.element(a,r.w$statistic[[1]])
a<-table.row.end(a)
a<-table.row.start(a)
a<-table.element(a,'df',header=TRUE)
a<-table.element(a,r.w$parameter[[1]])
a<-table.row.end(a)
a<-table.row.start(a)
a<-table.element(a,'p-value',header=TRUE)
a<-table.element(a,r.w$p.value)
a<-table.row.end(a)
a<-table.row.start(a)
a<-table.element(a,'H0 value',header=TRUE)
a<-table.element(a,r.w$null.value[[1]])
a<-table.row.end(a)
a<-table.row.start(a)
a<-table.element(a,'Alternative',header=TRUE)
a<-table.element(a,r.w$alternative)
a<-table.row.end(a)
a<-table.row.start(a)
a<-table.element(a,'CI Level',header=TRUE)
a<-table.element(a,attr(r.w$conf.int,'conf.level'))
a<-table.row.end(a)
a<-table.row.start(a)
a<-table.element(a,'CI',header=TRUE)
a<-table.element(a,paste('[',r.w$conf.int[1],',',r.w$conf.int[2],']',sep=''))
a<-table.row.end(a)
a<-table.end(a)
table.save(a,file='mytable1.tab')
a<-table.start()
a<-table.row.start(a)
a<-table.element(a,paste('Wicoxon rank sum test with continuity correction (',par5,')',sep=''),2,TRUE)
a<-table.row.end(a)
a<-table.row.start(a)
a<-table.element(a,'W',header=TRUE)
a<-table.element(a,w.t$statistic[[1]])
a<-table.row.end(a)
a<-table.row.start(a)
a<-table.element(a,'p-value',header=TRUE)
a<-table.element(a,w.t$p.value)
a<-table.row.end(a)
a<-table.row.start(a)
a<-table.element(a,'H0 value',header=TRUE)
a<-table.element(a,w.t$null.value[[1]])
a<-table.row.end(a)
a<-table.row.start(a)
a<-table.element(a,'Alternative',header=TRUE)
a<-table.element(a,w.t$alternative)
a<-table.row.end(a)
a<-table.row.start(a)
a<-table.element(a,'Kolmogorov-Smirnov Test to compare Distributions of two Samples',2,TRUE)
a<-table.row.end(a)
a<-table.row.start(a)
a<-table.element(a,'KS Statistic',header=TRUE)
a<-table.element(a,ks.t$statistic[[1]])
a<-table.row.end(a)
a<-table.row.start(a)
a<-table.element(a,'p-value',header=TRUE)
a<-table.element(a,ks.t$p.value)
a<-table.row.end(a)
a<-table.row.start(a)
a<-table.element(a,'Kolmogorov-Smirnov Test to compare Distributional Shape of two Samples',2,TRUE)
a<-table.row.end(a)
a<-table.row.start(a)
a<-table.element(a,'KS Statistic',header=TRUE)
a<-table.element(a,ks1.t$statistic[[1]])
a<-table.row.end(a)
a<-table.row.start(a)
a<-table.element(a,'p-value',header=TRUE)
a<-table.element(a,ks1.t$p.value)
a<-table.row.end(a)
a<-table.end(a)
table.save(a,file='mytable2.tab')