Free Statistics

of Irreproducible Research!

Author's title

Author*The author of this computation has been verified*
R Software Modulerwasp_multipleregression.wasp
Title produced by softwareMultiple Regression
Date of computationFri, 21 Dec 2012 06:23:15 -0500
Cite this page as followsStatistical Computations at FreeStatistics.org, Office for Research Development and Education, URL https://freestatistics.org/blog/index.php?v=date/2012/Dec/21/t1356089106kqme51f9p8kesug.htm/, Retrieved Fri, 03 May 2024 04:59:02 +0000
Statistical Computations at FreeStatistics.org, Office for Research Development and Education, URL https://freestatistics.org/blog/index.php?pk=203493, Retrieved Fri, 03 May 2024 04:59:02 +0000
QR Codes:

Original text written by user:
IsPrivate?No (this computation is public)
User-defined keywords
Estimated Impact81
Family? (F = Feedback message, R = changed R code, M = changed R Module, P = changed Parameters, D = changed Data)
-       [Multiple Regression] [] [2012-12-21 11:23:15] [d34711fcbd2d57f6b4823916e70e307b] [Current]
Feedback Forum

Post a new message
Dataseries X:
120,9	510
119,6	514
125,9	517
116,1	508
107,5	493
116,7	490
112,5	469
113	478
126,4	528
114,1	534
112,5	518
112,4	506
113,1	502
116,3	516
111,7	528
118,8	533
116,5	536
125,1	537
113,1	524
119,6	536
114,4	587
114	597
117,8	581
117	564
120,9	558
115	575
117,3	580
119,4	575
114,9	563
125,8	552
117,6	537
117,6	545
114,9	601
121,9	604
117	586
106,4	564
110,5	549
113,6	551
114,2	556
125,4	548
124,6	540
120,2	531
120,8	521
111,4	519
124,1	572
120,2	581
125,5	563
116	548
117	539
105,7	541
102	562
106,4	559
96,9	546
107,6	536
98,8	528
101,1	530
105,7	582
104,6	599
103,2	584


Summary of computational transaction
Raw Inputview raw input (R code)
Raw Outputview raw output of R engine
Computing time8 seconds
R Server'Gertrude Mary Cox' @ cox.wessa.net

\begin{tabular}{lllllllll}
\hline
Summary of computational transaction \tabularnewline
Raw Input & view raw input (R code)  \tabularnewline
Raw Output & view raw output of R engine  \tabularnewline
Computing time & 8 seconds \tabularnewline
R Server & 'Gertrude Mary Cox' @ cox.wessa.net \tabularnewline
\hline
\end{tabular}
%Source: https://freestatistics.org/blog/index.php?pk=203493&T=0

[TABLE]
[ROW][C]Summary of computational transaction[/C][/ROW]
[ROW][C]Raw Input[/C][C]view raw input (R code) [/C][/ROW]
[ROW][C]Raw Output[/C][C]view raw output of R engine [/C][/ROW]
[ROW][C]Computing time[/C][C]8 seconds[/C][/ROW]
[ROW][C]R Server[/C][C]'Gertrude Mary Cox' @ cox.wessa.net[/C][/ROW]
[/TABLE]
Source: https://freestatistics.org/blog/index.php?pk=203493&T=0

Globally Unique Identifier (entire table): ba.freestatistics.org/blog/index.php?pk=203493&T=0

As an alternative you can also use a QR Code:  

The GUIDs for individual cells are displayed in the table below:

Summary of computational transaction
Raw Inputview raw input (R code)
Raw Outputview raw output of R engine
Computing time8 seconds
R Server'Gertrude Mary Cox' @ cox.wessa.net


Multiple Linear Regression - Estimated Regression Equation
Chemischenijverheid[t] = + 115.915011590225 -0.00186068543846304Werkloosheid[t] + e[t]

\begin{tabular}{lllllllll}
\hline
Multiple Linear Regression - Estimated Regression Equation \tabularnewline
Chemischenijverheid[t] =  +  115.915011590225 -0.00186068543846304Werkloosheid[t]  + e[t] \tabularnewline
\hline
\end{tabular}
%Source: https://freestatistics.org/blog/index.php?pk=203493&T=1

[TABLE]
[ROW][C]Multiple Linear Regression - Estimated Regression Equation[/C][/ROW]
[ROW][C]Chemischenijverheid[t] =  +  115.915011590225 -0.00186068543846304Werkloosheid[t]  + e[t][/C][/ROW]
[/TABLE]
Source: https://freestatistics.org/blog/index.php?pk=203493&T=1

Globally Unique Identifier (entire table): ba.freestatistics.org/blog/index.php?pk=203493&T=1

As an alternative you can also use a QR Code:  

The GUIDs for individual cells are displayed in the table below:

Multiple Linear Regression - Estimated Regression Equation
Chemischenijverheid[t] = + 115.915011590225 -0.00186068543846304Werkloosheid[t] + e[t]


Multiple Linear Regression - Ordinary Least Squares
VariableParameterS.D.T-STATH0: parameter = 02-tail p-value1-tail p-value
(Intercept)115.91501159022516.4199737.059400
Werkloosheid-0.001860685438463040.030103-0.06180.9509290.475465

\begin{tabular}{lllllllll}
\hline
Multiple Linear Regression - Ordinary Least Squares \tabularnewline
Variable & Parameter & S.D. & T-STATH0: parameter = 0 & 2-tail p-value & 1-tail p-value \tabularnewline
(Intercept) & 115.915011590225 & 16.419973 & 7.0594 & 0 & 0 \tabularnewline
Werkloosheid & -0.00186068543846304 & 0.030103 & -0.0618 & 0.950929 & 0.475465 \tabularnewline
\hline
\end{tabular}
%Source: https://freestatistics.org/blog/index.php?pk=203493&T=2

[TABLE]
[ROW][C]Multiple Linear Regression - Ordinary Least Squares[/C][/ROW]
[ROW][C]Variable[/C][C]Parameter[/C][C]S.D.[/C][C]T-STATH0: parameter = 0[/C][C]2-tail p-value[/C][C]1-tail p-value[/C][/ROW]
[ROW][C](Intercept)[/C][C]115.915011590225[/C][C]16.419973[/C][C]7.0594[/C][C]0[/C][C]0[/C][/ROW]
[ROW][C]Werkloosheid[/C][C]-0.00186068543846304[/C][C]0.030103[/C][C]-0.0618[/C][C]0.950929[/C][C]0.475465[/C][/ROW]
[/TABLE]
Source: https://freestatistics.org/blog/index.php?pk=203493&T=2

Globally Unique Identifier (entire table): ba.freestatistics.org/blog/index.php?pk=203493&T=2

As an alternative you can also use a QR Code:  

The GUIDs for individual cells are displayed in the table below:

Multiple Linear Regression - Ordinary Least Squares
VariableParameterS.D.T-STATH0: parameter = 02-tail p-value1-tail p-value
(Intercept)115.91501159022516.4199737.059400
Werkloosheid-0.001860685438463040.030103-0.06180.9509290.475465


Multiple Linear Regression - Regression Statistics
Multiple R0.00818684062857802
R-squared6.70243594777358e-05
Adjusted R-squared-0.0174756594236893
F-TEST (value)0.0038206445664858
F-TEST (DF numerator)1
F-TEST (DF denominator)57
p-value0.950929288301462
Multiple Linear Regression - Residual Statistics
Residual Standard Deviation7.13249970276784
Sum Squared Residuals2899.73546456905

\begin{tabular}{lllllllll}
\hline
Multiple Linear Regression - Regression Statistics \tabularnewline
Multiple R & 0.00818684062857802 \tabularnewline
R-squared & 6.70243594777358e-05 \tabularnewline
Adjusted R-squared & -0.0174756594236893 \tabularnewline
F-TEST (value) & 0.0038206445664858 \tabularnewline
F-TEST (DF numerator) & 1 \tabularnewline
F-TEST (DF denominator) & 57 \tabularnewline
p-value & 0.950929288301462 \tabularnewline
Multiple Linear Regression - Residual Statistics \tabularnewline
Residual Standard Deviation & 7.13249970276784 \tabularnewline
Sum Squared Residuals & 2899.73546456905 \tabularnewline
\hline
\end{tabular}
%Source: https://freestatistics.org/blog/index.php?pk=203493&T=3

[TABLE]
[ROW][C]Multiple Linear Regression - Regression Statistics[/C][/ROW]
[ROW][C]Multiple R[/C][C]0.00818684062857802[/C][/ROW]
[ROW][C]R-squared[/C][C]6.70243594777358e-05[/C][/ROW]
[ROW][C]Adjusted R-squared[/C][C]-0.0174756594236893[/C][/ROW]
[ROW][C]F-TEST (value)[/C][C]0.0038206445664858[/C][/ROW]
[ROW][C]F-TEST (DF numerator)[/C][C]1[/C][/ROW]
[ROW][C]F-TEST (DF denominator)[/C][C]57[/C][/ROW]
[ROW][C]p-value[/C][C]0.950929288301462[/C][/ROW]
[ROW][C]Multiple Linear Regression - Residual Statistics[/C][/ROW]
[ROW][C]Residual Standard Deviation[/C][C]7.13249970276784[/C][/ROW]
[ROW][C]Sum Squared Residuals[/C][C]2899.73546456905[/C][/ROW]
[/TABLE]
Source: https://freestatistics.org/blog/index.php?pk=203493&T=3

Globally Unique Identifier (entire table): ba.freestatistics.org/blog/index.php?pk=203493&T=3

As an alternative you can also use a QR Code:  

The GUIDs for individual cells are displayed in the table below:

Multiple Linear Regression - Regression Statistics
Multiple R0.00818684062857802
R-squared6.70243594777358e-05
Adjusted R-squared-0.0174756594236893
F-TEST (value)0.0038206445664858
F-TEST (DF numerator)1
F-TEST (DF denominator)57
p-value0.950929288301462
Multiple Linear Regression - Residual Statistics
Residual Standard Deviation7.13249970276784
Sum Squared Residuals2899.73546456905


Multiple Linear Regression - Actuals, Interpolation, and Residuals
Time or IndexActualsInterpolationForecastResidualsPrediction Error
1120.9114.9660620166095.93393798339135
2119.6114.9586192748554.64138072514532
3125.9114.95303721853910.9469627814607
4116.1114.9697833874851.13021661251454
5107.5114.997693669062-7.4976936690624
6116.7115.0032757253781.69672427462222
7112.5115.042350119586-2.54235011958551
8113115.025603950639-2.02560395063934
9126.4114.93256967871611.4674303212838
10114.1114.921405566085-0.821405566085417
11112.5114.951176533101-2.45117653310082
12112.4114.973504758362-2.57350475836237
13113.1114.980947500116-1.88094750011623
14116.3114.9548979039781.34510209602225
15111.7114.932569678716-3.23256967871619
16118.8114.9232662515243.87673374847612
17116.5114.9176841952081.58231580479151
18125.1114.9158235097710.18417649023
19113.1114.94001242047-1.84001242047005
20119.6114.9176841952084.68231580479151
21114.4114.822789237847-0.422789237846864
22114114.804182383462-0.80418238346224
23117.8114.8339533504782.96604664952235
24117114.8655850029322.13441499706848
25120.9114.8767491155626.02325088443771
26115114.8451174631080.154882536891573
27117.3114.8358140359162.46418596408389
28119.4114.8451174631084.55488253689158
29114.9114.867445688370.0325543116300225
30125.8114.88791322819310.9120867718069
31117.6114.915823509772.68417649022997
32117.6114.9009380262622.69906197373768
33114.9114.7967396417080.103260358291618
34121.9114.7911575853937.10884241460701
35117114.8246499232852.17535007671467
36106.4114.865585002932-8.46558500293152
37110.5114.893495284508-4.39349528450847
38113.6114.889773913632-1.28977391363155
39114.2114.880470486439-0.680470486439222
40125.4114.89535596994710.5046440300531
41124.6114.9102414534559.68975854654536
42120.2114.9269876224015.2730123775992
43120.8114.9455944767855.85440552321457
44111.4114.949315847662-3.54931584766235
45124.1114.8506995194249.24930048057618
46120.2114.8339533504785.36604664952235
47125.5114.8674456883710.63255431163
48116114.8953559699471.10464403005307
49117114.9121021388932.0878978611069
50105.7114.908380768016-9.20838076801617
51102114.869306373808-12.8693063738084
52106.4114.874888430124-8.47488843012383
5396.9114.899077340824-17.9990773408238
54107.6114.917684195208-7.31768419520849
5598.8114.932569678716-16.1325696787162
56101.1114.928848307839-13.8288483078393
57105.7114.832092665039-9.13209266503918
58104.6114.800461012585-10.2004610125853
59103.2114.828371294162-11.6283712941623

\begin{tabular}{lllllllll}
\hline
Multiple Linear Regression - Actuals, Interpolation, and Residuals \tabularnewline
Time or Index & Actuals & InterpolationForecast & ResidualsPrediction Error \tabularnewline
1 & 120.9 & 114.966062016609 & 5.93393798339135 \tabularnewline
2 & 119.6 & 114.958619274855 & 4.64138072514532 \tabularnewline
3 & 125.9 & 114.953037218539 & 10.9469627814607 \tabularnewline
4 & 116.1 & 114.969783387485 & 1.13021661251454 \tabularnewline
5 & 107.5 & 114.997693669062 & -7.4976936690624 \tabularnewline
6 & 116.7 & 115.003275725378 & 1.69672427462222 \tabularnewline
7 & 112.5 & 115.042350119586 & -2.54235011958551 \tabularnewline
8 & 113 & 115.025603950639 & -2.02560395063934 \tabularnewline
9 & 126.4 & 114.932569678716 & 11.4674303212838 \tabularnewline
10 & 114.1 & 114.921405566085 & -0.821405566085417 \tabularnewline
11 & 112.5 & 114.951176533101 & -2.45117653310082 \tabularnewline
12 & 112.4 & 114.973504758362 & -2.57350475836237 \tabularnewline
13 & 113.1 & 114.980947500116 & -1.88094750011623 \tabularnewline
14 & 116.3 & 114.954897903978 & 1.34510209602225 \tabularnewline
15 & 111.7 & 114.932569678716 & -3.23256967871619 \tabularnewline
16 & 118.8 & 114.923266251524 & 3.87673374847612 \tabularnewline
17 & 116.5 & 114.917684195208 & 1.58231580479151 \tabularnewline
18 & 125.1 & 114.91582350977 & 10.18417649023 \tabularnewline
19 & 113.1 & 114.94001242047 & -1.84001242047005 \tabularnewline
20 & 119.6 & 114.917684195208 & 4.68231580479151 \tabularnewline
21 & 114.4 & 114.822789237847 & -0.422789237846864 \tabularnewline
22 & 114 & 114.804182383462 & -0.80418238346224 \tabularnewline
23 & 117.8 & 114.833953350478 & 2.96604664952235 \tabularnewline
24 & 117 & 114.865585002932 & 2.13441499706848 \tabularnewline
25 & 120.9 & 114.876749115562 & 6.02325088443771 \tabularnewline
26 & 115 & 114.845117463108 & 0.154882536891573 \tabularnewline
27 & 117.3 & 114.835814035916 & 2.46418596408389 \tabularnewline
28 & 119.4 & 114.845117463108 & 4.55488253689158 \tabularnewline
29 & 114.9 & 114.86744568837 & 0.0325543116300225 \tabularnewline
30 & 125.8 & 114.887913228193 & 10.9120867718069 \tabularnewline
31 & 117.6 & 114.91582350977 & 2.68417649022997 \tabularnewline
32 & 117.6 & 114.900938026262 & 2.69906197373768 \tabularnewline
33 & 114.9 & 114.796739641708 & 0.103260358291618 \tabularnewline
34 & 121.9 & 114.791157585393 & 7.10884241460701 \tabularnewline
35 & 117 & 114.824649923285 & 2.17535007671467 \tabularnewline
36 & 106.4 & 114.865585002932 & -8.46558500293152 \tabularnewline
37 & 110.5 & 114.893495284508 & -4.39349528450847 \tabularnewline
38 & 113.6 & 114.889773913632 & -1.28977391363155 \tabularnewline
39 & 114.2 & 114.880470486439 & -0.680470486439222 \tabularnewline
40 & 125.4 & 114.895355969947 & 10.5046440300531 \tabularnewline
41 & 124.6 & 114.910241453455 & 9.68975854654536 \tabularnewline
42 & 120.2 & 114.926987622401 & 5.2730123775992 \tabularnewline
43 & 120.8 & 114.945594476785 & 5.85440552321457 \tabularnewline
44 & 111.4 & 114.949315847662 & -3.54931584766235 \tabularnewline
45 & 124.1 & 114.850699519424 & 9.24930048057618 \tabularnewline
46 & 120.2 & 114.833953350478 & 5.36604664952235 \tabularnewline
47 & 125.5 & 114.86744568837 & 10.63255431163 \tabularnewline
48 & 116 & 114.895355969947 & 1.10464403005307 \tabularnewline
49 & 117 & 114.912102138893 & 2.0878978611069 \tabularnewline
50 & 105.7 & 114.908380768016 & -9.20838076801617 \tabularnewline
51 & 102 & 114.869306373808 & -12.8693063738084 \tabularnewline
52 & 106.4 & 114.874888430124 & -8.47488843012383 \tabularnewline
53 & 96.9 & 114.899077340824 & -17.9990773408238 \tabularnewline
54 & 107.6 & 114.917684195208 & -7.31768419520849 \tabularnewline
55 & 98.8 & 114.932569678716 & -16.1325696787162 \tabularnewline
56 & 101.1 & 114.928848307839 & -13.8288483078393 \tabularnewline
57 & 105.7 & 114.832092665039 & -9.13209266503918 \tabularnewline
58 & 104.6 & 114.800461012585 & -10.2004610125853 \tabularnewline
59 & 103.2 & 114.828371294162 & -11.6283712941623 \tabularnewline
\hline
\end{tabular}
%Source: https://freestatistics.org/blog/index.php?pk=203493&T=4

[TABLE]
[ROW][C]Multiple Linear Regression - Actuals, Interpolation, and Residuals[/C][/ROW]
[ROW][C]Time or Index[/C][C]Actuals[/C][C]InterpolationForecast[/C][C]ResidualsPrediction Error[/C][/ROW]
[ROW][C]1[/C][C]120.9[/C][C]114.966062016609[/C][C]5.93393798339135[/C][/ROW]
[ROW][C]2[/C][C]119.6[/C][C]114.958619274855[/C][C]4.64138072514532[/C][/ROW]
[ROW][C]3[/C][C]125.9[/C][C]114.953037218539[/C][C]10.9469627814607[/C][/ROW]
[ROW][C]4[/C][C]116.1[/C][C]114.969783387485[/C][C]1.13021661251454[/C][/ROW]
[ROW][C]5[/C][C]107.5[/C][C]114.997693669062[/C][C]-7.4976936690624[/C][/ROW]
[ROW][C]6[/C][C]116.7[/C][C]115.003275725378[/C][C]1.69672427462222[/C][/ROW]
[ROW][C]7[/C][C]112.5[/C][C]115.042350119586[/C][C]-2.54235011958551[/C][/ROW]
[ROW][C]8[/C][C]113[/C][C]115.025603950639[/C][C]-2.02560395063934[/C][/ROW]
[ROW][C]9[/C][C]126.4[/C][C]114.932569678716[/C][C]11.4674303212838[/C][/ROW]
[ROW][C]10[/C][C]114.1[/C][C]114.921405566085[/C][C]-0.821405566085417[/C][/ROW]
[ROW][C]11[/C][C]112.5[/C][C]114.951176533101[/C][C]-2.45117653310082[/C][/ROW]
[ROW][C]12[/C][C]112.4[/C][C]114.973504758362[/C][C]-2.57350475836237[/C][/ROW]
[ROW][C]13[/C][C]113.1[/C][C]114.980947500116[/C][C]-1.88094750011623[/C][/ROW]
[ROW][C]14[/C][C]116.3[/C][C]114.954897903978[/C][C]1.34510209602225[/C][/ROW]
[ROW][C]15[/C][C]111.7[/C][C]114.932569678716[/C][C]-3.23256967871619[/C][/ROW]
[ROW][C]16[/C][C]118.8[/C][C]114.923266251524[/C][C]3.87673374847612[/C][/ROW]
[ROW][C]17[/C][C]116.5[/C][C]114.917684195208[/C][C]1.58231580479151[/C][/ROW]
[ROW][C]18[/C][C]125.1[/C][C]114.91582350977[/C][C]10.18417649023[/C][/ROW]
[ROW][C]19[/C][C]113.1[/C][C]114.94001242047[/C][C]-1.84001242047005[/C][/ROW]
[ROW][C]20[/C][C]119.6[/C][C]114.917684195208[/C][C]4.68231580479151[/C][/ROW]
[ROW][C]21[/C][C]114.4[/C][C]114.822789237847[/C][C]-0.422789237846864[/C][/ROW]
[ROW][C]22[/C][C]114[/C][C]114.804182383462[/C][C]-0.80418238346224[/C][/ROW]
[ROW][C]23[/C][C]117.8[/C][C]114.833953350478[/C][C]2.96604664952235[/C][/ROW]
[ROW][C]24[/C][C]117[/C][C]114.865585002932[/C][C]2.13441499706848[/C][/ROW]
[ROW][C]25[/C][C]120.9[/C][C]114.876749115562[/C][C]6.02325088443771[/C][/ROW]
[ROW][C]26[/C][C]115[/C][C]114.845117463108[/C][C]0.154882536891573[/C][/ROW]
[ROW][C]27[/C][C]117.3[/C][C]114.835814035916[/C][C]2.46418596408389[/C][/ROW]
[ROW][C]28[/C][C]119.4[/C][C]114.845117463108[/C][C]4.55488253689158[/C][/ROW]
[ROW][C]29[/C][C]114.9[/C][C]114.86744568837[/C][C]0.0325543116300225[/C][/ROW]
[ROW][C]30[/C][C]125.8[/C][C]114.887913228193[/C][C]10.9120867718069[/C][/ROW]
[ROW][C]31[/C][C]117.6[/C][C]114.91582350977[/C][C]2.68417649022997[/C][/ROW]
[ROW][C]32[/C][C]117.6[/C][C]114.900938026262[/C][C]2.69906197373768[/C][/ROW]
[ROW][C]33[/C][C]114.9[/C][C]114.796739641708[/C][C]0.103260358291618[/C][/ROW]
[ROW][C]34[/C][C]121.9[/C][C]114.791157585393[/C][C]7.10884241460701[/C][/ROW]
[ROW][C]35[/C][C]117[/C][C]114.824649923285[/C][C]2.17535007671467[/C][/ROW]
[ROW][C]36[/C][C]106.4[/C][C]114.865585002932[/C][C]-8.46558500293152[/C][/ROW]
[ROW][C]37[/C][C]110.5[/C][C]114.893495284508[/C][C]-4.39349528450847[/C][/ROW]
[ROW][C]38[/C][C]113.6[/C][C]114.889773913632[/C][C]-1.28977391363155[/C][/ROW]
[ROW][C]39[/C][C]114.2[/C][C]114.880470486439[/C][C]-0.680470486439222[/C][/ROW]
[ROW][C]40[/C][C]125.4[/C][C]114.895355969947[/C][C]10.5046440300531[/C][/ROW]
[ROW][C]41[/C][C]124.6[/C][C]114.910241453455[/C][C]9.68975854654536[/C][/ROW]
[ROW][C]42[/C][C]120.2[/C][C]114.926987622401[/C][C]5.2730123775992[/C][/ROW]
[ROW][C]43[/C][C]120.8[/C][C]114.945594476785[/C][C]5.85440552321457[/C][/ROW]
[ROW][C]44[/C][C]111.4[/C][C]114.949315847662[/C][C]-3.54931584766235[/C][/ROW]
[ROW][C]45[/C][C]124.1[/C][C]114.850699519424[/C][C]9.24930048057618[/C][/ROW]
[ROW][C]46[/C][C]120.2[/C][C]114.833953350478[/C][C]5.36604664952235[/C][/ROW]
[ROW][C]47[/C][C]125.5[/C][C]114.86744568837[/C][C]10.63255431163[/C][/ROW]
[ROW][C]48[/C][C]116[/C][C]114.895355969947[/C][C]1.10464403005307[/C][/ROW]
[ROW][C]49[/C][C]117[/C][C]114.912102138893[/C][C]2.0878978611069[/C][/ROW]
[ROW][C]50[/C][C]105.7[/C][C]114.908380768016[/C][C]-9.20838076801617[/C][/ROW]
[ROW][C]51[/C][C]102[/C][C]114.869306373808[/C][C]-12.8693063738084[/C][/ROW]
[ROW][C]52[/C][C]106.4[/C][C]114.874888430124[/C][C]-8.47488843012383[/C][/ROW]
[ROW][C]53[/C][C]96.9[/C][C]114.899077340824[/C][C]-17.9990773408238[/C][/ROW]
[ROW][C]54[/C][C]107.6[/C][C]114.917684195208[/C][C]-7.31768419520849[/C][/ROW]
[ROW][C]55[/C][C]98.8[/C][C]114.932569678716[/C][C]-16.1325696787162[/C][/ROW]
[ROW][C]56[/C][C]101.1[/C][C]114.928848307839[/C][C]-13.8288483078393[/C][/ROW]
[ROW][C]57[/C][C]105.7[/C][C]114.832092665039[/C][C]-9.13209266503918[/C][/ROW]
[ROW][C]58[/C][C]104.6[/C][C]114.800461012585[/C][C]-10.2004610125853[/C][/ROW]
[ROW][C]59[/C][C]103.2[/C][C]114.828371294162[/C][C]-11.6283712941623[/C][/ROW]
[/TABLE]
Source: https://freestatistics.org/blog/index.php?pk=203493&T=4

Globally Unique Identifier (entire table): ba.freestatistics.org/blog/index.php?pk=203493&T=4

As an alternative you can also use a QR Code:  

The GUIDs for individual cells are displayed in the table below:

Multiple Linear Regression - Actuals, Interpolation, and Residuals
Time or IndexActualsInterpolationForecastResidualsPrediction Error
1120.9114.9660620166095.93393798339135
2119.6114.9586192748554.64138072514532
3125.9114.95303721853910.9469627814607
4116.1114.9697833874851.13021661251454
5107.5114.997693669062-7.4976936690624
6116.7115.0032757253781.69672427462222
7112.5115.042350119586-2.54235011958551
8113115.025603950639-2.02560395063934
9126.4114.93256967871611.4674303212838
10114.1114.921405566085-0.821405566085417
11112.5114.951176533101-2.45117653310082
12112.4114.973504758362-2.57350475836237
13113.1114.980947500116-1.88094750011623
14116.3114.9548979039781.34510209602225
15111.7114.932569678716-3.23256967871619
16118.8114.9232662515243.87673374847612
17116.5114.9176841952081.58231580479151
18125.1114.9158235097710.18417649023
19113.1114.94001242047-1.84001242047005
20119.6114.9176841952084.68231580479151
21114.4114.822789237847-0.422789237846864
22114114.804182383462-0.80418238346224
23117.8114.8339533504782.96604664952235
24117114.8655850029322.13441499706848
25120.9114.8767491155626.02325088443771
26115114.8451174631080.154882536891573
27117.3114.8358140359162.46418596408389
28119.4114.8451174631084.55488253689158
29114.9114.867445688370.0325543116300225
30125.8114.88791322819310.9120867718069
31117.6114.915823509772.68417649022997
32117.6114.9009380262622.69906197373768
33114.9114.7967396417080.103260358291618
34121.9114.7911575853937.10884241460701
35117114.8246499232852.17535007671467
36106.4114.865585002932-8.46558500293152
37110.5114.893495284508-4.39349528450847
38113.6114.889773913632-1.28977391363155
39114.2114.880470486439-0.680470486439222
40125.4114.89535596994710.5046440300531
41124.6114.9102414534559.68975854654536
42120.2114.9269876224015.2730123775992
43120.8114.9455944767855.85440552321457
44111.4114.949315847662-3.54931584766235
45124.1114.8506995194249.24930048057618
46120.2114.8339533504785.36604664952235
47125.5114.8674456883710.63255431163
48116114.8953559699471.10464403005307
49117114.9121021388932.0878978611069
50105.7114.908380768016-9.20838076801617
51102114.869306373808-12.8693063738084
52106.4114.874888430124-8.47488843012383
5396.9114.899077340824-17.9990773408238
54107.6114.917684195208-7.31768419520849
5598.8114.932569678716-16.1325696787162
56101.1114.928848307839-13.8288483078393
57105.7114.832092665039-9.13209266503918
58104.6114.800461012585-10.2004610125853
59103.2114.828371294162-11.6283712941623


Goldfeld-Quandt test for Heteroskedasticity
p-valuesAlternative Hypothesis
breakpoint indexgreater2-sidedless
50.03825985135798530.07651970271597070.961740148642015
60.1732191126896370.3464382253792740.826780887310363
70.1591953489700810.3183906979401620.840804651029919
80.08637026254310320.1727405250862060.913629737456897
90.05570634895567720.1114126979113540.944293651044323
100.1495811895765870.2991623791531740.850418810423413
110.150746497805470.301492995610940.84925350219453
120.1164164000558230.2328328001116450.883583599944177
130.07846137004300070.1569227400860010.921538629956999
140.04825187146159470.09650374292318940.951748128538405
150.05300805137423560.1060161027484710.946991948625764
160.03238546804295050.06477093608590090.967614531957049
170.02009606890012580.04019213780025160.979903931099874
180.02306702269550940.04613404539101890.976932977304491
190.01781443199671380.03562886399342770.982185568003286
200.01098129056564630.02196258113129250.989018709434354
210.01416449160476150.0283289832095230.985835508395238
220.01179168024484180.02358336048968360.988208319755158
230.00681254831798610.01362509663597220.993187451682014
240.00381519624546130.007630392490922610.996184803754539
250.002779063120474880.005558126240949760.997220936879525
260.0016415287642910.0032830575285820.998358471235709
270.0008654461031365750.001730892206273150.999134553896863
280.0004987234638336540.0009974469276673090.999501276536166
290.00026804505017160.0005360901003431990.999731954949828
300.0007573225432581890.001514645086516380.999242677456742
310.0004261320505520860.0008522641011041730.999573867949448
320.0002351078822362770.0004702157644725540.999764892117764
330.000138482923305510.000276965846611020.999861517076694
340.0001169011594653120.0002338023189306250.999883098840535
356.58153597422557e-050.0001316307194845110.999934184640258
360.0002028508491049560.0004057016982099110.999797149150895
370.0001613000035155780.0003226000070311560.999838699996484
388.56313650410567e-050.0001712627300821130.999914368634959
394.30418143389506e-058.60836286779011e-050.999956958185661
400.0001528838450922280.0003057676901844550.999847116154908
410.0004501105319261150.0009002210638522310.999549889468074
420.0004963820567847960.0009927641135695920.999503617943215
430.0009234418714091220.001846883742818240.999076558128591
440.0007209457824983910.001441891564996780.999279054217502
450.002767681653434890.005535363306869770.997232318346565
460.004968331442335590.009936662884671170.995031668557664
470.1236842946292250.2473685892584490.876315705370775
480.2604477709201310.5208955418402620.739552229079869
490.8332184281318180.3335631437363640.166781571868182
500.8445822076780310.3108355846439370.155417792321969
510.826181262637290.347637474725420.17381873736271
520.8058555705087610.3882888589824770.194144429491239
530.8933294730951920.2133410538096160.106670526904808
540.9824418681947130.03511626361057360.0175581318052868

\begin{tabular}{lllllllll}
\hline
Goldfeld-Quandt test for Heteroskedasticity \tabularnewline
p-values & Alternative Hypothesis \tabularnewline
breakpoint index & greater & 2-sided & less \tabularnewline
5 & 0.0382598513579853 & 0.0765197027159707 & 0.961740148642015 \tabularnewline
6 & 0.173219112689637 & 0.346438225379274 & 0.826780887310363 \tabularnewline
7 & 0.159195348970081 & 0.318390697940162 & 0.840804651029919 \tabularnewline
8 & 0.0863702625431032 & 0.172740525086206 & 0.913629737456897 \tabularnewline
9 & 0.0557063489556772 & 0.111412697911354 & 0.944293651044323 \tabularnewline
10 & 0.149581189576587 & 0.299162379153174 & 0.850418810423413 \tabularnewline
11 & 0.15074649780547 & 0.30149299561094 & 0.84925350219453 \tabularnewline
12 & 0.116416400055823 & 0.232832800111645 & 0.883583599944177 \tabularnewline
13 & 0.0784613700430007 & 0.156922740086001 & 0.921538629956999 \tabularnewline
14 & 0.0482518714615947 & 0.0965037429231894 & 0.951748128538405 \tabularnewline
15 & 0.0530080513742356 & 0.106016102748471 & 0.946991948625764 \tabularnewline
16 & 0.0323854680429505 & 0.0647709360859009 & 0.967614531957049 \tabularnewline
17 & 0.0200960689001258 & 0.0401921378002516 & 0.979903931099874 \tabularnewline
18 & 0.0230670226955094 & 0.0461340453910189 & 0.976932977304491 \tabularnewline
19 & 0.0178144319967138 & 0.0356288639934277 & 0.982185568003286 \tabularnewline
20 & 0.0109812905656463 & 0.0219625811312925 & 0.989018709434354 \tabularnewline
21 & 0.0141644916047615 & 0.028328983209523 & 0.985835508395238 \tabularnewline
22 & 0.0117916802448418 & 0.0235833604896836 & 0.988208319755158 \tabularnewline
23 & 0.0068125483179861 & 0.0136250966359722 & 0.993187451682014 \tabularnewline
24 & 0.0038151962454613 & 0.00763039249092261 & 0.996184803754539 \tabularnewline
25 & 0.00277906312047488 & 0.00555812624094976 & 0.997220936879525 \tabularnewline
26 & 0.001641528764291 & 0.003283057528582 & 0.998358471235709 \tabularnewline
27 & 0.000865446103136575 & 0.00173089220627315 & 0.999134553896863 \tabularnewline
28 & 0.000498723463833654 & 0.000997446927667309 & 0.999501276536166 \tabularnewline
29 & 0.0002680450501716 & 0.000536090100343199 & 0.999731954949828 \tabularnewline
30 & 0.000757322543258189 & 0.00151464508651638 & 0.999242677456742 \tabularnewline
31 & 0.000426132050552086 & 0.000852264101104173 & 0.999573867949448 \tabularnewline
32 & 0.000235107882236277 & 0.000470215764472554 & 0.999764892117764 \tabularnewline
33 & 0.00013848292330551 & 0.00027696584661102 & 0.999861517076694 \tabularnewline
34 & 0.000116901159465312 & 0.000233802318930625 & 0.999883098840535 \tabularnewline
35 & 6.58153597422557e-05 & 0.000131630719484511 & 0.999934184640258 \tabularnewline
36 & 0.000202850849104956 & 0.000405701698209911 & 0.999797149150895 \tabularnewline
37 & 0.000161300003515578 & 0.000322600007031156 & 0.999838699996484 \tabularnewline
38 & 8.56313650410567e-05 & 0.000171262730082113 & 0.999914368634959 \tabularnewline
39 & 4.30418143389506e-05 & 8.60836286779011e-05 & 0.999956958185661 \tabularnewline
40 & 0.000152883845092228 & 0.000305767690184455 & 0.999847116154908 \tabularnewline
41 & 0.000450110531926115 & 0.000900221063852231 & 0.999549889468074 \tabularnewline
42 & 0.000496382056784796 & 0.000992764113569592 & 0.999503617943215 \tabularnewline
43 & 0.000923441871409122 & 0.00184688374281824 & 0.999076558128591 \tabularnewline
44 & 0.000720945782498391 & 0.00144189156499678 & 0.999279054217502 \tabularnewline
45 & 0.00276768165343489 & 0.00553536330686977 & 0.997232318346565 \tabularnewline
46 & 0.00496833144233559 & 0.00993666288467117 & 0.995031668557664 \tabularnewline
47 & 0.123684294629225 & 0.247368589258449 & 0.876315705370775 \tabularnewline
48 & 0.260447770920131 & 0.520895541840262 & 0.739552229079869 \tabularnewline
49 & 0.833218428131818 & 0.333563143736364 & 0.166781571868182 \tabularnewline
50 & 0.844582207678031 & 0.310835584643937 & 0.155417792321969 \tabularnewline
51 & 0.82618126263729 & 0.34763747472542 & 0.17381873736271 \tabularnewline
52 & 0.805855570508761 & 0.388288858982477 & 0.194144429491239 \tabularnewline
53 & 0.893329473095192 & 0.213341053809616 & 0.106670526904808 \tabularnewline
54 & 0.982441868194713 & 0.0351162636105736 & 0.0175581318052868 \tabularnewline
\hline
\end{tabular}
%Source: https://freestatistics.org/blog/index.php?pk=203493&T=5

[TABLE]
[ROW][C]Goldfeld-Quandt test for Heteroskedasticity[/C][/ROW]
[ROW][C]p-values[/C][C]Alternative Hypothesis[/C][/ROW]
[ROW][C]breakpoint index[/C][C]greater[/C][C]2-sided[/C][C]less[/C][/ROW]
[ROW][C]5[/C][C]0.0382598513579853[/C][C]0.0765197027159707[/C][C]0.961740148642015[/C][/ROW]
[ROW][C]6[/C][C]0.173219112689637[/C][C]0.346438225379274[/C][C]0.826780887310363[/C][/ROW]
[ROW][C]7[/C][C]0.159195348970081[/C][C]0.318390697940162[/C][C]0.840804651029919[/C][/ROW]
[ROW][C]8[/C][C]0.0863702625431032[/C][C]0.172740525086206[/C][C]0.913629737456897[/C][/ROW]
[ROW][C]9[/C][C]0.0557063489556772[/C][C]0.111412697911354[/C][C]0.944293651044323[/C][/ROW]
[ROW][C]10[/C][C]0.149581189576587[/C][C]0.299162379153174[/C][C]0.850418810423413[/C][/ROW]
[ROW][C]11[/C][C]0.15074649780547[/C][C]0.30149299561094[/C][C]0.84925350219453[/C][/ROW]
[ROW][C]12[/C][C]0.116416400055823[/C][C]0.232832800111645[/C][C]0.883583599944177[/C][/ROW]
[ROW][C]13[/C][C]0.0784613700430007[/C][C]0.156922740086001[/C][C]0.921538629956999[/C][/ROW]
[ROW][C]14[/C][C]0.0482518714615947[/C][C]0.0965037429231894[/C][C]0.951748128538405[/C][/ROW]
[ROW][C]15[/C][C]0.0530080513742356[/C][C]0.106016102748471[/C][C]0.946991948625764[/C][/ROW]
[ROW][C]16[/C][C]0.0323854680429505[/C][C]0.0647709360859009[/C][C]0.967614531957049[/C][/ROW]
[ROW][C]17[/C][C]0.0200960689001258[/C][C]0.0401921378002516[/C][C]0.979903931099874[/C][/ROW]
[ROW][C]18[/C][C]0.0230670226955094[/C][C]0.0461340453910189[/C][C]0.976932977304491[/C][/ROW]
[ROW][C]19[/C][C]0.0178144319967138[/C][C]0.0356288639934277[/C][C]0.982185568003286[/C][/ROW]
[ROW][C]20[/C][C]0.0109812905656463[/C][C]0.0219625811312925[/C][C]0.989018709434354[/C][/ROW]
[ROW][C]21[/C][C]0.0141644916047615[/C][C]0.028328983209523[/C][C]0.985835508395238[/C][/ROW]
[ROW][C]22[/C][C]0.0117916802448418[/C][C]0.0235833604896836[/C][C]0.988208319755158[/C][/ROW]
[ROW][C]23[/C][C]0.0068125483179861[/C][C]0.0136250966359722[/C][C]0.993187451682014[/C][/ROW]
[ROW][C]24[/C][C]0.0038151962454613[/C][C]0.00763039249092261[/C][C]0.996184803754539[/C][/ROW]
[ROW][C]25[/C][C]0.00277906312047488[/C][C]0.00555812624094976[/C][C]0.997220936879525[/C][/ROW]
[ROW][C]26[/C][C]0.001641528764291[/C][C]0.003283057528582[/C][C]0.998358471235709[/C][/ROW]
[ROW][C]27[/C][C]0.000865446103136575[/C][C]0.00173089220627315[/C][C]0.999134553896863[/C][/ROW]
[ROW][C]28[/C][C]0.000498723463833654[/C][C]0.000997446927667309[/C][C]0.999501276536166[/C][/ROW]
[ROW][C]29[/C][C]0.0002680450501716[/C][C]0.000536090100343199[/C][C]0.999731954949828[/C][/ROW]
[ROW][C]30[/C][C]0.000757322543258189[/C][C]0.00151464508651638[/C][C]0.999242677456742[/C][/ROW]
[ROW][C]31[/C][C]0.000426132050552086[/C][C]0.000852264101104173[/C][C]0.999573867949448[/C][/ROW]
[ROW][C]32[/C][C]0.000235107882236277[/C][C]0.000470215764472554[/C][C]0.999764892117764[/C][/ROW]
[ROW][C]33[/C][C]0.00013848292330551[/C][C]0.00027696584661102[/C][C]0.999861517076694[/C][/ROW]
[ROW][C]34[/C][C]0.000116901159465312[/C][C]0.000233802318930625[/C][C]0.999883098840535[/C][/ROW]
[ROW][C]35[/C][C]6.58153597422557e-05[/C][C]0.000131630719484511[/C][C]0.999934184640258[/C][/ROW]
[ROW][C]36[/C][C]0.000202850849104956[/C][C]0.000405701698209911[/C][C]0.999797149150895[/C][/ROW]
[ROW][C]37[/C][C]0.000161300003515578[/C][C]0.000322600007031156[/C][C]0.999838699996484[/C][/ROW]
[ROW][C]38[/C][C]8.56313650410567e-05[/C][C]0.000171262730082113[/C][C]0.999914368634959[/C][/ROW]
[ROW][C]39[/C][C]4.30418143389506e-05[/C][C]8.60836286779011e-05[/C][C]0.999956958185661[/C][/ROW]
[ROW][C]40[/C][C]0.000152883845092228[/C][C]0.000305767690184455[/C][C]0.999847116154908[/C][/ROW]
[ROW][C]41[/C][C]0.000450110531926115[/C][C]0.000900221063852231[/C][C]0.999549889468074[/C][/ROW]
[ROW][C]42[/C][C]0.000496382056784796[/C][C]0.000992764113569592[/C][C]0.999503617943215[/C][/ROW]
[ROW][C]43[/C][C]0.000923441871409122[/C][C]0.00184688374281824[/C][C]0.999076558128591[/C][/ROW]
[ROW][C]44[/C][C]0.000720945782498391[/C][C]0.00144189156499678[/C][C]0.999279054217502[/C][/ROW]
[ROW][C]45[/C][C]0.00276768165343489[/C][C]0.00553536330686977[/C][C]0.997232318346565[/C][/ROW]
[ROW][C]46[/C][C]0.00496833144233559[/C][C]0.00993666288467117[/C][C]0.995031668557664[/C][/ROW]
[ROW][C]47[/C][C]0.123684294629225[/C][C]0.247368589258449[/C][C]0.876315705370775[/C][/ROW]
[ROW][C]48[/C][C]0.260447770920131[/C][C]0.520895541840262[/C][C]0.739552229079869[/C][/ROW]
[ROW][C]49[/C][C]0.833218428131818[/C][C]0.333563143736364[/C][C]0.166781571868182[/C][/ROW]
[ROW][C]50[/C][C]0.844582207678031[/C][C]0.310835584643937[/C][C]0.155417792321969[/C][/ROW]
[ROW][C]51[/C][C]0.82618126263729[/C][C]0.34763747472542[/C][C]0.17381873736271[/C][/ROW]
[ROW][C]52[/C][C]0.805855570508761[/C][C]0.388288858982477[/C][C]0.194144429491239[/C][/ROW]
[ROW][C]53[/C][C]0.893329473095192[/C][C]0.213341053809616[/C][C]0.106670526904808[/C][/ROW]
[ROW][C]54[/C][C]0.982441868194713[/C][C]0.0351162636105736[/C][C]0.0175581318052868[/C][/ROW]
[/TABLE]
Source: https://freestatistics.org/blog/index.php?pk=203493&T=5

Globally Unique Identifier (entire table): ba.freestatistics.org/blog/index.php?pk=203493&T=5

As an alternative you can also use a QR Code:  

The GUIDs for individual cells are displayed in the table below:

Goldfeld-Quandt test for Heteroskedasticity
p-valuesAlternative Hypothesis
breakpoint indexgreater2-sidedless
50.03825985135798530.07651970271597070.961740148642015
60.1732191126896370.3464382253792740.826780887310363
70.1591953489700810.3183906979401620.840804651029919
80.08637026254310320.1727405250862060.913629737456897
90.05570634895567720.1114126979113540.944293651044323
100.1495811895765870.2991623791531740.850418810423413
110.150746497805470.301492995610940.84925350219453
120.1164164000558230.2328328001116450.883583599944177
130.07846137004300070.1569227400860010.921538629956999
140.04825187146159470.09650374292318940.951748128538405
150.05300805137423560.1060161027484710.946991948625764
160.03238546804295050.06477093608590090.967614531957049
170.02009606890012580.04019213780025160.979903931099874
180.02306702269550940.04613404539101890.976932977304491
190.01781443199671380.03562886399342770.982185568003286
200.01098129056564630.02196258113129250.989018709434354
210.01416449160476150.0283289832095230.985835508395238
220.01179168024484180.02358336048968360.988208319755158
230.00681254831798610.01362509663597220.993187451682014
240.00381519624546130.007630392490922610.996184803754539
250.002779063120474880.005558126240949760.997220936879525
260.0016415287642910.0032830575285820.998358471235709
270.0008654461031365750.001730892206273150.999134553896863
280.0004987234638336540.0009974469276673090.999501276536166
290.00026804505017160.0005360901003431990.999731954949828
300.0007573225432581890.001514645086516380.999242677456742
310.0004261320505520860.0008522641011041730.999573867949448
320.0002351078822362770.0004702157644725540.999764892117764
330.000138482923305510.000276965846611020.999861517076694
340.0001169011594653120.0002338023189306250.999883098840535
356.58153597422557e-050.0001316307194845110.999934184640258
360.0002028508491049560.0004057016982099110.999797149150895
370.0001613000035155780.0003226000070311560.999838699996484
388.56313650410567e-050.0001712627300821130.999914368634959
394.30418143389506e-058.60836286779011e-050.999956958185661
400.0001528838450922280.0003057676901844550.999847116154908
410.0004501105319261150.0009002210638522310.999549889468074
420.0004963820567847960.0009927641135695920.999503617943215
430.0009234418714091220.001846883742818240.999076558128591
440.0007209457824983910.001441891564996780.999279054217502
450.002767681653434890.005535363306869770.997232318346565
460.004968331442335590.009936662884671170.995031668557664
470.1236842946292250.2473685892584490.876315705370775
480.2604477709201310.5208955418402620.739552229079869
490.8332184281318180.3335631437363640.166781571868182
500.8445822076780310.3108355846439370.155417792321969
510.826181262637290.347637474725420.17381873736271
520.8058555705087610.3882888589824770.194144429491239
530.8933294730951920.2133410538096160.106670526904808
540.9824418681947130.03511626361057360.0175581318052868


Meta Analysis of Goldfeld-Quandt test for Heteroskedasticity
Description# significant tests% significant testsOK/NOK
1% type I error level230.46NOK
5% type I error level310.62NOK
10% type I error level340.68NOK

\begin{tabular}{lllllllll}
\hline
Meta Analysis of Goldfeld-Quandt test for Heteroskedasticity \tabularnewline
Description & # significant tests & % significant tests & OK/NOK \tabularnewline
1% type I error level & 23 & 0.46 & NOK \tabularnewline
5% type I error level & 31 & 0.62 & NOK \tabularnewline
10% type I error level & 34 & 0.68 & NOK \tabularnewline
\hline
\end{tabular}
%Source: https://freestatistics.org/blog/index.php?pk=203493&T=6

[TABLE]
[ROW][C]Meta Analysis of Goldfeld-Quandt test for Heteroskedasticity[/C][/ROW]
[ROW][C]Description[/C][C]# significant tests[/C][C]% significant tests[/C][C]OK/NOK[/C][/ROW]
[ROW][C]1% type I error level[/C][C]23[/C][C]0.46[/C][C]NOK[/C][/ROW]
[ROW][C]5% type I error level[/C][C]31[/C][C]0.62[/C][C]NOK[/C][/ROW]
[ROW][C]10% type I error level[/C][C]34[/C][C]0.68[/C][C]NOK[/C][/ROW]
[/TABLE]
Source: https://freestatistics.org/blog/index.php?pk=203493&T=6

Globally Unique Identifier (entire table): ba.freestatistics.org/blog/index.php?pk=203493&T=6

As an alternative you can also use a QR Code:  

The GUIDs for individual cells are displayed in the table below:

Meta Analysis of Goldfeld-Quandt test for Heteroskedasticity
Description# significant tests% significant testsOK/NOK
1% type I error level230.46NOK
5% type I error level310.62NOK
10% type I error level340.68NOK


Parameters (Session):
par1 = 1 ; par2 = Do not include Seasonal Dummies ; par3 = No Linear Trend ;
Parameters (R input):
par1 = 1 ; par2 = Do not include Seasonal Dummies ; par3 = No Linear Trend ;
R code (references can be found in the software module):
library(lattice)
library(lmtest)
n25 <- 25 #minimum number of obs. for Goldfeld-Quandt test
par1 <- as.numeric(par1)
x <- t(y)
k <- length(x[1,])
n <- length(x[,1])
x1 <- cbind(x[,par1], x[,1:k!=par1])
mycolnames <- c(colnames(x)[par1], colnames(x)[1:k!=par1])
colnames(x1) <- mycolnames #colnames(x)[par1]
x <- x1
if (par3 == 'First Differences'){
x2 <- array(0, dim=c(n-1,k), dimnames=list(1:(n-1), paste('(1-B)',colnames(x),sep='')))
for (i in 1:n-1) {
for (j in 1:k) {
x2[i,j] <- x[i+1,j] - x[i,j]
}
}
x <- x2
}
if (par2 == 'Include Monthly Dummies'){
x2 <- array(0, dim=c(n,11), dimnames=list(1:n, paste('M', seq(1:11), sep ='')))
for (i in 1:11){
x2[seq(i,n,12),i] <- 1
}
x <- cbind(x, x2)
}
if (par2 == 'Include Quarterly Dummies'){
x2 <- array(0, dim=c(n,3), dimnames=list(1:n, paste('Q', seq(1:3), sep ='')))
for (i in 1:3){
x2[seq(i,n,4),i] <- 1
}
x <- cbind(x, x2)
}
k <- length(x[1,])
if (par3 == 'Linear Trend'){
x <- cbind(x, c(1:n))
colnames(x)[k+1] <- 't'
}
x
k <- length(x[1,])
df <- as.data.frame(x)
(mylm <- lm(df))
(mysum <- summary(mylm))
if (n > n25) {
kp3 <- k + 3
nmkm3 <- n - k - 3
gqarr <- array(NA, dim=c(nmkm3-kp3+1,3))
numgqtests <- 0
numsignificant1 <- 0
numsignificant5 <- 0
numsignificant10 <- 0
for (mypoint in kp3:nmkm3) {
j <- 0
numgqtests <- numgqtests + 1
for (myalt in c('greater', 'two.sided', 'less')) {
j <- j + 1
gqarr[mypoint-kp3+1,j] <- gqtest(mylm, point=mypoint, alternative=myalt)$p.value
}
if (gqarr[mypoint-kp3+1,2] < 0.01) numsignificant1 <- numsignificant1 + 1
if (gqarr[mypoint-kp3+1,2] < 0.05) numsignificant5 <- numsignificant5 + 1
if (gqarr[mypoint-kp3+1,2] < 0.10) numsignificant10 <- numsignificant10 + 1
}
gqarr
}
bitmap(file='test0.png')
plot(x[,1], type='l', main='Actuals and Interpolation', ylab='value of Actuals and Interpolation (dots)', xlab='time or index')
points(x[,1]-mysum$resid)
grid()
dev.off()
bitmap(file='test1.png')
plot(mysum$resid, type='b', pch=19, main='Residuals', ylab='value of Residuals', xlab='time or index')
grid()
dev.off()
bitmap(file='test2.png')
hist(mysum$resid, main='Residual Histogram', xlab='values of Residuals')
grid()
dev.off()
bitmap(file='test3.png')
densityplot(~mysum$resid,col='black',main='Residual Density Plot', xlab='values of Residuals')
dev.off()
bitmap(file='test4.png')
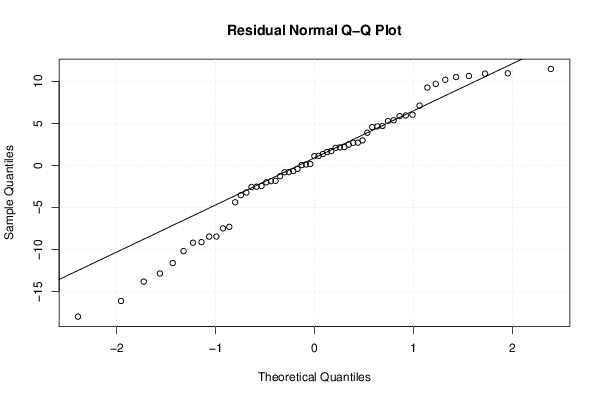
qqnorm(mysum$resid, main='Residual Normal Q-Q Plot')
qqline(mysum$resid)
grid()
dev.off()
(myerror <- as.ts(mysum$resid))
bitmap(file='test5.png')
dum <- cbind(lag(myerror,k=1),myerror)
dum
dum1 <- dum[2:length(myerror),]
dum1
z <- as.data.frame(dum1)
z
plot(z,main=paste('Residual Lag plot, lowess, and regression line'), ylab='values of Residuals', xlab='lagged values of Residuals')
lines(lowess(z))
abline(lm(z))
grid()
dev.off()
bitmap(file='test6.png')
acf(mysum$resid, lag.max=length(mysum$resid)/2, main='Residual Autocorrelation Function')
grid()
dev.off()
bitmap(file='test7.png')
pacf(mysum$resid, lag.max=length(mysum$resid)/2, main='Residual Partial Autocorrelation Function')
grid()
dev.off()
bitmap(file='test8.png')
opar <- par(mfrow = c(2,2), oma = c(0, 0, 1.1, 0))
plot(mylm, las = 1, sub='Residual Diagnostics')
par(opar)
dev.off()
if (n > n25) {
bitmap(file='test9.png')
plot(kp3:nmkm3,gqarr[,2], main='Goldfeld-Quandt test',ylab='2-sided p-value',xlab='breakpoint')
grid()
dev.off()
}
load(file='createtable')
a<-table.start()
a<-table.row.start(a)
a<-table.element(a, 'Multiple Linear Regression - Estimated Regression Equation', 1, TRUE)
a<-table.row.end(a)
myeq <- colnames(x)[1]
myeq <- paste(myeq, '[t] = ', sep='')
for (i in 1:k){
if (mysum$coefficients[i,1] > 0) myeq <- paste(myeq, '+', '')
myeq <- paste(myeq, mysum$coefficients[i,1], sep=' ')
if (rownames(mysum$coefficients)[i] != '(Intercept)') {
myeq <- paste(myeq, rownames(mysum$coefficients)[i], sep='')
if (rownames(mysum$coefficients)[i] != 't') myeq <- paste(myeq, '[t]', sep='')
}
}
myeq <- paste(myeq, ' + e[t]')
a<-table.row.start(a)
a<-table.element(a, myeq)
a<-table.row.end(a)
a<-table.end(a)
table.save(a,file='mytable1.tab')
a<-table.start()
a<-table.row.start(a)
a<-table.element(a,hyperlink('ols1.htm','Multiple Linear Regression - Ordinary Least Squares',''), 6, TRUE)
a<-table.row.end(a)
a<-table.row.start(a)
a<-table.element(a,'Variable',header=TRUE)
a<-table.element(a,'Parameter',header=TRUE)
a<-table.element(a,'S.D.',header=TRUE)
a<-table.element(a,'T-STAT
H0: parameter = 0',header=TRUE)
a<-table.element(a,'2-tail p-value',header=TRUE)
a<-table.element(a,'1-tail p-value',header=TRUE)
a<-table.row.end(a)
for (i in 1:k){
a<-table.row.start(a)
a<-table.element(a,rownames(mysum$coefficients)[i],header=TRUE)
a<-table.element(a,mysum$coefficients[i,1])
a<-table.element(a, round(mysum$coefficients[i,2],6))
a<-table.element(a, round(mysum$coefficients[i,3],4))
a<-table.element(a, round(mysum$coefficients[i,4],6))
a<-table.element(a, round(mysum$coefficients[i,4]/2,6))
a<-table.row.end(a)
}
a<-table.end(a)
table.save(a,file='mytable2.tab')
a<-table.start()
a<-table.row.start(a)
a<-table.element(a, 'Multiple Linear Regression - Regression Statistics', 2, TRUE)
a<-table.row.end(a)
a<-table.row.start(a)
a<-table.element(a, 'Multiple R',1,TRUE)
a<-table.element(a, sqrt(mysum$r.squared))
a<-table.row.end(a)
a<-table.row.start(a)
a<-table.element(a, 'R-squared',1,TRUE)
a<-table.element(a, mysum$r.squared)
a<-table.row.end(a)
a<-table.row.start(a)
a<-table.element(a, 'Adjusted R-squared',1,TRUE)
a<-table.element(a, mysum$adj.r.squared)
a<-table.row.end(a)
a<-table.row.start(a)
a<-table.element(a, 'F-TEST (value)',1,TRUE)
a<-table.element(a, mysum$fstatistic[1])
a<-table.row.end(a)
a<-table.row.start(a)
a<-table.element(a, 'F-TEST (DF numerator)',1,TRUE)
a<-table.element(a, mysum$fstatistic[2])
a<-table.row.end(a)
a<-table.row.start(a)
a<-table.element(a, 'F-TEST (DF denominator)',1,TRUE)
a<-table.element(a, mysum$fstatistic[3])
a<-table.row.end(a)
a<-table.row.start(a)
a<-table.element(a, 'p-value',1,TRUE)
a<-table.element(a, 1-pf(mysum$fstatistic[1],mysum$fstatistic[2],mysum$fstatistic[3]))
a<-table.row.end(a)
a<-table.row.start(a)
a<-table.element(a, 'Multiple Linear Regression - Residual Statistics', 2, TRUE)
a<-table.row.end(a)
a<-table.row.start(a)
a<-table.element(a, 'Residual Standard Deviation',1,TRUE)
a<-table.element(a, mysum$sigma)
a<-table.row.end(a)
a<-table.row.start(a)
a<-table.element(a, 'Sum Squared Residuals',1,TRUE)
a<-table.element(a, sum(myerror*myerror))
a<-table.row.end(a)
a<-table.end(a)
table.save(a,file='mytable3.tab')
a<-table.start()
a<-table.row.start(a)
a<-table.element(a, 'Multiple Linear Regression - Actuals, Interpolation, and Residuals', 4, TRUE)
a<-table.row.end(a)
a<-table.row.start(a)
a<-table.element(a, 'Time or Index', 1, TRUE)
a<-table.element(a, 'Actuals', 1, TRUE)
a<-table.element(a, 'Interpolation
Forecast', 1, TRUE)
a<-table.element(a, 'Residuals
Prediction Error', 1, TRUE)
a<-table.row.end(a)
for (i in 1:n) {
a<-table.row.start(a)
a<-table.element(a,i, 1, TRUE)
a<-table.element(a,x[i])
a<-table.element(a,x[i]-mysum$resid[i])
a<-table.element(a,mysum$resid[i])
a<-table.row.end(a)
}
a<-table.end(a)
table.save(a,file='mytable4.tab')
if (n > n25) {
a<-table.start()
a<-table.row.start(a)
a<-table.element(a,'Goldfeld-Quandt test for Heteroskedasticity',4,TRUE)
a<-table.row.end(a)
a<-table.row.start(a)
a<-table.element(a,'p-values',header=TRUE)
a<-table.element(a,'Alternative Hypothesis',3,header=TRUE)
a<-table.row.end(a)
a<-table.row.start(a)
a<-table.element(a,'breakpoint index',header=TRUE)
a<-table.element(a,'greater',header=TRUE)
a<-table.element(a,'2-sided',header=TRUE)
a<-table.element(a,'less',header=TRUE)
a<-table.row.end(a)
for (mypoint in kp3:nmkm3) {
a<-table.row.start(a)
a<-table.element(a,mypoint,header=TRUE)
a<-table.element(a,gqarr[mypoint-kp3+1,1])
a<-table.element(a,gqarr[mypoint-kp3+1,2])
a<-table.element(a,gqarr[mypoint-kp3+1,3])
a<-table.row.end(a)
}
a<-table.end(a)
table.save(a,file='mytable5.tab')
a<-table.start()
a<-table.row.start(a)
a<-table.element(a,'Meta Analysis of Goldfeld-Quandt test for Heteroskedasticity',4,TRUE)
a<-table.row.end(a)
a<-table.row.start(a)
a<-table.element(a,'Description',header=TRUE)
a<-table.element(a,'# significant tests',header=TRUE)
a<-table.element(a,'% significant tests',header=TRUE)
a<-table.element(a,'OK/NOK',header=TRUE)
a<-table.row.end(a)
a<-table.row.start(a)
a<-table.element(a,'1% type I error level',header=TRUE)
a<-table.element(a,numsignificant1)
a<-table.element(a,numsignificant1/numgqtests)
if (numsignificant1/numgqtests < 0.01) dum <- 'OK' else dum <- 'NOK'
a<-table.element(a,dum)
a<-table.row.end(a)
a<-table.row.start(a)
a<-table.element(a,'5% type I error level',header=TRUE)
a<-table.element(a,numsignificant5)
a<-table.element(a,numsignificant5/numgqtests)
if (numsignificant5/numgqtests < 0.05) dum <- 'OK' else dum <- 'NOK'
a<-table.element(a,dum)
a<-table.row.end(a)
a<-table.row.start(a)
a<-table.element(a,'10% type I error level',header=TRUE)
a<-table.element(a,numsignificant10)
a<-table.element(a,numsignificant10/numgqtests)
if (numsignificant10/numgqtests < 0.1) dum <- 'OK' else dum <- 'NOK'
a<-table.element(a,dum)
a<-table.row.end(a)
a<-table.end(a)
table.save(a,file='mytable6.tab')
}