| Tabulation of Results | ||
| Useful x Outcome | ||
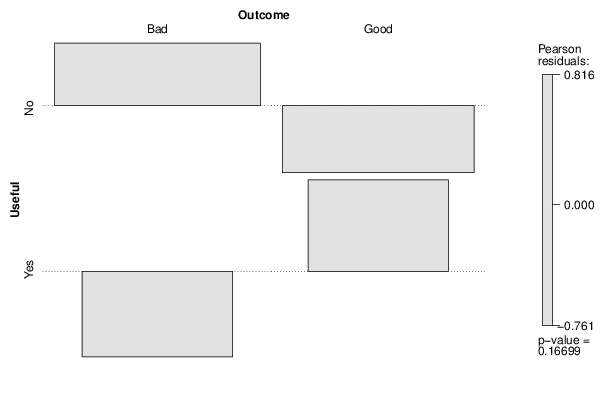
| Bad | Good | No | 33 | 23 | Yes | 13 | 17 |
| Tabulation of Expected Results | ||
| Useful x Outcome | ||
| Bad | Good | No | 29.95 | 26.05 | Yes | 16.05 | 13.95 |
| Statistical Results | |
| Pearson's Chi-squared test with Yates' continuity correction | |
| Pearson Chi Square Statistic | 1.33 |
| Degrees of Freedom | 1 |
| P value | 0.25 |