| Tabulation of Results | ||
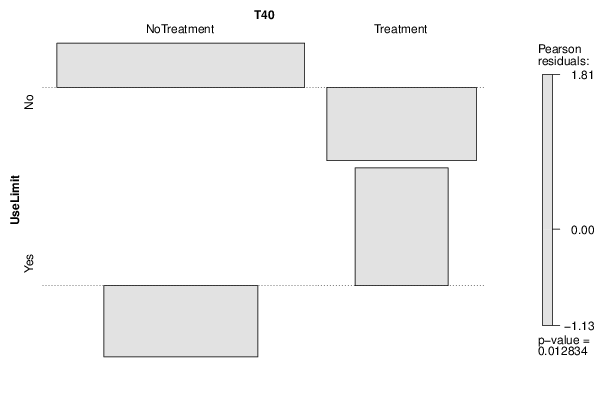
| UseLimit x T40 | ||
| NoTreatment | Treatment | No | 50 | 12 | Yes | 13 | 11 |
| Tabulation of Expected Results | ||
| UseLimit x T40 | ||
| NoTreatment | Treatment | No | 45.42 | 16.58 | Yes | 17.58 | 6.42 |
| Statistical Results | |
| Pearson's Chi-squared test with Yates' continuity correction | |
| Pearson Chi Square Statistic | 4.91 |
| Degrees of Freedom | 1 |
| P value | 0.03 |