| Tabulation of Results | ||
| UsedStat x Outcome | ||
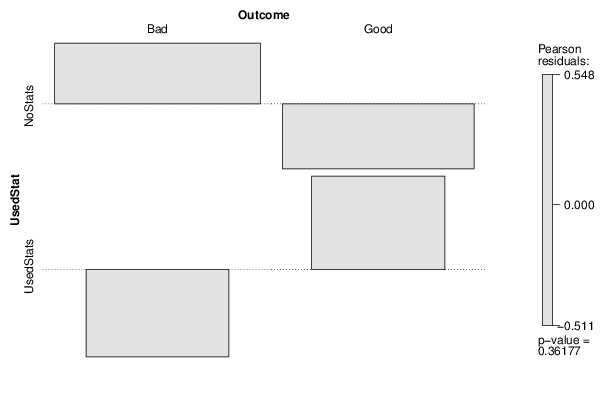
| Bad | Good | NoStats | 33 | 25 | UsedStats | 13 | 15 |
| Tabulation of Expected Results | ||
| UsedStat x Outcome | ||
| Bad | Good | NoStats | 31.02 | 26.98 | UsedStats | 14.98 | 13.02 |
| Statistical Results | |
| Pearson's Chi-squared test with Yates' continuity correction | |
| Pearson Chi Square Statistic | 0.46 |
| Degrees of Freedom | 1 |
| P value | 0.5 |