| Tabulation of Results | ||
| Used x Outcome | ||
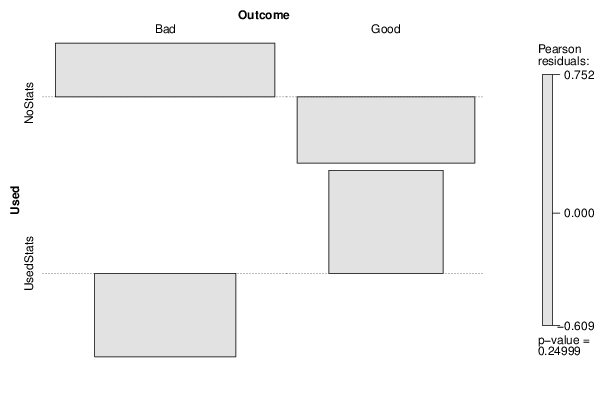
| Bad | Good | NoStats | 69 | 40 | UsedStats | 24 | 21 |
| Tabulation of Expected Results | ||
| Used x Outcome | ||
| Bad | Good | NoStats | 65.82 | 43.18 | UsedStats | 27.18 | 17.82 |
| Statistical Results | |
| Pearson's Chi-squared test with simulated p-value (based on 2000 replicates) | |
| Exact Pearson Chi Square Statistic | 1.32 |
| P value | 0.27 |