| Tabulation of Results | ||
| Geslacht x Rookgedrag | ||
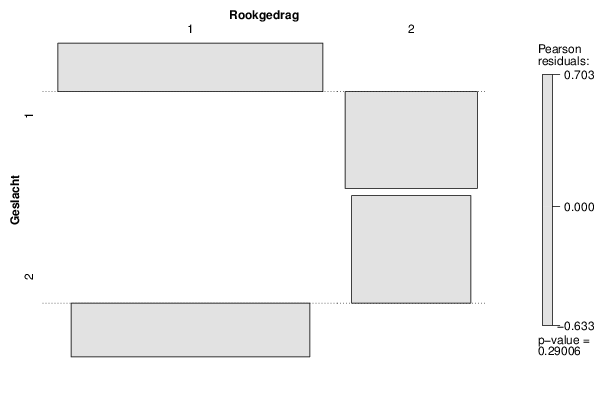
| 1 | 2 | 1 | 814 | 192 | 2 | 644 | 172 |
| Tabulation of Expected Results | ||
| Geslacht x Rookgedrag | ||
| 1 | 2 | 1 | 805.02 | 200.98 | 2 | 652.98 | 163.02 |
| Statistical Results | |
| Pearson's Chi-squared test with Yates' continuity correction | |
| Chi Square Statistic | 1 |
| Degrees of Freedom | 1 |
| P value | 0.32 |