| Multiple Linear Regression - Estimated Regression Equation |
| y[t] = + 9.27634432548118 -0.000887640787685606`"`[t] + 0.0966721877191875M1[t] -0.628484555299927M2[t] -0.289044108511377M3[t] -0.000573106461176947M4[t] -0.865455655625011M5[t] + 0.0750102261750044M6[t] -0.324514531265956M7[t] -0.138949495662991M8[t] -0.208395602658799M9[t] + 0.36598031550785M10[t] + 0.22818586786025M11[t] + 0.011071616426785t + e[t] |
| Multiple Linear Regression - Ordinary Least Squares | |||||
| Variable | Parameter | S.D. | T-STAT H0: parameter = 0 | 2-tail p-value | 1-tail p-value |
| (Intercept) | 9.27634432548118 | 0.148956 | 62.2758 | 0 | 0 |
| `"` | -0.000887640787685606 | 0.000123 | -7.2182 | 0 | 0 |
| M1 | 0.0966721877191875 | 0.163642 | 0.5908 | 0.556867 | 0.278433 |
| M2 | -0.628484555299927 | 0.163317 | -3.8483 | 0.000287 | 0.000144 |
| M3 | -0.289044108511377 | 0.163087 | -1.7723 | 0.081333 | 0.040666 |
| M4 | -0.000573106461176947 | 0.169939 | -0.0034 | 0.99732 | 0.49866 |
| M5 | -0.865455655625011 | 0.170246 | -5.0836 | 4e-06 | 2e-06 |
| M6 | 0.0750102261750044 | 0.169431 | 0.4427 | 0.659535 | 0.329768 |
| M7 | -0.324514531265956 | 0.170132 | -1.9074 | 0.061176 | 0.030588 |
| M8 | -0.138949495662991 | 0.169303 | -0.8207 | 0.415004 | 0.207502 |
| M9 | -0.208395602658799 | 0.169694 | -1.2281 | 0.224139 | 0.112069 |
| M10 | 0.36598031550785 | 0.169201 | 2.163 | 0.03447 | 0.017235 |
| M11 | 0.22818586786025 | 0.169316 | 1.3477 | 0.18274 | 0.09137 |
| t | 0.011071616426785 | 0.001573 | 7.04 | 0 | 0 |
| Multiple Linear Regression - Regression Statistics | |
| Multiple R | 0.87240276441248 |
| R-squared | 0.761086583354537 |
| Adjusted R-squared | 0.71017060931534 |
| F-TEST (value) | 14.9478940100139 |
| F-TEST (DF numerator) | 13 |
| F-TEST (DF denominator) | 61 |
| p-value | 2.25375273998907e-14 |
| Multiple Linear Regression - Residual Statistics | |
| Residual Standard Deviation | 0.293005401753725 |
| Sum Squared Residuals | 5.23698209286855 |
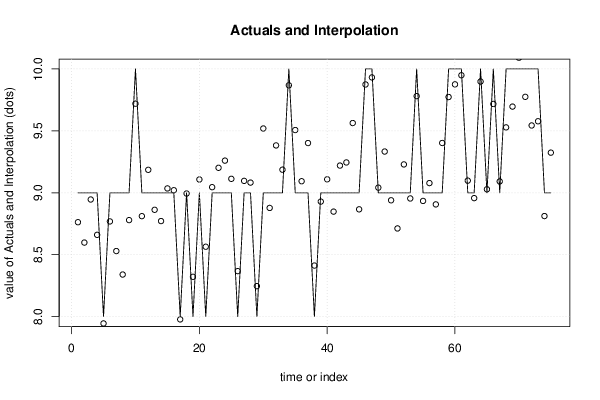
| Multiple Linear Regression - Actuals, Interpolation, and Residuals | |||
| Time or Index | Actuals | Interpolation Forecast | Residuals Prediction Error |
| 1 | 9 | 8.76273957824723 | 0.237260421752771 |
| 2 | 9 | 8.59810409923229 | 0.401895900767712 |
| 3 | 9 | 8.94595324008457 | 0.0540467599154335 |
| 4 | 9 | 8.66054057947674 | 0.339459420523262 |
| 5 | 8 | 7.94520160961864 | 0.0547983903813568 |
| 6 | 9 | 8.76891883441872 | 0.231081165581284 |
| 7 | 9 | 8.52958934573572 | 0.470410654264278 |
| 8 | 9 | 8.34010225512223 | 0.659897744877766 |
| 9 | 9 | 8.77969424644484 | 0.220305753555164 |
| 10 | 10 | 9.71931045532483 | 0.280689544675174 |
| 11 | 9 | 8.81146373094068 | 0.188536269059321 |
| 12 | 9 | 9.18551824410583 | -0.185518244105827 |
| 13 | 9 | 8.86275626622428 | 0.137243733775719 |
| 14 | 9 | 8.77179497258725 | 0.228205027412754 |
| 15 | 9 | 9.03531823860939 | -0.0353182386093922 |
| 16 | 9 | 9.02063601824567 | -0.0206360182456725 |
| 17 | 8 | 7.97775759773159 | 0.02224240226841 |
| 18 | 9 | 8.99409287345944 | 0.00590712654056085 |
| 19 | 8 | 8.32159468038587 | -0.32159468038587 |
| 20 | 9 | 9.10762481543886 | -0.107624815438862 |
| 21 | 8 | 8.5645984547935 | -0.564598454793498 |
| 22 | 9 | 9.04530437644003 | -0.0453043764400306 |
| 23 | 9 | 9.20173895649092 | -0.201738956490925 |
| 24 | 9 | 9.25979334924 | -0.259793349239997 |
| 25 | 9 | 9.1127842473202 | -0.112784247320201 |
| 26 | 8 | 8.36763169315888 | -0.367631693158875 |
| 27 | 9 | 9.09627873192828 | -0.0962787319282783 |
| 28 | 9 | 9.08248415235224 | -0.0824841523522444 |
| 29 | 8 | 8.24642603536891 | -0.246426035368908 |
| 30 | 9 | 9.5192894987379 | -0.519289498737897 |
| 31 | 9 | 8.87785873323332 | 0.122141266766676 |
| 32 | 9 | 9.38250673858998 | -0.382506738589979 |
| 33 | 9 | 9.18654792592969 | -0.186547925929688 |
| 34 | 10 | 9.86786066559317 | 0.132139334406833 |
| 35 | 9 | 9.50680066642335 | -0.506800666423352 |
| 36 | 9 | 9.09351780091137 | -0.0935178009113682 |
| 37 | 9 | 9.40186842307429 | -0.401868423074288 |
| 38 | 8 | 8.41261465229942 | -0.412614652299421 |
| 39 | 9 | 8.92911554281196 | 0.0708844571880363 |
| 40 | 9 | 9.10882665495139 | -0.108826654951392 |
| 41 | 9 | 8.84795976838833 | 0.152040231611672 |
| 42 | 9 | 9.21986783225643 | -0.219867832256427 |
| 43 | 9 | 9.24505529830375 | -0.245055298303744 |
| 44 | 9 | 9.56329873824642 | -0.563298738246422 |
| 45 | 9 | 8.86671052133145 | 0.133289478668551 |
| 46 | 10 | 9.87467507086323 | 0.125324929136769 |
| 47 | 10 | 9.93169388269334 | 0.0683061173066632 |
| 48 | 9 | 9.04174791419418 | -0.0417479141941824 |
| 49 | 9 | 9.33323336139108 | -0.333233361391075 |
| 50 | 9 | 8.93958655915325 | 0.0604134408467501 |
| 51 | 9 | 8.71224446958526 | 0.287755530414745 |
| 52 | 9 | 9.22925908104521 | -0.229259081045214 |
| 53 | 9 | 8.95418994187918 | 0.0458100581208199 |
| 54 | 10 | 9.78057008904231 | 0.21942991095769 |
| 55 | 9 | 8.93409430158236 | 0.0659056984176386 |
| 56 | 9 | 9.07836014713866 | -0.0783601471386608 |
| 57 | 9 | 8.90636763574588 | 0.0936323642541194 |
| 58 | 9 | 9.40216345078307 | -0.402163450783068 |
| 59 | 10 | 9.77340710145388 | 0.226592898546122 |
| 60 | 10 | 9.87584353358723 | 0.124156466412769 |
| 61 | 10 | 9.94896934701347 | 0.0510306529865346 |
| 62 | 9 | 9.09818753911755 | -0.0981875391175526 |
| 63 | 9 | 8.95694660595506 | 0.0430533940449381 |
| 64 | 10 | 9.89825351392874 | 0.10174648607126 |
| 65 | 9 | 9.02846504701335 | -0.0284650470133505 |
| 66 | 10 | 9.71726087208521 | 0.282739127914789 |
| 67 | 9 | 9.09180764075898 | -0.0918076407589785 |
| 68 | 10 | 9.52810730546384 | 0.471892694536158 |
| 69 | 10 | 9.69608121575465 | 0.303918784245351 |
| 70 | 10 | 10.0906859809957 | -0.0906859809956775 |
| 71 | 10 | 9.77489566199783 | 0.225104338002171 |
| 72 | 10 | 9.54357915796139 | 0.456420842038606 |
| 73 | 10 | 9.57764877672946 | 0.422351223270539 |
| 74 | 9 | 8.81208048445137 | 0.187919515548633 |
| 75 | 9 | 9.32414317102548 | -0.324143171025482 |
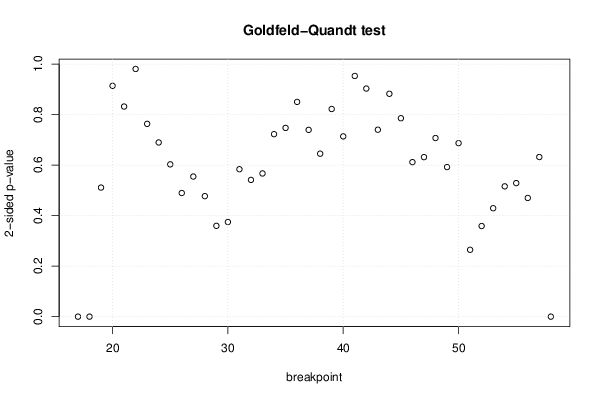
| Goldfeld-Quandt test for Heteroskedasticity | |||
| p-values | Alternative Hypothesis | ||
| breakpoint index | greater | 2-sided | less |
| 17 | 1.13138517830853e-42 | 2.26277035661706e-42 | 1 |
| 18 | 7.91271115424253e-58 | 1.58254223084851e-57 | 1 |
| 19 | 0.255530197530912 | 0.511060395061825 | 0.744469802469087 |
| 20 | 0.456945772186856 | 0.913891544373712 | 0.543054227813144 |
| 21 | 0.584029141458172 | 0.831941717083655 | 0.415970858541828 |
| 22 | 0.490339499506376 | 0.980678999012753 | 0.509660500493624 |
| 23 | 0.381649389764792 | 0.763298779529583 | 0.618350610235208 |
| 24 | 0.344825874072176 | 0.689651748144351 | 0.655174125927824 |
| 25 | 0.301458980903045 | 0.60291796180609 | 0.698541019096955 |
| 26 | 0.244760560293909 | 0.489521120587819 | 0.755239439706091 |
| 27 | 0.277346121895004 | 0.554692243790008 | 0.722653878104996 |
| 28 | 0.238515248345757 | 0.477030496691514 | 0.761484751654243 |
| 29 | 0.179815154917632 | 0.359630309835264 | 0.820184845082368 |
| 30 | 0.187307966596905 | 0.37461593319381 | 0.812692033403095 |
| 31 | 0.291854511078197 | 0.583709022156394 | 0.708145488921803 |
| 32 | 0.270685293872963 | 0.541370587745925 | 0.729314706127037 |
| 33 | 0.283452017179249 | 0.566904034358499 | 0.716547982820751 |
| 34 | 0.361236920811769 | 0.722473841623538 | 0.638763079188231 |
| 35 | 0.37362729964156 | 0.74725459928312 | 0.62637270035844 |
| 36 | 0.425087735690044 | 0.850175471380088 | 0.574912264309956 |
| 37 | 0.369762405761589 | 0.739524811523178 | 0.630237594238411 |
| 38 | 0.322612174907373 | 0.645224349814745 | 0.677387825092628 |
| 39 | 0.411029800665846 | 0.822059601331693 | 0.588970199334154 |
| 40 | 0.356842462586619 | 0.713684925173237 | 0.643157537413381 |
| 41 | 0.476431794409563 | 0.952863588819126 | 0.523568205590437 |
| 42 | 0.451552600671283 | 0.903105201342566 | 0.548447399328717 |
| 43 | 0.370047906089081 | 0.740095812178162 | 0.629952093910919 |
| 44 | 0.558835351201628 | 0.882329297596744 | 0.441164648798372 |
| 45 | 0.60721595839297 | 0.78556808321406 | 0.39278404160703 |
| 46 | 0.69413814722072 | 0.611723705558559 | 0.30586185277928 |
| 47 | 0.684217924830334 | 0.631564150339333 | 0.315782075169666 |
| 48 | 0.646399986666487 | 0.707200026667025 | 0.353600013333513 |
| 49 | 0.703879154575066 | 0.592241690849869 | 0.296120845424934 |
| 50 | 0.656565123412195 | 0.686869753175609 | 0.343434876587805 |
| 51 | 0.867641016161913 | 0.264717967676175 | 0.132358983838087 |
| 52 | 0.820622085115002 | 0.358755829769996 | 0.179377914884998 |
| 53 | 0.785390779900375 | 0.42921844019925 | 0.214609220099625 |
| 54 | 0.742046518167012 | 0.515906963665976 | 0.257953481832988 |
| 55 | 0.735656692625308 | 0.528686614749384 | 0.264343307374692 |
| 56 | 0.765073495154132 | 0.469853009691735 | 0.234926504845867 |
| 57 | 0.684033336653644 | 0.631933326692712 | 0.315966663346356 |
| 58 | 1 | 2.81918491218433e-43 | 1.40959245609216e-43 |
| Meta Analysis of Goldfeld-Quandt test for Heteroskedasticity | |||
| Description | # significant tests | % significant tests | OK/NOK |
| 1% type I error level | 3 | 0.0714285714285714 | NOK |
| 5% type I error level | 3 | 0.0714285714285714 | NOK |
| 10% type I error level | 3 | 0.0714285714285714 | OK |