| Tabulation of Results | ||
| T40 x CorrectAN | ||
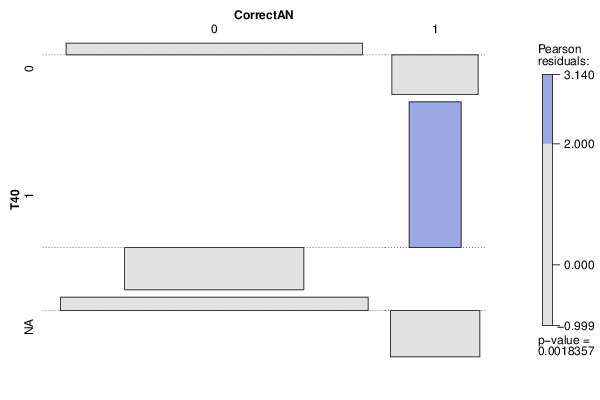
| 0 | 1 | 0 | 60 | 3 | 1 | 17 | 6 | NA | 65 | 3 |
| Tabulation of Expected Results | ||
| T40 x CorrectAN | ||
| 0 | 1 | 0 | 58.09 | 4.91 | 1 | 21.21 | 1.79 | NA | 62.7 | 5.3 |
| Statistical Results | |
| Pearson's Chi-squared test | |
| Pearson Chi Square Statistic | 12.6 |
| Degrees of Freedom | 2 |
| P value | 0 |