Free Statistics

of Irreproducible Research!

Author's title

Author*The author of this computation has been verified*
R Software Modulerwasp_twosampletests_mean.wasp
Title produced by softwarePaired and Unpaired Two Samples Tests about the Mean
Date of computationSat, 15 Dec 2012 07:13:10 -0500
Cite this page as followsStatistical Computations at FreeStatistics.org, Office for Research Development and Education, URL https://freestatistics.org/blog/index.php?v=date/2012/Dec/15/t1355573627iourebdr0heqo2e.htm/, Retrieved Tue, 30 Apr 2024 16:41:37 +0000
Statistical Computations at FreeStatistics.org, Office for Research Development and Education, URL https://freestatistics.org/blog/index.php?pk=199863, Retrieved Tue, 30 Apr 2024 16:41:37 +0000
QR Codes:

Original text written by user:
IsPrivate?No (this computation is public)
User-defined keywords
Estimated Impact96
Family? (F = Feedback message, R = changed R code, M = changed R Module, P = changed Parameters, D = changed Data)
-       [Paired and Unpaired Two Samples Tests about the Mean] [] [2012-12-15 12:13:10] [cd784a0623f47f402dddaa62da6ddd9f] [Current]
- R P     [Paired and Unpaired Two Samples Tests about the Mean] [] [2012-12-15 12:15:39] [804e94d57d6cf1d4fdbaf6716baf8784]
- RMPD    [Chi-Squared Test, McNemar Test, and Fisher Exact Test] [] [2012-12-15 12:31:04] [804e94d57d6cf1d4fdbaf6716baf8784]
- RMPD    [Chi-Squared Test, McNemar Test, and Fisher Exact Test] [] [2012-12-15 12:42:22] [804e94d57d6cf1d4fdbaf6716baf8784]
Feedback Forum

Post a new message
Dataseries X:
35.323	186.577
35.478	244.642
4.39	248.18
41.667	253.568
22.173	171.239
28.021	413.945
18.109	216.89
13.962	227.901
40.174	259.813
16.065	148.438
18.145	240.984
18.439	206.248
10.603	108.873
34.811	267.945
69.064	314.171
51.202	235.115
14.786	203.023
33.01	365.415
81.101	350.881
89.232	263.287
21.223	738.743
15.173	959.072
241.66	483.618
26.848	212.996
8.752	177.326
60.535	352.594
60.535	352.594
26.052	217.305
49.218	236.184
30.669	215.701
18.673	228.352
86	485.61
10.632	252.492
35.802	342.515
33.974	196.916
36.972	365.292
4.928	316.663
53.976	313.509
15.467	188.12
35.723	184.061
40.424	362.959
9.706	170.16
26.532	167.476
23.843	211.717
18.062	276.453
35.681	182.094
68.125	266.904
23.937	235.312
31.479	329.414
66.659	258.103
250.234	952.5
49.469	247.109
42.951	498.715
43.402	313.298
24.112	420.188
56.95	231.144
17.313	227.828
25.658	204.363
48.172	216.531
13.891	207.167
32.048	232.4
19.797	203.109
31.317	221.044
20.966	254.592
22.708	108.947
26.81	229.416
52.004	476.36
32.354	221.91
27.128	158.944
26.529	295.732
28.392	187.972
57.393	283.753
194.731	705.361
9.415	178.681
91.076	232.612
57.751	245.169
8.236	186.03
20.407	181.116
13.681	228.462
79.659	491.847
53.48	506.455
6.906	182.828
50.202	263.649
37.877	253.703
85.903	480.932
35.351	209.88
283.801	655.852
5.974	223.398
3.441	103.115
51.987	255.657
13.22	184.646
1.455	372.92
18.187	385.655
21.29	256.445
5.686	204.85
4.944	197.38
32.789	245.302
50.494	301.705
35.162	501.463
38.095	278.714
19.172	205.904
24.5	177.14
20.573	139.739
42.042	366.46
302.912	435.511
25.027	239.885
16.488	178.717
32.36	340.015
6.193	236.932
37.7	221.145
6.343	263.271
23.025	222.799
48.578	317.99
21.564	149.589
33.697	221.966
10.831	201.537
19.172	266.885
21.075	185.203
33.189	347.532
60.5	395.593
33.686	238.202
40.838	254.697
13.491	157.584
106.637	807.284
35.897	249.29
7.314	189.194
49.094	267.829
14.667	173.148
54.179	267.618
145.846	283.28
18.56	209.449
23.525	135.104
21.804	285.009
26.301	178.495
41.33	256.848
10.5	301.828
13.338	158.387
60.31	355.961
34.256	364.076
48.267	233.199
41.559	257.619
32.45	208.544
10.951	212.487
22.561	251.035
57.095	276.782
19.105	198.305
13.151	301.018
27.426	369.76
15.355	162.752
13.82	199.946
47.21	403.388
110.349	364.141
34.985	202.375
27.257	319.465
23.556	185.546
50.108	243.559
18.158	220.912
87.357	193.698
18.187	372.928
28.33	163.749
13.474	217.551
26.244	232.519


Summary of computational transaction
Raw Inputview raw input (R code)
Raw Outputview raw output of R engine
Computing time3 seconds
R Server'Gertrude Mary Cox' @ cox.wessa.net

\begin{tabular}{lllllllll}
\hline
Summary of computational transaction \tabularnewline
Raw Input & view raw input (R code)  \tabularnewline
Raw Output & view raw output of R engine  \tabularnewline
Computing time & 3 seconds \tabularnewline
R Server & 'Gertrude Mary Cox' @ cox.wessa.net \tabularnewline
\hline
\end{tabular}
%Source: https://freestatistics.org/blog/index.php?pk=199863&T=0

[TABLE]
[ROW][C]Summary of computational transaction[/C][/ROW]
[ROW][C]Raw Input[/C][C]view raw input (R code) [/C][/ROW]
[ROW][C]Raw Output[/C][C]view raw output of R engine [/C][/ROW]
[ROW][C]Computing time[/C][C]3 seconds[/C][/ROW]
[ROW][C]R Server[/C][C]'Gertrude Mary Cox' @ cox.wessa.net[/C][/ROW]
[/TABLE]
Source: https://freestatistics.org/blog/index.php?pk=199863&T=0

Globally Unique Identifier (entire table): ba.freestatistics.org/blog/index.php?pk=199863&T=0

As an alternative you can also use a QR Code:  

The GUIDs for individual cells are displayed in the table below:

Summary of computational transaction
Raw Inputview raw input (R code)
Raw Outputview raw output of R engine
Computing time3 seconds
R Server'Gertrude Mary Cox' @ cox.wessa.net


Two Sample t-test (unpaired)
Mean of Sample 1278.719833333333
Mean of Sample 240.1066790123457
t-stat0.768188587102531
df322
p-value0.442938146658162
H0 value230
Alternativetwo.sided
CI Level0.95
CI[216.554556491491,260.671752150485]
F-test to compare two variances
F-stat9.01260809844631
df161
p-value0
H0 value1
Alternativetwo.sided
CI Level0.95
CI[6.61007025674234,12.2883875028904]

\begin{tabular}{lllllllll}
\hline
Two Sample t-test (unpaired) \tabularnewline
Mean of Sample 1 & 278.719833333333 \tabularnewline
Mean of Sample 2 & 40.1066790123457 \tabularnewline
t-stat & 0.768188587102531 \tabularnewline
df & 322 \tabularnewline
p-value & 0.442938146658162 \tabularnewline
H0 value & 230 \tabularnewline
Alternative & two.sided \tabularnewline
CI Level & 0.95 \tabularnewline
CI & [216.554556491491,260.671752150485] \tabularnewline
F-test to compare two variances \tabularnewline
F-stat & 9.01260809844631 \tabularnewline
df & 161 \tabularnewline
p-value & 0 \tabularnewline
H0 value & 1 \tabularnewline
Alternative & two.sided \tabularnewline
CI Level & 0.95 \tabularnewline
CI & [6.61007025674234,12.2883875028904] \tabularnewline
\hline
\end{tabular}
%Source: https://freestatistics.org/blog/index.php?pk=199863&T=1

[TABLE]
[ROW][C]Two Sample t-test (unpaired)[/C][/ROW]
[ROW][C]Mean of Sample 1[/C][C]278.719833333333[/C][/ROW]
[ROW][C]Mean of Sample 2[/C][C]40.1066790123457[/C][/ROW]
[ROW][C]t-stat[/C][C]0.768188587102531[/C][/ROW]
[ROW][C]df[/C][C]322[/C][/ROW]
[ROW][C]p-value[/C][C]0.442938146658162[/C][/ROW]
[ROW][C]H0 value[/C][C]230[/C][/ROW]
[ROW][C]Alternative[/C][C]two.sided[/C][/ROW]
[ROW][C]CI Level[/C][C]0.95[/C][/ROW]
[ROW][C]CI[/C][C][216.554556491491,260.671752150485][/C][/ROW]
[ROW][C]F-test to compare two variances[/C][/ROW]
[ROW][C]F-stat[/C][C]9.01260809844631[/C][/ROW]
[ROW][C]df[/C][C]161[/C][/ROW]
[ROW][C]p-value[/C][C]0[/C][/ROW]
[ROW][C]H0 value[/C][C]1[/C][/ROW]
[ROW][C]Alternative[/C][C]two.sided[/C][/ROW]
[ROW][C]CI Level[/C][C]0.95[/C][/ROW]
[ROW][C]CI[/C][C][6.61007025674234,12.2883875028904][/C][/ROW]
[/TABLE]
Source: https://freestatistics.org/blog/index.php?pk=199863&T=1

Globally Unique Identifier (entire table): ba.freestatistics.org/blog/index.php?pk=199863&T=1

As an alternative you can also use a QR Code:  

The GUIDs for individual cells are displayed in the table below:

Two Sample t-test (unpaired)
Mean of Sample 1278.719833333333
Mean of Sample 240.1066790123457
t-stat0.768188587102531
df322
p-value0.442938146658162
H0 value230
Alternativetwo.sided
CI Level0.95
CI[216.554556491491,260.671752150485]
F-test to compare two variances
F-stat9.01260809844631
df161
p-value0
H0 value1
Alternativetwo.sided
CI Level0.95
CI[6.61007025674234,12.2883875028904]


Welch Two Sample t-test (unpaired)
Mean of Sample 1278.719833333333
Mean of Sample 240.1066790123457
t-stat0.768188587102531
df196.293226205772
p-value0.443298313963857
H0 value230
Alternativetwo.sided
CI Level0.95
CI[216.50113737708,260.725171264895]

\begin{tabular}{lllllllll}
\hline
Welch Two Sample t-test (unpaired) \tabularnewline
Mean of Sample 1 & 278.719833333333 \tabularnewline
Mean of Sample 2 & 40.1066790123457 \tabularnewline
t-stat & 0.768188587102531 \tabularnewline
df & 196.293226205772 \tabularnewline
p-value & 0.443298313963857 \tabularnewline
H0 value & 230 \tabularnewline
Alternative & two.sided \tabularnewline
CI Level & 0.95 \tabularnewline
CI & [216.50113737708,260.725171264895] \tabularnewline
\hline
\end{tabular}
%Source: https://freestatistics.org/blog/index.php?pk=199863&T=2

[TABLE]
[ROW][C]Welch Two Sample t-test (unpaired)[/C][/ROW]
[ROW][C]Mean of Sample 1[/C][C]278.719833333333[/C][/ROW]
[ROW][C]Mean of Sample 2[/C][C]40.1066790123457[/C][/ROW]
[ROW][C]t-stat[/C][C]0.768188587102531[/C][/ROW]
[ROW][C]df[/C][C]196.293226205772[/C][/ROW]
[ROW][C]p-value[/C][C]0.443298313963857[/C][/ROW]
[ROW][C]H0 value[/C][C]230[/C][/ROW]
[ROW][C]Alternative[/C][C]two.sided[/C][/ROW]
[ROW][C]CI Level[/C][C]0.95[/C][/ROW]
[ROW][C]CI[/C][C][216.50113737708,260.725171264895][/C][/ROW]
[/TABLE]
Source: https://freestatistics.org/blog/index.php?pk=199863&T=2

Globally Unique Identifier (entire table): ba.freestatistics.org/blog/index.php?pk=199863&T=2

As an alternative you can also use a QR Code:  

The GUIDs for individual cells are displayed in the table below:

Welch Two Sample t-test (unpaired)
Mean of Sample 1278.719833333333
Mean of Sample 240.1066790123457
t-stat0.768188587102531
df196.293226205772
p-value0.443298313963857
H0 value230
Alternativetwo.sided
CI Level0.95
CI[216.50113737708,260.725171264895]


Wicoxon rank sum test with continuity correction (unpaired)
W10077
p-value0.000304797989094166
H0 value230
Alternativetwo.sided
Kolmogorov-Smirnov Test to compare Distributions of two Samples
KS Statistic0.950617283950617
p-value0
Kolmogorov-Smirnov Test to compare Distributional Shape of two Samples
KS Statistic0.5
p-value0

\begin{tabular}{lllllllll}
\hline
Wicoxon rank sum test with continuity correction (unpaired) \tabularnewline
W & 10077 \tabularnewline
p-value & 0.000304797989094166 \tabularnewline
H0 value & 230 \tabularnewline
Alternative & two.sided \tabularnewline
Kolmogorov-Smirnov Test to compare Distributions of two Samples \tabularnewline
KS Statistic & 0.950617283950617 \tabularnewline
p-value & 0 \tabularnewline
Kolmogorov-Smirnov Test to compare Distributional Shape of two Samples \tabularnewline
KS Statistic & 0.5 \tabularnewline
p-value & 0 \tabularnewline
\hline
\end{tabular}
%Source: https://freestatistics.org/blog/index.php?pk=199863&T=3

[TABLE]
[ROW][C]Wicoxon rank sum test with continuity correction (unpaired)[/C][/ROW]
[ROW][C]W[/C][C]10077[/C][/ROW]
[ROW][C]p-value[/C][C]0.000304797989094166[/C][/ROW]
[ROW][C]H0 value[/C][C]230[/C][/ROW]
[ROW][C]Alternative[/C][C]two.sided[/C][/ROW]
[ROW][C]Kolmogorov-Smirnov Test to compare Distributions of two Samples[/C][/ROW]
[ROW][C]KS Statistic[/C][C]0.950617283950617[/C][/ROW]
[ROW][C]p-value[/C][C]0[/C][/ROW]
[ROW][C]Kolmogorov-Smirnov Test to compare Distributional Shape of two Samples[/C][/ROW]
[ROW][C]KS Statistic[/C][C]0.5[/C][/ROW]
[ROW][C]p-value[/C][C]0[/C][/ROW]
[/TABLE]
Source: https://freestatistics.org/blog/index.php?pk=199863&T=3

Globally Unique Identifier (entire table): ba.freestatistics.org/blog/index.php?pk=199863&T=3

As an alternative you can also use a QR Code:  

The GUIDs for individual cells are displayed in the table below:

Wicoxon rank sum test with continuity correction (unpaired)
W10077
p-value0.000304797989094166
H0 value230
Alternativetwo.sided
Kolmogorov-Smirnov Test to compare Distributions of two Samples
KS Statistic0.950617283950617
p-value0
Kolmogorov-Smirnov Test to compare Distributional Shape of two Samples
KS Statistic0.5
p-value0


Parameters (Session):
par1 = 2 ; par2 = 1 ; par3 = 0.95 ; par4 = two.sided ; par5 = unpaired ; par6 = 230 ;
Parameters (R input):
par1 = 2 ; par2 = 1 ; par3 = 0.95 ; par4 = two.sided ; par5 = unpaired ; par6 = 230 ;
R code (references can be found in the software module):
par1 <- as.numeric(par1) #column number of first sample
par2 <- as.numeric(par2) #column number of second sample
par3 <- as.numeric(par3) #confidence (= 1 - alpha)
if (par5 == 'unpaired') paired <- FALSE else paired <- TRUE
par6 <- as.numeric(par6) #H0
z <- t(y)
if (par1 == par2) stop('Please, select two different column numbers')
if (par1 < 1) stop('Please, select a column number greater than zero for the first sample')
if (par2 < 1) stop('Please, select a column number greater than zero for the second sample')
if (par1 > length(z[1,])) stop('The column number for the first sample should be smaller')
if (par2 > length(z[1,])) stop('The column number for the second sample should be smaller')
if (par3 <= 0) stop('The confidence level should be larger than zero')
if (par3 >= 1) stop('The confidence level should be smaller than zero')
(r.t <- t.test(z[,par1],z[,par2],var.equal=TRUE,alternative=par4,paired=paired,mu=par6,conf.level=par3))
(v.t <- var.test(z[,par1],z[,par2],conf.level=par3))
(r.w <- t.test(z[,par1],z[,par2],var.equal=FALSE,alternative=par4,paired=paired,mu=par6,conf.level=par3))
(w.t <- wilcox.test(z[,par1],z[,par2],alternative=par4,paired=paired,mu=par6,conf.level=par3))
(ks.t <- ks.test(z[,par1],z[,par2],alternative=par4))
m1 <- mean(z[,par1],na.rm=T)
m2 <- mean(z[,par2],na.rm=T)
mdiff <- m1 - m2
newsam1 <- z[!is.na(z[,par1]),par1]
newsam2 <- z[,par2]+mdiff
newsam2 <- newsam2[!is.na(newsam2)]
(ks1.t <- ks.test(newsam1,newsam2,alternative=par4))
mydf <- data.frame(cbind(z[,par1],z[,par2]))
colnames(mydf) <- c('Variable 1','Variable 2')
bitmap(file='test1.png')
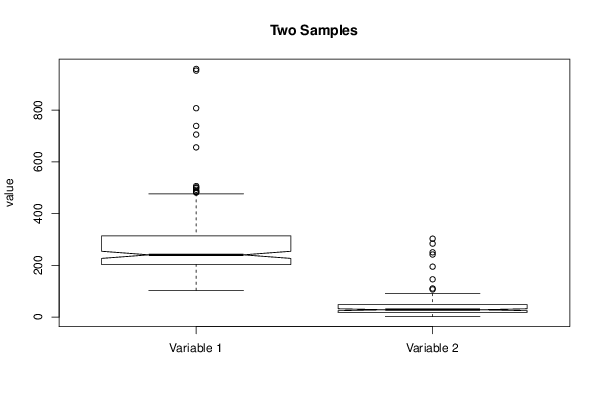
boxplot(mydf, notch=TRUE, ylab='value',main=main)
dev.off()
bitmap(file='test2.png')
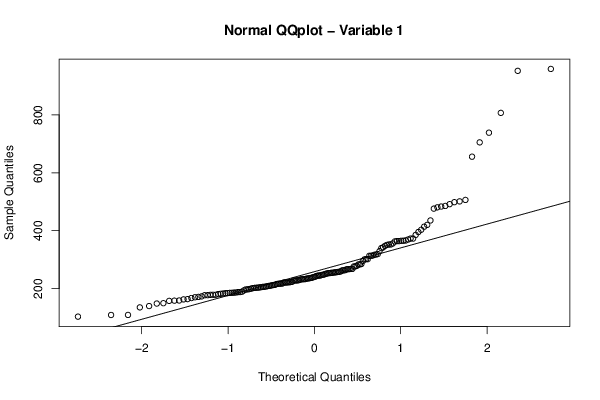
qqnorm(z[,par1],main='Normal QQplot - Variable 1')
qqline(z[,par1])
dev.off()
bitmap(file='test3.png')
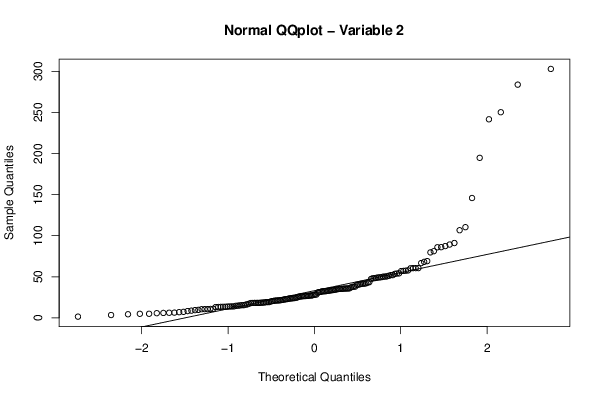
qqnorm(z[,par2],main='Normal QQplot - Variable 2')
qqline(z[,par2])
dev.off()
load(file='createtable')
a<-table.start()
a<-table.row.start(a)
a<-table.element(a,paste('Two Sample t-test (',par5,')',sep=''),2,TRUE)
a<-table.row.end(a)
if(!paired){
a<-table.row.start(a)
a<-table.element(a,'Mean of Sample 1',header=TRUE)
a<-table.element(a,r.t$estimate[[1]])
a<-table.row.end(a)
a<-table.row.start(a)
a<-table.element(a,'Mean of Sample 2',header=TRUE)
a<-table.element(a,r.t$estimate[[2]])
a<-table.row.end(a)
} else {
a<-table.row.start(a)
a<-table.element(a,'Difference: Mean1 - Mean2',header=TRUE)
a<-table.element(a,r.t$estimate)
a<-table.row.end(a)
}
a<-table.row.start(a)
a<-table.element(a,'t-stat',header=TRUE)
a<-table.element(a,r.t$statistic[[1]])
a<-table.row.end(a)
a<-table.row.start(a)
a<-table.element(a,'df',header=TRUE)
a<-table.element(a,r.t$parameter[[1]])
a<-table.row.end(a)
a<-table.row.start(a)
a<-table.element(a,'p-value',header=TRUE)
a<-table.element(a,r.t$p.value)
a<-table.row.end(a)
a<-table.row.start(a)
a<-table.element(a,'H0 value',header=TRUE)
a<-table.element(a,r.t$null.value[[1]])
a<-table.row.end(a)
a<-table.row.start(a)
a<-table.element(a,'Alternative',header=TRUE)
a<-table.element(a,r.t$alternative)
a<-table.row.end(a)
a<-table.row.start(a)
a<-table.element(a,'CI Level',header=TRUE)
a<-table.element(a,attr(r.t$conf.int,'conf.level'))
a<-table.row.end(a)
a<-table.row.start(a)
a<-table.element(a,'CI',header=TRUE)
a<-table.element(a,paste('[',r.t$conf.int[1],',',r.t$conf.int[2],']',sep=''))
a<-table.row.end(a)
a<-table.row.start(a)
a<-table.element(a,'F-test to compare two variances',2,TRUE)
a<-table.row.end(a)
a<-table.row.start(a)
a<-table.element(a,'F-stat',header=TRUE)
a<-table.element(a,v.t$statistic[[1]])
a<-table.row.end(a)
a<-table.row.start(a)
a<-table.element(a,'df',header=TRUE)
a<-table.element(a,v.t$parameter[[1]])
a<-table.row.end(a)
a<-table.row.start(a)
a<-table.element(a,'p-value',header=TRUE)
a<-table.element(a,v.t$p.value)
a<-table.row.end(a)
a<-table.row.start(a)
a<-table.element(a,'H0 value',header=TRUE)
a<-table.element(a,v.t$null.value[[1]])
a<-table.row.end(a)
a<-table.row.start(a)
a<-table.element(a,'Alternative',header=TRUE)
a<-table.element(a,v.t$alternative)
a<-table.row.end(a)
a<-table.row.start(a)
a<-table.element(a,'CI Level',header=TRUE)
a<-table.element(a,attr(v.t$conf.int,'conf.level'))
a<-table.row.end(a)
a<-table.row.start(a)
a<-table.element(a,'CI',header=TRUE)
a<-table.element(a,paste('[',v.t$conf.int[1],',',v.t$conf.int[2],']',sep=''))
a<-table.row.end(a)
a<-table.end(a)
table.save(a,file='mytable.tab')
a<-table.start()
a<-table.row.start(a)
a<-table.element(a,paste('Welch Two Sample t-test (',par5,')',sep=''),2,TRUE)
a<-table.row.end(a)
if(!paired){
a<-table.row.start(a)
a<-table.element(a,'Mean of Sample 1',header=TRUE)
a<-table.element(a,r.w$estimate[[1]])
a<-table.row.end(a)
a<-table.row.start(a)
a<-table.element(a,'Mean of Sample 2',header=TRUE)
a<-table.element(a,r.w$estimate[[2]])
a<-table.row.end(a)
} else {
a<-table.row.start(a)
a<-table.element(a,'Difference: Mean1 - Mean2',header=TRUE)
a<-table.element(a,r.w$estimate)
a<-table.row.end(a)
}
a<-table.row.start(a)
a<-table.element(a,'t-stat',header=TRUE)
a<-table.element(a,r.w$statistic[[1]])
a<-table.row.end(a)
a<-table.row.start(a)
a<-table.element(a,'df',header=TRUE)
a<-table.element(a,r.w$parameter[[1]])
a<-table.row.end(a)
a<-table.row.start(a)
a<-table.element(a,'p-value',header=TRUE)
a<-table.element(a,r.w$p.value)
a<-table.row.end(a)
a<-table.row.start(a)
a<-table.element(a,'H0 value',header=TRUE)
a<-table.element(a,r.w$null.value[[1]])
a<-table.row.end(a)
a<-table.row.start(a)
a<-table.element(a,'Alternative',header=TRUE)
a<-table.element(a,r.w$alternative)
a<-table.row.end(a)
a<-table.row.start(a)
a<-table.element(a,'CI Level',header=TRUE)
a<-table.element(a,attr(r.w$conf.int,'conf.level'))
a<-table.row.end(a)
a<-table.row.start(a)
a<-table.element(a,'CI',header=TRUE)
a<-table.element(a,paste('[',r.w$conf.int[1],',',r.w$conf.int[2],']',sep=''))
a<-table.row.end(a)
a<-table.end(a)
table.save(a,file='mytable1.tab')
a<-table.start()
a<-table.row.start(a)
a<-table.element(a,paste('Wicoxon rank sum test with continuity correction (',par5,')',sep=''),2,TRUE)
a<-table.row.end(a)
a<-table.row.start(a)
a<-table.element(a,'W',header=TRUE)
a<-table.element(a,w.t$statistic[[1]])
a<-table.row.end(a)
a<-table.row.start(a)
a<-table.element(a,'p-value',header=TRUE)
a<-table.element(a,w.t$p.value)
a<-table.row.end(a)
a<-table.row.start(a)
a<-table.element(a,'H0 value',header=TRUE)
a<-table.element(a,w.t$null.value[[1]])
a<-table.row.end(a)
a<-table.row.start(a)
a<-table.element(a,'Alternative',header=TRUE)
a<-table.element(a,w.t$alternative)
a<-table.row.end(a)
a<-table.row.start(a)
a<-table.element(a,'Kolmogorov-Smirnov Test to compare Distributions of two Samples',2,TRUE)
a<-table.row.end(a)
a<-table.row.start(a)
a<-table.element(a,'KS Statistic',header=TRUE)
a<-table.element(a,ks.t$statistic[[1]])
a<-table.row.end(a)
a<-table.row.start(a)
a<-table.element(a,'p-value',header=TRUE)
a<-table.element(a,ks.t$p.value)
a<-table.row.end(a)
a<-table.row.start(a)
a<-table.element(a,'Kolmogorov-Smirnov Test to compare Distributional Shape of two Samples',2,TRUE)
a<-table.row.end(a)
a<-table.row.start(a)
a<-table.element(a,'KS Statistic',header=TRUE)
a<-table.element(a,ks1.t$statistic[[1]])
a<-table.row.end(a)
a<-table.row.start(a)
a<-table.element(a,'p-value',header=TRUE)
a<-table.element(a,ks1.t$p.value)
a<-table.row.end(a)
a<-table.end(a)
table.save(a,file='mytable2.tab')