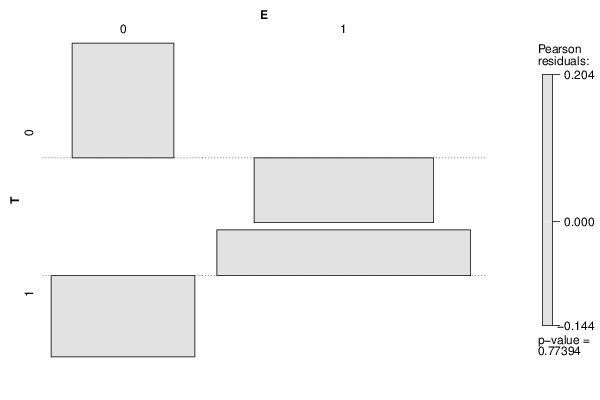
| Tabulation of Results | ||
| T x E | ||
| 0 | 1 | 0 | 3 | 8 | 1 | 5 | 17 |
| Tabulation of Expected Results | ||
| T x E | ||
| 0 | 1 | 0 | 2.67 | 8.33 | 1 | 5.33 | 16.67 |
| Statistical Results | |
| Pearson's Chi-squared test with simulated p-value (based on 2000 replicates) | |
| Chi Square Statistic | 0.08 |
| P value | 1 |