Free Statistics

of Irreproducible Research!

Author's title

Author*Unverified author*
R Software Modulerwasp_autocorrelation.wasp
Title produced by software(Partial) Autocorrelation Function
Date of computationTue, 14 Aug 2012 17:32:08 -0400
Cite this page as followsStatistical Computations at FreeStatistics.org, Office for Research Development and Education, URL https://freestatistics.org/blog/index.php?v=date/2012/Aug/14/t1344980053s7o6j05ocvb5uvy.htm/, Retrieved Wed, 01 May 2024 23:44:03 +0000
Statistical Computations at FreeStatistics.org, Office for Research Development and Education, URL https://freestatistics.org/blog/index.php?pk=169342, Retrieved Wed, 01 May 2024 23:44:03 +0000
QR Codes:

Original text written by user:
IsPrivate?No (this computation is public)
User-defined keywordsSam De Maeyer
Estimated Impact113
Family? (F = Feedback message, R = changed R code, M = changed R Module, P = changed Parameters, D = changed Data)
-       [(Partial) Autocorrelation Function] [Tijdreeks 1 autoc...] [2012-08-14 21:32:08] [df2e1cb801e9c7e9e5c4a0dfd693d83a] [Current]
Feedback Forum

Post a new message
Dataseries X:
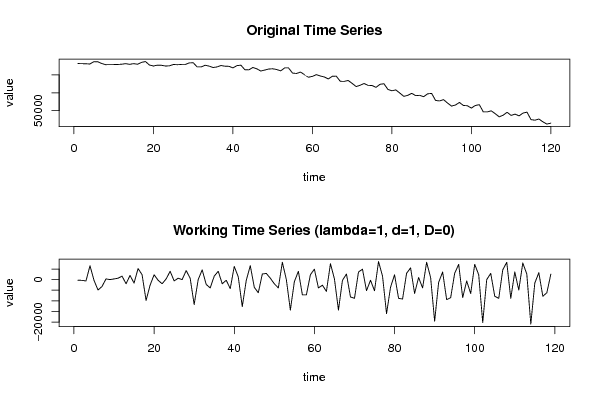
181896
181580
181234
180598
187123
186807
181896
178638
178954
178954
179269
179936
181580
179616
181580
179936
185158
187469
177656
175025
177305
176989
175025
175345
179269
178638
179269
179269
183545
184176
172398
172398
176989
174709
170785
172398
176327
174363
174047
169803
176007
177305
164545
164229
170785
167176
160967
163598
166509
167176
165212
161287
169456
169456
155078
154101
158025
150838
143616
145932
150838
146910
144283
138710
146247
146563
132190
131839
134470
126301
117465
121043
125950
120728
120412
115154
123670
125319
109266
105688
107968
99132
89981
92928
98470
91946
92928
89004
97172
98150
78524
77221
80799
71333
62817
65764
72950
64462
63799
57244
64462
66742
46448
46448
49391
41542
32706
37297
45466
36631
40244
35333
43186
45813
24853
23240
26502
18649
12444
15040


Summary of computational transaction
Raw Inputview raw input (R code)
Raw Outputview raw output of R engine
Computing time2 seconds
R Server'Herman Ole Andreas Wold' @ wold.wessa.net

\begin{tabular}{lllllllll}
\hline
Summary of computational transaction \tabularnewline
Raw Input & view raw input (R code)  \tabularnewline
Raw Output & view raw output of R engine  \tabularnewline
Computing time & 2 seconds \tabularnewline
R Server & 'Herman Ole Andreas Wold' @ wold.wessa.net \tabularnewline
\hline
\end{tabular}
%Source: https://freestatistics.org/blog/index.php?pk=169342&T=0

[TABLE]
[ROW][C]Summary of computational transaction[/C][/ROW]
[ROW][C]Raw Input[/C][C]view raw input (R code) [/C][/ROW]
[ROW][C]Raw Output[/C][C]view raw output of R engine [/C][/ROW]
[ROW][C]Computing time[/C][C]2 seconds[/C][/ROW]
[ROW][C]R Server[/C][C]'Herman Ole Andreas Wold' @ wold.wessa.net[/C][/ROW]
[/TABLE]
Source: https://freestatistics.org/blog/index.php?pk=169342&T=0

Globally Unique Identifier (entire table): ba.freestatistics.org/blog/index.php?pk=169342&T=0

As an alternative you can also use a QR Code:  

The GUIDs for individual cells are displayed in the table below:

Summary of computational transaction
Raw Inputview raw input (R code)
Raw Outputview raw output of R engine
Computing time2 seconds
R Server'Herman Ole Andreas Wold' @ wold.wessa.net


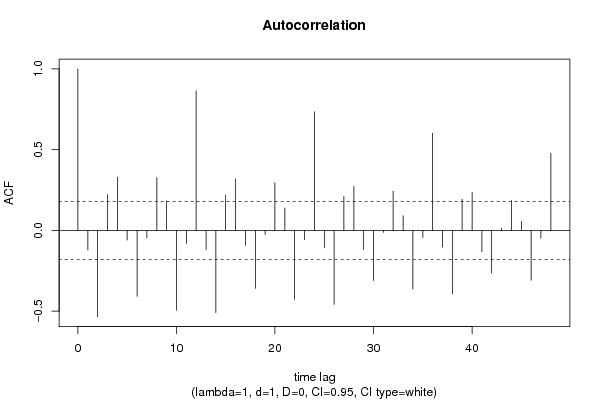
Autocorrelation Function
Time lag kACF(k)T-STATP-value
1-0.121016-1.32010.094662
2-0.533959-5.82480
30.2214042.41520.008623
40.3294363.59370.000238
5-0.059851-0.65290.25754
6-0.407549-4.44581e-05
7-0.044903-0.48980.312577
80.3269513.56660.000261
90.1820131.98550.024693
10-0.493564-5.38410
11-0.081087-0.88460.189091
120.8653689.440
13-0.117799-1.2850.100637
14-0.508773-5.55010
150.2181922.38020.009446
160.3189013.47880.000352
17-0.09248-1.00880.15755
18-0.357704-3.90217.9e-05
19-0.025564-0.27890.390415
200.2948043.21590.000837
210.1383311.5090.066973
22-0.426618-4.65394e-06
23-0.05716-0.62350.26706
240.7342798.010
25-0.107004-1.16730.122716
26-0.457901-4.99511e-06
270.2104612.29590.011717
280.2720462.96770.001814
29-0.118671-1.29460.098991
30-0.309988-3.38160.000488
31-0.010913-0.1190.452718
320.2431282.65220.004543
330.0913180.99620.160595
34-0.363132-3.96136.4e-05
35-0.044317-0.48340.314834
360.6010986.55720
37-0.103224-1.1260.131207
38-0.392944-4.28651.9e-05
390.1932182.10780.018575
400.2346292.55950.005867
41-0.131194-1.43120.077503
42-0.263987-2.87980.00236
430.012650.1380.445237
440.1851432.01970.022832
450.0559230.61010.271495
46-0.308088-3.36080.000523
47-0.046566-0.5080.306207
480.4775895.20990

\begin{tabular}{lllllllll}
\hline
Autocorrelation Function \tabularnewline
Time lag k & ACF(k) & T-STAT & P-value \tabularnewline
1 & -0.121016 & -1.3201 & 0.094662 \tabularnewline
2 & -0.533959 & -5.8248 & 0 \tabularnewline
3 & 0.221404 & 2.4152 & 0.008623 \tabularnewline
4 & 0.329436 & 3.5937 & 0.000238 \tabularnewline
5 & -0.059851 & -0.6529 & 0.25754 \tabularnewline
6 & -0.407549 & -4.4458 & 1e-05 \tabularnewline
7 & -0.044903 & -0.4898 & 0.312577 \tabularnewline
8 & 0.326951 & 3.5666 & 0.000261 \tabularnewline
9 & 0.182013 & 1.9855 & 0.024693 \tabularnewline
10 & -0.493564 & -5.3841 & 0 \tabularnewline
11 & -0.081087 & -0.8846 & 0.189091 \tabularnewline
12 & 0.865368 & 9.44 & 0 \tabularnewline
13 & -0.117799 & -1.285 & 0.100637 \tabularnewline
14 & -0.508773 & -5.5501 & 0 \tabularnewline
15 & 0.218192 & 2.3802 & 0.009446 \tabularnewline
16 & 0.318901 & 3.4788 & 0.000352 \tabularnewline
17 & -0.09248 & -1.0088 & 0.15755 \tabularnewline
18 & -0.357704 & -3.9021 & 7.9e-05 \tabularnewline
19 & -0.025564 & -0.2789 & 0.390415 \tabularnewline
20 & 0.294804 & 3.2159 & 0.000837 \tabularnewline
21 & 0.138331 & 1.509 & 0.066973 \tabularnewline
22 & -0.426618 & -4.6539 & 4e-06 \tabularnewline
23 & -0.05716 & -0.6235 & 0.26706 \tabularnewline
24 & 0.734279 & 8.01 & 0 \tabularnewline
25 & -0.107004 & -1.1673 & 0.122716 \tabularnewline
26 & -0.457901 & -4.9951 & 1e-06 \tabularnewline
27 & 0.210461 & 2.2959 & 0.011717 \tabularnewline
28 & 0.272046 & 2.9677 & 0.001814 \tabularnewline
29 & -0.118671 & -1.2946 & 0.098991 \tabularnewline
30 & -0.309988 & -3.3816 & 0.000488 \tabularnewline
31 & -0.010913 & -0.119 & 0.452718 \tabularnewline
32 & 0.243128 & 2.6522 & 0.004543 \tabularnewline
33 & 0.091318 & 0.9962 & 0.160595 \tabularnewline
34 & -0.363132 & -3.9613 & 6.4e-05 \tabularnewline
35 & -0.044317 & -0.4834 & 0.314834 \tabularnewline
36 & 0.601098 & 6.5572 & 0 \tabularnewline
37 & -0.103224 & -1.126 & 0.131207 \tabularnewline
38 & -0.392944 & -4.2865 & 1.9e-05 \tabularnewline
39 & 0.193218 & 2.1078 & 0.018575 \tabularnewline
40 & 0.234629 & 2.5595 & 0.005867 \tabularnewline
41 & -0.131194 & -1.4312 & 0.077503 \tabularnewline
42 & -0.263987 & -2.8798 & 0.00236 \tabularnewline
43 & 0.01265 & 0.138 & 0.445237 \tabularnewline
44 & 0.185143 & 2.0197 & 0.022832 \tabularnewline
45 & 0.055923 & 0.6101 & 0.271495 \tabularnewline
46 & -0.308088 & -3.3608 & 0.000523 \tabularnewline
47 & -0.046566 & -0.508 & 0.306207 \tabularnewline
48 & 0.477589 & 5.2099 & 0 \tabularnewline
\hline
\end{tabular}
%Source: https://freestatistics.org/blog/index.php?pk=169342&T=1

[TABLE]
[ROW][C]Autocorrelation Function[/C][/ROW]
[ROW][C]Time lag k[/C][C]ACF(k)[/C][C]T-STAT[/C][C]P-value[/C][/ROW]
[ROW][C]1[/C][C]-0.121016[/C][C]-1.3201[/C][C]0.094662[/C][/ROW]
[ROW][C]2[/C][C]-0.533959[/C][C]-5.8248[/C][C]0[/C][/ROW]
[ROW][C]3[/C][C]0.221404[/C][C]2.4152[/C][C]0.008623[/C][/ROW]
[ROW][C]4[/C][C]0.329436[/C][C]3.5937[/C][C]0.000238[/C][/ROW]
[ROW][C]5[/C][C]-0.059851[/C][C]-0.6529[/C][C]0.25754[/C][/ROW]
[ROW][C]6[/C][C]-0.407549[/C][C]-4.4458[/C][C]1e-05[/C][/ROW]
[ROW][C]7[/C][C]-0.044903[/C][C]-0.4898[/C][C]0.312577[/C][/ROW]
[ROW][C]8[/C][C]0.326951[/C][C]3.5666[/C][C]0.000261[/C][/ROW]
[ROW][C]9[/C][C]0.182013[/C][C]1.9855[/C][C]0.024693[/C][/ROW]
[ROW][C]10[/C][C]-0.493564[/C][C]-5.3841[/C][C]0[/C][/ROW]
[ROW][C]11[/C][C]-0.081087[/C][C]-0.8846[/C][C]0.189091[/C][/ROW]
[ROW][C]12[/C][C]0.865368[/C][C]9.44[/C][C]0[/C][/ROW]
[ROW][C]13[/C][C]-0.117799[/C][C]-1.285[/C][C]0.100637[/C][/ROW]
[ROW][C]14[/C][C]-0.508773[/C][C]-5.5501[/C][C]0[/C][/ROW]
[ROW][C]15[/C][C]0.218192[/C][C]2.3802[/C][C]0.009446[/C][/ROW]
[ROW][C]16[/C][C]0.318901[/C][C]3.4788[/C][C]0.000352[/C][/ROW]
[ROW][C]17[/C][C]-0.09248[/C][C]-1.0088[/C][C]0.15755[/C][/ROW]
[ROW][C]18[/C][C]-0.357704[/C][C]-3.9021[/C][C]7.9e-05[/C][/ROW]
[ROW][C]19[/C][C]-0.025564[/C][C]-0.2789[/C][C]0.390415[/C][/ROW]
[ROW][C]20[/C][C]0.294804[/C][C]3.2159[/C][C]0.000837[/C][/ROW]
[ROW][C]21[/C][C]0.138331[/C][C]1.509[/C][C]0.066973[/C][/ROW]
[ROW][C]22[/C][C]-0.426618[/C][C]-4.6539[/C][C]4e-06[/C][/ROW]
[ROW][C]23[/C][C]-0.05716[/C][C]-0.6235[/C][C]0.26706[/C][/ROW]
[ROW][C]24[/C][C]0.734279[/C][C]8.01[/C][C]0[/C][/ROW]
[ROW][C]25[/C][C]-0.107004[/C][C]-1.1673[/C][C]0.122716[/C][/ROW]
[ROW][C]26[/C][C]-0.457901[/C][C]-4.9951[/C][C]1e-06[/C][/ROW]
[ROW][C]27[/C][C]0.210461[/C][C]2.2959[/C][C]0.011717[/C][/ROW]
[ROW][C]28[/C][C]0.272046[/C][C]2.9677[/C][C]0.001814[/C][/ROW]
[ROW][C]29[/C][C]-0.118671[/C][C]-1.2946[/C][C]0.098991[/C][/ROW]
[ROW][C]30[/C][C]-0.309988[/C][C]-3.3816[/C][C]0.000488[/C][/ROW]
[ROW][C]31[/C][C]-0.010913[/C][C]-0.119[/C][C]0.452718[/C][/ROW]
[ROW][C]32[/C][C]0.243128[/C][C]2.6522[/C][C]0.004543[/C][/ROW]
[ROW][C]33[/C][C]0.091318[/C][C]0.9962[/C][C]0.160595[/C][/ROW]
[ROW][C]34[/C][C]-0.363132[/C][C]-3.9613[/C][C]6.4e-05[/C][/ROW]
[ROW][C]35[/C][C]-0.044317[/C][C]-0.4834[/C][C]0.314834[/C][/ROW]
[ROW][C]36[/C][C]0.601098[/C][C]6.5572[/C][C]0[/C][/ROW]
[ROW][C]37[/C][C]-0.103224[/C][C]-1.126[/C][C]0.131207[/C][/ROW]
[ROW][C]38[/C][C]-0.392944[/C][C]-4.2865[/C][C]1.9e-05[/C][/ROW]
[ROW][C]39[/C][C]0.193218[/C][C]2.1078[/C][C]0.018575[/C][/ROW]
[ROW][C]40[/C][C]0.234629[/C][C]2.5595[/C][C]0.005867[/C][/ROW]
[ROW][C]41[/C][C]-0.131194[/C][C]-1.4312[/C][C]0.077503[/C][/ROW]
[ROW][C]42[/C][C]-0.263987[/C][C]-2.8798[/C][C]0.00236[/C][/ROW]
[ROW][C]43[/C][C]0.01265[/C][C]0.138[/C][C]0.445237[/C][/ROW]
[ROW][C]44[/C][C]0.185143[/C][C]2.0197[/C][C]0.022832[/C][/ROW]
[ROW][C]45[/C][C]0.055923[/C][C]0.6101[/C][C]0.271495[/C][/ROW]
[ROW][C]46[/C][C]-0.308088[/C][C]-3.3608[/C][C]0.000523[/C][/ROW]
[ROW][C]47[/C][C]-0.046566[/C][C]-0.508[/C][C]0.306207[/C][/ROW]
[ROW][C]48[/C][C]0.477589[/C][C]5.2099[/C][C]0[/C][/ROW]
[/TABLE]
Source: https://freestatistics.org/blog/index.php?pk=169342&T=1

Globally Unique Identifier (entire table): ba.freestatistics.org/blog/index.php?pk=169342&T=1

As an alternative you can also use a QR Code:  

The GUIDs for individual cells are displayed in the table below:

Autocorrelation Function
Time lag kACF(k)T-STATP-value
1-0.121016-1.32010.094662
2-0.533959-5.82480
30.2214042.41520.008623
40.3294363.59370.000238
5-0.059851-0.65290.25754
6-0.407549-4.44581e-05
7-0.044903-0.48980.312577
80.3269513.56660.000261
90.1820131.98550.024693
10-0.493564-5.38410
11-0.081087-0.88460.189091
120.8653689.440
13-0.117799-1.2850.100637
14-0.508773-5.55010
150.2181922.38020.009446
160.3189013.47880.000352
17-0.09248-1.00880.15755
18-0.357704-3.90217.9e-05
19-0.025564-0.27890.390415
200.2948043.21590.000837
210.1383311.5090.066973
22-0.426618-4.65394e-06
23-0.05716-0.62350.26706
240.7342798.010
25-0.107004-1.16730.122716
26-0.457901-4.99511e-06
270.2104612.29590.011717
280.2720462.96770.001814
29-0.118671-1.29460.098991
30-0.309988-3.38160.000488
31-0.010913-0.1190.452718
320.2431282.65220.004543
330.0913180.99620.160595
34-0.363132-3.96136.4e-05
35-0.044317-0.48340.314834
360.6010986.55720
37-0.103224-1.1260.131207
38-0.392944-4.28651.9e-05
390.1932182.10780.018575
400.2346292.55950.005867
41-0.131194-1.43120.077503
42-0.263987-2.87980.00236
430.012650.1380.445237
440.1851432.01970.022832
450.0559230.61010.271495
46-0.308088-3.36080.000523
47-0.046566-0.5080.306207
480.4775895.20990


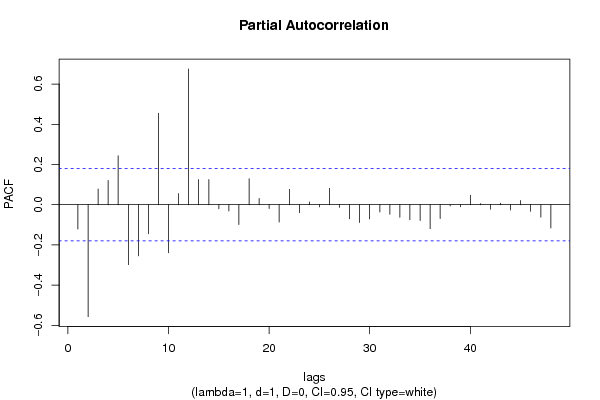
Partial Autocorrelation Function
Time lag kPACF(k)T-STATP-value
1-0.121016-1.32010.094662
2-0.556758-6.07350
30.0785880.85730.196502
40.1207461.31720.095154
50.2437832.65940.004454
6-0.298245-3.25350.000742
7-0.254366-2.77480.003208
8-0.14481-1.57970.058416
90.4549844.96331e-06
10-0.239026-2.60750.005145
110.0551630.60180.274239
120.6751977.36550
130.1246561.35980.088227
140.1249421.3630.087735
15-0.020249-0.22090.412778
16-0.031331-0.34180.36656
17-0.098475-1.07420.142446
180.1290311.40760.080933
190.0307960.33590.368754
20-0.018812-0.20520.418879
21-0.085834-0.93630.175498
220.0762720.8320.203529
23-0.040456-0.44130.329892
240.0132360.14440.442718
25-0.010788-0.11770.45326
260.0818950.89340.186732
27-0.013513-0.14740.441528
28-0.069596-0.75920.224615
29-0.088954-0.97040.166913
30-0.070499-0.7690.221694
31-0.036656-0.39990.344985
32-0.047784-0.52130.301577
33-0.062444-0.68120.24854
34-0.074455-0.81220.209147
35-0.078766-0.85920.19597
36-0.119162-1.29990.098074
37-0.068938-0.7520.226762
38-0.006518-0.07110.471717
39-0.010539-0.1150.454331
400.0471840.51470.303852
410.0052550.05730.477191
42-0.021904-0.23890.405781
430.0069980.07630.46964
44-0.026516-0.28930.386444
450.0211490.23070.408969
46-0.032704-0.35680.360951
47-0.061997-0.67630.25008
48-0.115876-1.26410.104341

\begin{tabular}{lllllllll}
\hline
Partial Autocorrelation Function \tabularnewline
Time lag k & PACF(k) & T-STAT & P-value \tabularnewline
1 & -0.121016 & -1.3201 & 0.094662 \tabularnewline
2 & -0.556758 & -6.0735 & 0 \tabularnewline
3 & 0.078588 & 0.8573 & 0.196502 \tabularnewline
4 & 0.120746 & 1.3172 & 0.095154 \tabularnewline
5 & 0.243783 & 2.6594 & 0.004454 \tabularnewline
6 & -0.298245 & -3.2535 & 0.000742 \tabularnewline
7 & -0.254366 & -2.7748 & 0.003208 \tabularnewline
8 & -0.14481 & -1.5797 & 0.058416 \tabularnewline
9 & 0.454984 & 4.9633 & 1e-06 \tabularnewline
10 & -0.239026 & -2.6075 & 0.005145 \tabularnewline
11 & 0.055163 & 0.6018 & 0.274239 \tabularnewline
12 & 0.675197 & 7.3655 & 0 \tabularnewline
13 & 0.124656 & 1.3598 & 0.088227 \tabularnewline
14 & 0.124942 & 1.363 & 0.087735 \tabularnewline
15 & -0.020249 & -0.2209 & 0.412778 \tabularnewline
16 & -0.031331 & -0.3418 & 0.36656 \tabularnewline
17 & -0.098475 & -1.0742 & 0.142446 \tabularnewline
18 & 0.129031 & 1.4076 & 0.080933 \tabularnewline
19 & 0.030796 & 0.3359 & 0.368754 \tabularnewline
20 & -0.018812 & -0.2052 & 0.418879 \tabularnewline
21 & -0.085834 & -0.9363 & 0.175498 \tabularnewline
22 & 0.076272 & 0.832 & 0.203529 \tabularnewline
23 & -0.040456 & -0.4413 & 0.329892 \tabularnewline
24 & 0.013236 & 0.1444 & 0.442718 \tabularnewline
25 & -0.010788 & -0.1177 & 0.45326 \tabularnewline
26 & 0.081895 & 0.8934 & 0.186732 \tabularnewline
27 & -0.013513 & -0.1474 & 0.441528 \tabularnewline
28 & -0.069596 & -0.7592 & 0.224615 \tabularnewline
29 & -0.088954 & -0.9704 & 0.166913 \tabularnewline
30 & -0.070499 & -0.769 & 0.221694 \tabularnewline
31 & -0.036656 & -0.3999 & 0.344985 \tabularnewline
32 & -0.047784 & -0.5213 & 0.301577 \tabularnewline
33 & -0.062444 & -0.6812 & 0.24854 \tabularnewline
34 & -0.074455 & -0.8122 & 0.209147 \tabularnewline
35 & -0.078766 & -0.8592 & 0.19597 \tabularnewline
36 & -0.119162 & -1.2999 & 0.098074 \tabularnewline
37 & -0.068938 & -0.752 & 0.226762 \tabularnewline
38 & -0.006518 & -0.0711 & 0.471717 \tabularnewline
39 & -0.010539 & -0.115 & 0.454331 \tabularnewline
40 & 0.047184 & 0.5147 & 0.303852 \tabularnewline
41 & 0.005255 & 0.0573 & 0.477191 \tabularnewline
42 & -0.021904 & -0.2389 & 0.405781 \tabularnewline
43 & 0.006998 & 0.0763 & 0.46964 \tabularnewline
44 & -0.026516 & -0.2893 & 0.386444 \tabularnewline
45 & 0.021149 & 0.2307 & 0.408969 \tabularnewline
46 & -0.032704 & -0.3568 & 0.360951 \tabularnewline
47 & -0.061997 & -0.6763 & 0.25008 \tabularnewline
48 & -0.115876 & -1.2641 & 0.104341 \tabularnewline
\hline
\end{tabular}
%Source: https://freestatistics.org/blog/index.php?pk=169342&T=2

[TABLE]
[ROW][C]Partial Autocorrelation Function[/C][/ROW]
[ROW][C]Time lag k[/C][C]PACF(k)[/C][C]T-STAT[/C][C]P-value[/C][/ROW]
[ROW][C]1[/C][C]-0.121016[/C][C]-1.3201[/C][C]0.094662[/C][/ROW]
[ROW][C]2[/C][C]-0.556758[/C][C]-6.0735[/C][C]0[/C][/ROW]
[ROW][C]3[/C][C]0.078588[/C][C]0.8573[/C][C]0.196502[/C][/ROW]
[ROW][C]4[/C][C]0.120746[/C][C]1.3172[/C][C]0.095154[/C][/ROW]
[ROW][C]5[/C][C]0.243783[/C][C]2.6594[/C][C]0.004454[/C][/ROW]
[ROW][C]6[/C][C]-0.298245[/C][C]-3.2535[/C][C]0.000742[/C][/ROW]
[ROW][C]7[/C][C]-0.254366[/C][C]-2.7748[/C][C]0.003208[/C][/ROW]
[ROW][C]8[/C][C]-0.14481[/C][C]-1.5797[/C][C]0.058416[/C][/ROW]
[ROW][C]9[/C][C]0.454984[/C][C]4.9633[/C][C]1e-06[/C][/ROW]
[ROW][C]10[/C][C]-0.239026[/C][C]-2.6075[/C][C]0.005145[/C][/ROW]
[ROW][C]11[/C][C]0.055163[/C][C]0.6018[/C][C]0.274239[/C][/ROW]
[ROW][C]12[/C][C]0.675197[/C][C]7.3655[/C][C]0[/C][/ROW]
[ROW][C]13[/C][C]0.124656[/C][C]1.3598[/C][C]0.088227[/C][/ROW]
[ROW][C]14[/C][C]0.124942[/C][C]1.363[/C][C]0.087735[/C][/ROW]
[ROW][C]15[/C][C]-0.020249[/C][C]-0.2209[/C][C]0.412778[/C][/ROW]
[ROW][C]16[/C][C]-0.031331[/C][C]-0.3418[/C][C]0.36656[/C][/ROW]
[ROW][C]17[/C][C]-0.098475[/C][C]-1.0742[/C][C]0.142446[/C][/ROW]
[ROW][C]18[/C][C]0.129031[/C][C]1.4076[/C][C]0.080933[/C][/ROW]
[ROW][C]19[/C][C]0.030796[/C][C]0.3359[/C][C]0.368754[/C][/ROW]
[ROW][C]20[/C][C]-0.018812[/C][C]-0.2052[/C][C]0.418879[/C][/ROW]
[ROW][C]21[/C][C]-0.085834[/C][C]-0.9363[/C][C]0.175498[/C][/ROW]
[ROW][C]22[/C][C]0.076272[/C][C]0.832[/C][C]0.203529[/C][/ROW]
[ROW][C]23[/C][C]-0.040456[/C][C]-0.4413[/C][C]0.329892[/C][/ROW]
[ROW][C]24[/C][C]0.013236[/C][C]0.1444[/C][C]0.442718[/C][/ROW]
[ROW][C]25[/C][C]-0.010788[/C][C]-0.1177[/C][C]0.45326[/C][/ROW]
[ROW][C]26[/C][C]0.081895[/C][C]0.8934[/C][C]0.186732[/C][/ROW]
[ROW][C]27[/C][C]-0.013513[/C][C]-0.1474[/C][C]0.441528[/C][/ROW]
[ROW][C]28[/C][C]-0.069596[/C][C]-0.7592[/C][C]0.224615[/C][/ROW]
[ROW][C]29[/C][C]-0.088954[/C][C]-0.9704[/C][C]0.166913[/C][/ROW]
[ROW][C]30[/C][C]-0.070499[/C][C]-0.769[/C][C]0.221694[/C][/ROW]
[ROW][C]31[/C][C]-0.036656[/C][C]-0.3999[/C][C]0.344985[/C][/ROW]
[ROW][C]32[/C][C]-0.047784[/C][C]-0.5213[/C][C]0.301577[/C][/ROW]
[ROW][C]33[/C][C]-0.062444[/C][C]-0.6812[/C][C]0.24854[/C][/ROW]
[ROW][C]34[/C][C]-0.074455[/C][C]-0.8122[/C][C]0.209147[/C][/ROW]
[ROW][C]35[/C][C]-0.078766[/C][C]-0.8592[/C][C]0.19597[/C][/ROW]
[ROW][C]36[/C][C]-0.119162[/C][C]-1.2999[/C][C]0.098074[/C][/ROW]
[ROW][C]37[/C][C]-0.068938[/C][C]-0.752[/C][C]0.226762[/C][/ROW]
[ROW][C]38[/C][C]-0.006518[/C][C]-0.0711[/C][C]0.471717[/C][/ROW]
[ROW][C]39[/C][C]-0.010539[/C][C]-0.115[/C][C]0.454331[/C][/ROW]
[ROW][C]40[/C][C]0.047184[/C][C]0.5147[/C][C]0.303852[/C][/ROW]
[ROW][C]41[/C][C]0.005255[/C][C]0.0573[/C][C]0.477191[/C][/ROW]
[ROW][C]42[/C][C]-0.021904[/C][C]-0.2389[/C][C]0.405781[/C][/ROW]
[ROW][C]43[/C][C]0.006998[/C][C]0.0763[/C][C]0.46964[/C][/ROW]
[ROW][C]44[/C][C]-0.026516[/C][C]-0.2893[/C][C]0.386444[/C][/ROW]
[ROW][C]45[/C][C]0.021149[/C][C]0.2307[/C][C]0.408969[/C][/ROW]
[ROW][C]46[/C][C]-0.032704[/C][C]-0.3568[/C][C]0.360951[/C][/ROW]
[ROW][C]47[/C][C]-0.061997[/C][C]-0.6763[/C][C]0.25008[/C][/ROW]
[ROW][C]48[/C][C]-0.115876[/C][C]-1.2641[/C][C]0.104341[/C][/ROW]
[/TABLE]
Source: https://freestatistics.org/blog/index.php?pk=169342&T=2

Globally Unique Identifier (entire table): ba.freestatistics.org/blog/index.php?pk=169342&T=2

As an alternative you can also use a QR Code:  

The GUIDs for individual cells are displayed in the table below:

Partial Autocorrelation Function
Time lag kPACF(k)T-STATP-value
1-0.121016-1.32010.094662
2-0.556758-6.07350
30.0785880.85730.196502
40.1207461.31720.095154
50.2437832.65940.004454
6-0.298245-3.25350.000742
7-0.254366-2.77480.003208
8-0.14481-1.57970.058416
90.4549844.96331e-06
10-0.239026-2.60750.005145
110.0551630.60180.274239
120.6751977.36550
130.1246561.35980.088227
140.1249421.3630.087735
15-0.020249-0.22090.412778
16-0.031331-0.34180.36656
17-0.098475-1.07420.142446
180.1290311.40760.080933
190.0307960.33590.368754
20-0.018812-0.20520.418879
21-0.085834-0.93630.175498
220.0762720.8320.203529
23-0.040456-0.44130.329892
240.0132360.14440.442718
25-0.010788-0.11770.45326
260.0818950.89340.186732
27-0.013513-0.14740.441528
28-0.069596-0.75920.224615
29-0.088954-0.97040.166913
30-0.070499-0.7690.221694
31-0.036656-0.39990.344985
32-0.047784-0.52130.301577
33-0.062444-0.68120.24854
34-0.074455-0.81220.209147
35-0.078766-0.85920.19597
36-0.119162-1.29990.098074
37-0.068938-0.7520.226762
38-0.006518-0.07110.471717
39-0.010539-0.1150.454331
400.0471840.51470.303852
410.0052550.05730.477191
42-0.021904-0.23890.405781
430.0069980.07630.46964
44-0.026516-0.28930.386444
450.0211490.23070.408969
46-0.032704-0.35680.360951
47-0.061997-0.67630.25008
48-0.115876-1.26410.104341


Parameters (Session):
par1 = 0.1 ; par2 = 0.9 ; par3 = 0.1 ;
Parameters (R input):
par1 = 48 ; par2 = 1 ; par3 = 1 ; par4 = 0 ; par5 = 12 ; par6 = White Noise ; par7 = 0.95 ; par8 = ;
R code (references can be found in the software module):
par8 <- ''
par7 <- '0.95'
par6 <- 'White Noise'
par5 <- '12'
par4 <- '0'
par3 <- '0'
par2 <- '1'
par1 <- '48'
if (par1 == 'Default') {
par1 = 10*log10(length(x))
} else {
par1 <- as.numeric(par1)
}
par2 <- as.numeric(par2)
par3 <- as.numeric(par3)
par4 <- as.numeric(par4)
par5 <- as.numeric(par5)
if (par6 == 'White Noise') par6 <- 'white' else par6 <- 'ma'
par7 <- as.numeric(par7)
if (par8 != '') par8 <- as.numeric(par8)
ox <- x
if (par8 == '') {
if (par2 == 0) {
x <- log(x)
} else {
x <- (x ^ par2 - 1) / par2
}
} else {
x <- log(x,base=par8)
}
if (par3 > 0) x <- diff(x,lag=1,difference=par3)
if (par4 > 0) x <- diff(x,lag=par5,difference=par4)
bitmap(file='picts.png')
op <- par(mfrow=c(2,1))
plot(ox,type='l',main='Original Time Series',xlab='time',ylab='value')
if (par8=='') {
mytitle <- paste('Working Time Series (lambda=',par2,', d=',par3,', D=',par4,')',sep='')
mysub <- paste('(lambda=',par2,', d=',par3,', D=',par4,', CI=', par7, ', CI type=',par6,')',sep='')
} else {
mytitle <- paste('Working Time Series (base=',par8,', d=',par3,', D=',par4,')',sep='')
mysub <- paste('(base=',par8,', d=',par3,', D=',par4,', CI=', par7, ', CI type=',par6,')',sep='')
}
plot(x,type='l', main=mytitle,xlab='time',ylab='value')
par(op)
dev.off()
bitmap(file='pic1.png')
racf <- acf(x, par1, main='Autocorrelation', xlab='time lag', ylab='ACF', ci.type=par6, ci=par7, sub=mysub)
dev.off()
bitmap(file='pic2.png')
rpacf <- pacf(x,par1,main='Partial Autocorrelation',xlab='lags',ylab='PACF',sub=mysub)
dev.off()
(myacf <- c(racf$acf))
(mypacf <- c(rpacf$acf))
lengthx <- length(x)
sqrtn <- sqrt(lengthx)
load(file='createtable')
a<-table.start()
a<-table.row.start(a)
a<-table.element(a,'Autocorrelation Function',4,TRUE)
a<-table.row.end(a)
a<-table.row.start(a)
a<-table.element(a,'Time lag k',header=TRUE)
a<-table.element(a,hyperlink('basics.htm','ACF(k)','click here for more information about the Autocorrelation Function'),header=TRUE)
a<-table.element(a,'T-STAT',header=TRUE)
a<-table.element(a,'P-value',header=TRUE)
a<-table.row.end(a)
for (i in 2:(par1+1)) {
a<-table.row.start(a)
a<-table.element(a,i-1,header=TRUE)
a<-table.element(a,round(myacf[i],6))
mytstat <- myacf[i]*sqrtn
a<-table.element(a,round(mytstat,4))
a<-table.element(a,round(1-pt(abs(mytstat),lengthx),6))
a<-table.row.end(a)
}
a<-table.end(a)
table.save(a,file='mytable.tab')
a<-table.start()
a<-table.row.start(a)
a<-table.element(a,'Partial Autocorrelation Function',4,TRUE)
a<-table.row.end(a)
a<-table.row.start(a)
a<-table.element(a,'Time lag k',header=TRUE)
a<-table.element(a,hyperlink('basics.htm','PACF(k)','click here for more information about the Partial Autocorrelation Function'),header=TRUE)
a<-table.element(a,'T-STAT',header=TRUE)
a<-table.element(a,'P-value',header=TRUE)
a<-table.row.end(a)
for (i in 1:par1) {
a<-table.row.start(a)
a<-table.element(a,i,header=TRUE)
a<-table.element(a,round(mypacf[i],6))
mytstat <- mypacf[i]*sqrtn
a<-table.element(a,round(mytstat,4))
a<-table.element(a,round(1-pt(abs(mytstat),lengthx),6))
a<-table.row.end(a)
}
a<-table.end(a)
table.save(a,file='mytable1.tab')