Free Statistics

of Irreproducible Research!

Author's title

Author*Unverified author*
R Software Modulerwasp_autocorrelation.wasp
Title produced by software(Partial) Autocorrelation Function
Date of computationMon, 13 Aug 2012 08:13:48 -0400
Cite this page as followsStatistical Computations at FreeStatistics.org, Office for Research Development and Education, URL https://freestatistics.org/blog/index.php?v=date/2012/Aug/13/t1344860102fvwagf7m4n1nkbd.htm/, Retrieved Sat, 27 Apr 2024 15:26:56 +0000
Statistical Computations at FreeStatistics.org, Office for Research Development and Education, URL https://freestatistics.org/blog/index.php?pk=169273, Retrieved Sat, 27 Apr 2024 15:26:56 +0000
QR Codes:

Original text written by user:
IsPrivate?No (this computation is public)
User-defined keywordsVerbraken Frederik
Estimated Impact150
Family? (F = Feedback message, R = changed R code, M = changed R Module, P = changed Parameters, D = changed Data)
-       [(Partial) Autocorrelation Function] [TIJDREEKS B - STA...] [2012-08-13 12:13:48] [31886bd2f92a612f059dd2285dd41f3c] [Current]
Feedback Forum

Post a new message
Dataseries X:
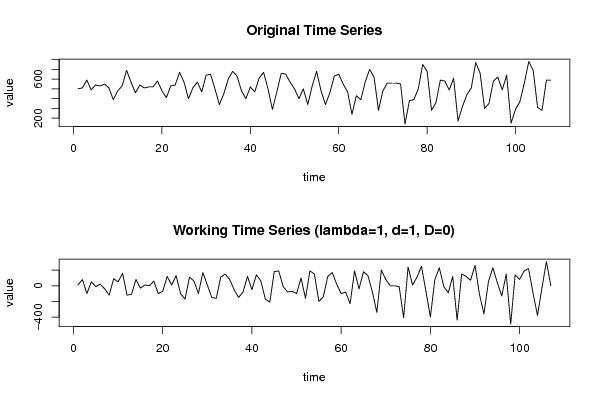
500
510
590
490
540
530
550
510
390
480
530
690
570
460
540
510
520
520
580
480
410
530
540
670
570
400
510
570
470
640
650
500
340
450
600
680
630
480
400
520
470
610
670
500
290
470
660
650
570
500
400
500
340
530
680
480
340
460
630
650
550
470
240
430
390
570
700
620
280
480
560
560
560
550
140
380
390
500
750
680
280
360
590
580
490
610
170
320
440
510
770
660
300
350
580
620
490
640
150
290
370
560
780
690
310
280
590
590


Summary of computational transaction
Raw Inputview raw input (R code)
Raw Outputview raw output of R engine
Computing time2 seconds
R Server'Gertrude Mary Cox' @ cox.wessa.net

\begin{tabular}{lllllllll}
\hline
Summary of computational transaction \tabularnewline
Raw Input & view raw input (R code)  \tabularnewline
Raw Output & view raw output of R engine  \tabularnewline
Computing time & 2 seconds \tabularnewline
R Server & 'Gertrude Mary Cox' @ cox.wessa.net \tabularnewline
\hline
\end{tabular}
%Source: https://freestatistics.org/blog/index.php?pk=169273&T=0

[TABLE]
[ROW][C]Summary of computational transaction[/C][/ROW]
[ROW][C]Raw Input[/C][C]view raw input (R code) [/C][/ROW]
[ROW][C]Raw Output[/C][C]view raw output of R engine [/C][/ROW]
[ROW][C]Computing time[/C][C]2 seconds[/C][/ROW]
[ROW][C]R Server[/C][C]'Gertrude Mary Cox' @ cox.wessa.net[/C][/ROW]
[/TABLE]
Source: https://freestatistics.org/blog/index.php?pk=169273&T=0

Globally Unique Identifier (entire table): ba.freestatistics.org/blog/index.php?pk=169273&T=0

As an alternative you can also use a QR Code:  

The GUIDs for individual cells are displayed in the table below:

Summary of computational transaction
Raw Inputview raw input (R code)
Raw Outputview raw output of R engine
Computing time2 seconds
R Server'Gertrude Mary Cox' @ cox.wessa.net


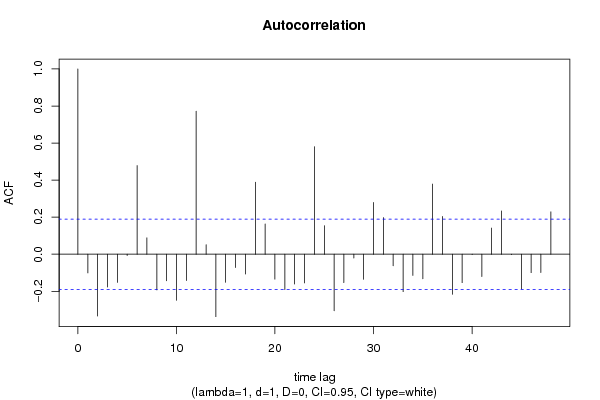
Autocorrelation Function
Time lag kACF(k)T-STATP-value
1-0.100951-1.04420.149364
2-0.3338-3.45290.000398
3-0.176684-1.82760.035196
4-0.152172-1.57410.059211
5-0.006903-0.07140.471602
60.4783614.94821e-06
70.0880680.9110.182176
8-0.192734-1.99370.024367
9-0.1438-1.48750.069914
10-0.248884-2.57450.005703
11-0.142152-1.47040.07219
120.7720727.98640
130.0507650.52510.300295
14-0.337145-3.48750.000354
15-0.151491-1.5670.060029
16-0.071977-0.74450.229091
17-0.107186-1.10870.135014
180.3886674.02045.4e-05
190.1629841.68590.047363
20-0.134642-1.39270.083292
21-0.190395-1.96950.025743
22-0.160668-1.6620.049724
23-0.154987-1.60320.055919
240.5800736.00030
250.1533551.58630.057809
26-0.305075-3.15570.00104
27-0.153302-1.58580.057871
28-0.021018-0.21740.414153
29-0.135064-1.39710.082635
300.2791742.88780.002348
310.1973152.0410.021854
32-0.062322-0.64470.260262
33-0.202234-2.09190.019406
34-0.114501-1.18440.119438
35-0.132696-1.37260.08637
360.3783863.91418e-05
370.2037232.10730.018713
38-0.216617-2.24070.013555
39-0.153536-1.58820.057597
40-0.002103-0.02180.491341
41-0.120653-1.2480.107369
420.1410071.45860.073804
430.2328822.40890.008854
44-0.002173-0.02250.491053
45-0.187997-1.94470.02722
46-0.099479-1.0290.152895
47-0.098608-1.020.155012
480.2284042.36260.009976

\begin{tabular}{lllllllll}
\hline
Autocorrelation Function \tabularnewline
Time lag k & ACF(k) & T-STAT & P-value \tabularnewline
1 & -0.100951 & -1.0442 & 0.149364 \tabularnewline
2 & -0.3338 & -3.4529 & 0.000398 \tabularnewline
3 & -0.176684 & -1.8276 & 0.035196 \tabularnewline
4 & -0.152172 & -1.5741 & 0.059211 \tabularnewline
5 & -0.006903 & -0.0714 & 0.471602 \tabularnewline
6 & 0.478361 & 4.9482 & 1e-06 \tabularnewline
7 & 0.088068 & 0.911 & 0.182176 \tabularnewline
8 & -0.192734 & -1.9937 & 0.024367 \tabularnewline
9 & -0.1438 & -1.4875 & 0.069914 \tabularnewline
10 & -0.248884 & -2.5745 & 0.005703 \tabularnewline
11 & -0.142152 & -1.4704 & 0.07219 \tabularnewline
12 & 0.772072 & 7.9864 & 0 \tabularnewline
13 & 0.050765 & 0.5251 & 0.300295 \tabularnewline
14 & -0.337145 & -3.4875 & 0.000354 \tabularnewline
15 & -0.151491 & -1.567 & 0.060029 \tabularnewline
16 & -0.071977 & -0.7445 & 0.229091 \tabularnewline
17 & -0.107186 & -1.1087 & 0.135014 \tabularnewline
18 & 0.388667 & 4.0204 & 5.4e-05 \tabularnewline
19 & 0.162984 & 1.6859 & 0.047363 \tabularnewline
20 & -0.134642 & -1.3927 & 0.083292 \tabularnewline
21 & -0.190395 & -1.9695 & 0.025743 \tabularnewline
22 & -0.160668 & -1.662 & 0.049724 \tabularnewline
23 & -0.154987 & -1.6032 & 0.055919 \tabularnewline
24 & 0.580073 & 6.0003 & 0 \tabularnewline
25 & 0.153355 & 1.5863 & 0.057809 \tabularnewline
26 & -0.305075 & -3.1557 & 0.00104 \tabularnewline
27 & -0.153302 & -1.5858 & 0.057871 \tabularnewline
28 & -0.021018 & -0.2174 & 0.414153 \tabularnewline
29 & -0.135064 & -1.3971 & 0.082635 \tabularnewline
30 & 0.279174 & 2.8878 & 0.002348 \tabularnewline
31 & 0.197315 & 2.041 & 0.021854 \tabularnewline
32 & -0.062322 & -0.6447 & 0.260262 \tabularnewline
33 & -0.202234 & -2.0919 & 0.019406 \tabularnewline
34 & -0.114501 & -1.1844 & 0.119438 \tabularnewline
35 & -0.132696 & -1.3726 & 0.08637 \tabularnewline
36 & 0.378386 & 3.9141 & 8e-05 \tabularnewline
37 & 0.203723 & 2.1073 & 0.018713 \tabularnewline
38 & -0.216617 & -2.2407 & 0.013555 \tabularnewline
39 & -0.153536 & -1.5882 & 0.057597 \tabularnewline
40 & -0.002103 & -0.0218 & 0.491341 \tabularnewline
41 & -0.120653 & -1.248 & 0.107369 \tabularnewline
42 & 0.141007 & 1.4586 & 0.073804 \tabularnewline
43 & 0.232882 & 2.4089 & 0.008854 \tabularnewline
44 & -0.002173 & -0.0225 & 0.491053 \tabularnewline
45 & -0.187997 & -1.9447 & 0.02722 \tabularnewline
46 & -0.099479 & -1.029 & 0.152895 \tabularnewline
47 & -0.098608 & -1.02 & 0.155012 \tabularnewline
48 & 0.228404 & 2.3626 & 0.009976 \tabularnewline
\hline
\end{tabular}
%Source: https://freestatistics.org/blog/index.php?pk=169273&T=1

[TABLE]
[ROW][C]Autocorrelation Function[/C][/ROW]
[ROW][C]Time lag k[/C][C]ACF(k)[/C][C]T-STAT[/C][C]P-value[/C][/ROW]
[ROW][C]1[/C][C]-0.100951[/C][C]-1.0442[/C][C]0.149364[/C][/ROW]
[ROW][C]2[/C][C]-0.3338[/C][C]-3.4529[/C][C]0.000398[/C][/ROW]
[ROW][C]3[/C][C]-0.176684[/C][C]-1.8276[/C][C]0.035196[/C][/ROW]
[ROW][C]4[/C][C]-0.152172[/C][C]-1.5741[/C][C]0.059211[/C][/ROW]
[ROW][C]5[/C][C]-0.006903[/C][C]-0.0714[/C][C]0.471602[/C][/ROW]
[ROW][C]6[/C][C]0.478361[/C][C]4.9482[/C][C]1e-06[/C][/ROW]
[ROW][C]7[/C][C]0.088068[/C][C]0.911[/C][C]0.182176[/C][/ROW]
[ROW][C]8[/C][C]-0.192734[/C][C]-1.9937[/C][C]0.024367[/C][/ROW]
[ROW][C]9[/C][C]-0.1438[/C][C]-1.4875[/C][C]0.069914[/C][/ROW]
[ROW][C]10[/C][C]-0.248884[/C][C]-2.5745[/C][C]0.005703[/C][/ROW]
[ROW][C]11[/C][C]-0.142152[/C][C]-1.4704[/C][C]0.07219[/C][/ROW]
[ROW][C]12[/C][C]0.772072[/C][C]7.9864[/C][C]0[/C][/ROW]
[ROW][C]13[/C][C]0.050765[/C][C]0.5251[/C][C]0.300295[/C][/ROW]
[ROW][C]14[/C][C]-0.337145[/C][C]-3.4875[/C][C]0.000354[/C][/ROW]
[ROW][C]15[/C][C]-0.151491[/C][C]-1.567[/C][C]0.060029[/C][/ROW]
[ROW][C]16[/C][C]-0.071977[/C][C]-0.7445[/C][C]0.229091[/C][/ROW]
[ROW][C]17[/C][C]-0.107186[/C][C]-1.1087[/C][C]0.135014[/C][/ROW]
[ROW][C]18[/C][C]0.388667[/C][C]4.0204[/C][C]5.4e-05[/C][/ROW]
[ROW][C]19[/C][C]0.162984[/C][C]1.6859[/C][C]0.047363[/C][/ROW]
[ROW][C]20[/C][C]-0.134642[/C][C]-1.3927[/C][C]0.083292[/C][/ROW]
[ROW][C]21[/C][C]-0.190395[/C][C]-1.9695[/C][C]0.025743[/C][/ROW]
[ROW][C]22[/C][C]-0.160668[/C][C]-1.662[/C][C]0.049724[/C][/ROW]
[ROW][C]23[/C][C]-0.154987[/C][C]-1.6032[/C][C]0.055919[/C][/ROW]
[ROW][C]24[/C][C]0.580073[/C][C]6.0003[/C][C]0[/C][/ROW]
[ROW][C]25[/C][C]0.153355[/C][C]1.5863[/C][C]0.057809[/C][/ROW]
[ROW][C]26[/C][C]-0.305075[/C][C]-3.1557[/C][C]0.00104[/C][/ROW]
[ROW][C]27[/C][C]-0.153302[/C][C]-1.5858[/C][C]0.057871[/C][/ROW]
[ROW][C]28[/C][C]-0.021018[/C][C]-0.2174[/C][C]0.414153[/C][/ROW]
[ROW][C]29[/C][C]-0.135064[/C][C]-1.3971[/C][C]0.082635[/C][/ROW]
[ROW][C]30[/C][C]0.279174[/C][C]2.8878[/C][C]0.002348[/C][/ROW]
[ROW][C]31[/C][C]0.197315[/C][C]2.041[/C][C]0.021854[/C][/ROW]
[ROW][C]32[/C][C]-0.062322[/C][C]-0.6447[/C][C]0.260262[/C][/ROW]
[ROW][C]33[/C][C]-0.202234[/C][C]-2.0919[/C][C]0.019406[/C][/ROW]
[ROW][C]34[/C][C]-0.114501[/C][C]-1.1844[/C][C]0.119438[/C][/ROW]
[ROW][C]35[/C][C]-0.132696[/C][C]-1.3726[/C][C]0.08637[/C][/ROW]
[ROW][C]36[/C][C]0.378386[/C][C]3.9141[/C][C]8e-05[/C][/ROW]
[ROW][C]37[/C][C]0.203723[/C][C]2.1073[/C][C]0.018713[/C][/ROW]
[ROW][C]38[/C][C]-0.216617[/C][C]-2.2407[/C][C]0.013555[/C][/ROW]
[ROW][C]39[/C][C]-0.153536[/C][C]-1.5882[/C][C]0.057597[/C][/ROW]
[ROW][C]40[/C][C]-0.002103[/C][C]-0.0218[/C][C]0.491341[/C][/ROW]
[ROW][C]41[/C][C]-0.120653[/C][C]-1.248[/C][C]0.107369[/C][/ROW]
[ROW][C]42[/C][C]0.141007[/C][C]1.4586[/C][C]0.073804[/C][/ROW]
[ROW][C]43[/C][C]0.232882[/C][C]2.4089[/C][C]0.008854[/C][/ROW]
[ROW][C]44[/C][C]-0.002173[/C][C]-0.0225[/C][C]0.491053[/C][/ROW]
[ROW][C]45[/C][C]-0.187997[/C][C]-1.9447[/C][C]0.02722[/C][/ROW]
[ROW][C]46[/C][C]-0.099479[/C][C]-1.029[/C][C]0.152895[/C][/ROW]
[ROW][C]47[/C][C]-0.098608[/C][C]-1.02[/C][C]0.155012[/C][/ROW]
[ROW][C]48[/C][C]0.228404[/C][C]2.3626[/C][C]0.009976[/C][/ROW]
[/TABLE]
Source: https://freestatistics.org/blog/index.php?pk=169273&T=1

Globally Unique Identifier (entire table): ba.freestatistics.org/blog/index.php?pk=169273&T=1

As an alternative you can also use a QR Code:  

The GUIDs for individual cells are displayed in the table below:

Autocorrelation Function
Time lag kACF(k)T-STATP-value
1-0.100951-1.04420.149364
2-0.3338-3.45290.000398
3-0.176684-1.82760.035196
4-0.152172-1.57410.059211
5-0.006903-0.07140.471602
60.4783614.94821e-06
70.0880680.9110.182176
8-0.192734-1.99370.024367
9-0.1438-1.48750.069914
10-0.248884-2.57450.005703
11-0.142152-1.47040.07219
120.7720727.98640
130.0507650.52510.300295
14-0.337145-3.48750.000354
15-0.151491-1.5670.060029
16-0.071977-0.74450.229091
17-0.107186-1.10870.135014
180.3886674.02045.4e-05
190.1629841.68590.047363
20-0.134642-1.39270.083292
21-0.190395-1.96950.025743
22-0.160668-1.6620.049724
23-0.154987-1.60320.055919
240.5800736.00030
250.1533551.58630.057809
26-0.305075-3.15570.00104
27-0.153302-1.58580.057871
28-0.021018-0.21740.414153
29-0.135064-1.39710.082635
300.2791742.88780.002348
310.1973152.0410.021854
32-0.062322-0.64470.260262
33-0.202234-2.09190.019406
34-0.114501-1.18440.119438
35-0.132696-1.37260.08637
360.3783863.91418e-05
370.2037232.10730.018713
38-0.216617-2.24070.013555
39-0.153536-1.58820.057597
40-0.002103-0.02180.491341
41-0.120653-1.2480.107369
420.1410071.45860.073804
430.2328822.40890.008854
44-0.002173-0.02250.491053
45-0.187997-1.94470.02722
46-0.099479-1.0290.152895
47-0.098608-1.020.155012
480.2284042.36260.009976


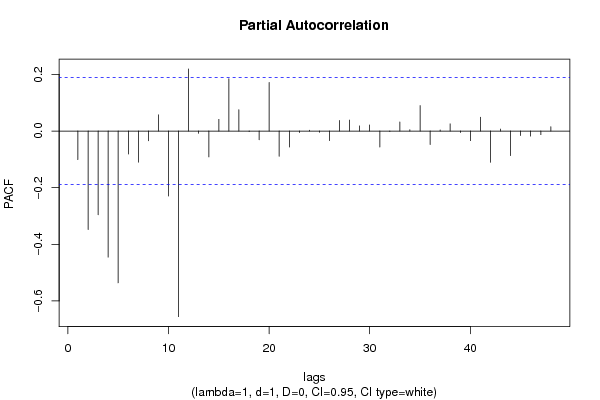
Partial Autocorrelation Function
Time lag kPACF(k)T-STATP-value
1-0.100951-1.04420.149364
2-0.347533-3.59490.000246
3-0.295516-3.05680.001413
4-0.445207-4.60536e-06
5-0.535972-5.54410
6-0.081311-0.84110.201088
7-0.109928-1.13710.129017
8-0.034402-0.35590.361322
90.0569380.5890.278563
10-0.229421-2.37310.009711
11-0.655269-6.77820
120.2190272.26560.012743
13-0.008138-0.08420.466535
14-0.091257-0.9440.173656
150.0411470.42560.335616
160.1845941.90950.029441
170.0750790.77660.219547
18-0.001822-0.01890.492498
19-0.030718-0.31780.375645
200.1714351.77330.039509
21-0.089376-0.92450.178651
22-0.05633-0.58270.280665
23-0.005179-0.05360.478689
240.0026550.02750.489069
25-0.00451-0.04660.48144
26-0.033868-0.35030.363388
270.0372070.38490.35055
280.0384910.39820.345655
290.0180230.18640.426231
300.021190.21920.413459
31-0.056218-0.58150.281056
32-0.001712-0.01770.492951
330.0316130.3270.37215
340.0042840.04430.482366
350.0896230.92710.17799
36-0.04788-0.49530.310712
370.003690.03820.484814
380.02530.26170.397025
39-0.005519-0.05710.477289
40-0.034051-0.35220.36268
410.0488650.50550.307137
42-0.110494-1.1430.127803
430.0066510.06880.472639
44-0.086815-0.8980.185595
45-0.015877-0.16420.434929
46-0.017994-0.18610.426347
47-0.012932-0.13380.44692
480.0151570.15680.437853

\begin{tabular}{lllllllll}
\hline
Partial Autocorrelation Function \tabularnewline
Time lag k & PACF(k) & T-STAT & P-value \tabularnewline
1 & -0.100951 & -1.0442 & 0.149364 \tabularnewline
2 & -0.347533 & -3.5949 & 0.000246 \tabularnewline
3 & -0.295516 & -3.0568 & 0.001413 \tabularnewline
4 & -0.445207 & -4.6053 & 6e-06 \tabularnewline
5 & -0.535972 & -5.5441 & 0 \tabularnewline
6 & -0.081311 & -0.8411 & 0.201088 \tabularnewline
7 & -0.109928 & -1.1371 & 0.129017 \tabularnewline
8 & -0.034402 & -0.3559 & 0.361322 \tabularnewline
9 & 0.056938 & 0.589 & 0.278563 \tabularnewline
10 & -0.229421 & -2.3731 & 0.009711 \tabularnewline
11 & -0.655269 & -6.7782 & 0 \tabularnewline
12 & 0.219027 & 2.2656 & 0.012743 \tabularnewline
13 & -0.008138 & -0.0842 & 0.466535 \tabularnewline
14 & -0.091257 & -0.944 & 0.173656 \tabularnewline
15 & 0.041147 & 0.4256 & 0.335616 \tabularnewline
16 & 0.184594 & 1.9095 & 0.029441 \tabularnewline
17 & 0.075079 & 0.7766 & 0.219547 \tabularnewline
18 & -0.001822 & -0.0189 & 0.492498 \tabularnewline
19 & -0.030718 & -0.3178 & 0.375645 \tabularnewline
20 & 0.171435 & 1.7733 & 0.039509 \tabularnewline
21 & -0.089376 & -0.9245 & 0.178651 \tabularnewline
22 & -0.05633 & -0.5827 & 0.280665 \tabularnewline
23 & -0.005179 & -0.0536 & 0.478689 \tabularnewline
24 & 0.002655 & 0.0275 & 0.489069 \tabularnewline
25 & -0.00451 & -0.0466 & 0.48144 \tabularnewline
26 & -0.033868 & -0.3503 & 0.363388 \tabularnewline
27 & 0.037207 & 0.3849 & 0.35055 \tabularnewline
28 & 0.038491 & 0.3982 & 0.345655 \tabularnewline
29 & 0.018023 & 0.1864 & 0.426231 \tabularnewline
30 & 0.02119 & 0.2192 & 0.413459 \tabularnewline
31 & -0.056218 & -0.5815 & 0.281056 \tabularnewline
32 & -0.001712 & -0.0177 & 0.492951 \tabularnewline
33 & 0.031613 & 0.327 & 0.37215 \tabularnewline
34 & 0.004284 & 0.0443 & 0.482366 \tabularnewline
35 & 0.089623 & 0.9271 & 0.17799 \tabularnewline
36 & -0.04788 & -0.4953 & 0.310712 \tabularnewline
37 & 0.00369 & 0.0382 & 0.484814 \tabularnewline
38 & 0.0253 & 0.2617 & 0.397025 \tabularnewline
39 & -0.005519 & -0.0571 & 0.477289 \tabularnewline
40 & -0.034051 & -0.3522 & 0.36268 \tabularnewline
41 & 0.048865 & 0.5055 & 0.307137 \tabularnewline
42 & -0.110494 & -1.143 & 0.127803 \tabularnewline
43 & 0.006651 & 0.0688 & 0.472639 \tabularnewline
44 & -0.086815 & -0.898 & 0.185595 \tabularnewline
45 & -0.015877 & -0.1642 & 0.434929 \tabularnewline
46 & -0.017994 & -0.1861 & 0.426347 \tabularnewline
47 & -0.012932 & -0.1338 & 0.44692 \tabularnewline
48 & 0.015157 & 0.1568 & 0.437853 \tabularnewline
\hline
\end{tabular}
%Source: https://freestatistics.org/blog/index.php?pk=169273&T=2

[TABLE]
[ROW][C]Partial Autocorrelation Function[/C][/ROW]
[ROW][C]Time lag k[/C][C]PACF(k)[/C][C]T-STAT[/C][C]P-value[/C][/ROW]
[ROW][C]1[/C][C]-0.100951[/C][C]-1.0442[/C][C]0.149364[/C][/ROW]
[ROW][C]2[/C][C]-0.347533[/C][C]-3.5949[/C][C]0.000246[/C][/ROW]
[ROW][C]3[/C][C]-0.295516[/C][C]-3.0568[/C][C]0.001413[/C][/ROW]
[ROW][C]4[/C][C]-0.445207[/C][C]-4.6053[/C][C]6e-06[/C][/ROW]
[ROW][C]5[/C][C]-0.535972[/C][C]-5.5441[/C][C]0[/C][/ROW]
[ROW][C]6[/C][C]-0.081311[/C][C]-0.8411[/C][C]0.201088[/C][/ROW]
[ROW][C]7[/C][C]-0.109928[/C][C]-1.1371[/C][C]0.129017[/C][/ROW]
[ROW][C]8[/C][C]-0.034402[/C][C]-0.3559[/C][C]0.361322[/C][/ROW]
[ROW][C]9[/C][C]0.056938[/C][C]0.589[/C][C]0.278563[/C][/ROW]
[ROW][C]10[/C][C]-0.229421[/C][C]-2.3731[/C][C]0.009711[/C][/ROW]
[ROW][C]11[/C][C]-0.655269[/C][C]-6.7782[/C][C]0[/C][/ROW]
[ROW][C]12[/C][C]0.219027[/C][C]2.2656[/C][C]0.012743[/C][/ROW]
[ROW][C]13[/C][C]-0.008138[/C][C]-0.0842[/C][C]0.466535[/C][/ROW]
[ROW][C]14[/C][C]-0.091257[/C][C]-0.944[/C][C]0.173656[/C][/ROW]
[ROW][C]15[/C][C]0.041147[/C][C]0.4256[/C][C]0.335616[/C][/ROW]
[ROW][C]16[/C][C]0.184594[/C][C]1.9095[/C][C]0.029441[/C][/ROW]
[ROW][C]17[/C][C]0.075079[/C][C]0.7766[/C][C]0.219547[/C][/ROW]
[ROW][C]18[/C][C]-0.001822[/C][C]-0.0189[/C][C]0.492498[/C][/ROW]
[ROW][C]19[/C][C]-0.030718[/C][C]-0.3178[/C][C]0.375645[/C][/ROW]
[ROW][C]20[/C][C]0.171435[/C][C]1.7733[/C][C]0.039509[/C][/ROW]
[ROW][C]21[/C][C]-0.089376[/C][C]-0.9245[/C][C]0.178651[/C][/ROW]
[ROW][C]22[/C][C]-0.05633[/C][C]-0.5827[/C][C]0.280665[/C][/ROW]
[ROW][C]23[/C][C]-0.005179[/C][C]-0.0536[/C][C]0.478689[/C][/ROW]
[ROW][C]24[/C][C]0.002655[/C][C]0.0275[/C][C]0.489069[/C][/ROW]
[ROW][C]25[/C][C]-0.00451[/C][C]-0.0466[/C][C]0.48144[/C][/ROW]
[ROW][C]26[/C][C]-0.033868[/C][C]-0.3503[/C][C]0.363388[/C][/ROW]
[ROW][C]27[/C][C]0.037207[/C][C]0.3849[/C][C]0.35055[/C][/ROW]
[ROW][C]28[/C][C]0.038491[/C][C]0.3982[/C][C]0.345655[/C][/ROW]
[ROW][C]29[/C][C]0.018023[/C][C]0.1864[/C][C]0.426231[/C][/ROW]
[ROW][C]30[/C][C]0.02119[/C][C]0.2192[/C][C]0.413459[/C][/ROW]
[ROW][C]31[/C][C]-0.056218[/C][C]-0.5815[/C][C]0.281056[/C][/ROW]
[ROW][C]32[/C][C]-0.001712[/C][C]-0.0177[/C][C]0.492951[/C][/ROW]
[ROW][C]33[/C][C]0.031613[/C][C]0.327[/C][C]0.37215[/C][/ROW]
[ROW][C]34[/C][C]0.004284[/C][C]0.0443[/C][C]0.482366[/C][/ROW]
[ROW][C]35[/C][C]0.089623[/C][C]0.9271[/C][C]0.17799[/C][/ROW]
[ROW][C]36[/C][C]-0.04788[/C][C]-0.4953[/C][C]0.310712[/C][/ROW]
[ROW][C]37[/C][C]0.00369[/C][C]0.0382[/C][C]0.484814[/C][/ROW]
[ROW][C]38[/C][C]0.0253[/C][C]0.2617[/C][C]0.397025[/C][/ROW]
[ROW][C]39[/C][C]-0.005519[/C][C]-0.0571[/C][C]0.477289[/C][/ROW]
[ROW][C]40[/C][C]-0.034051[/C][C]-0.3522[/C][C]0.36268[/C][/ROW]
[ROW][C]41[/C][C]0.048865[/C][C]0.5055[/C][C]0.307137[/C][/ROW]
[ROW][C]42[/C][C]-0.110494[/C][C]-1.143[/C][C]0.127803[/C][/ROW]
[ROW][C]43[/C][C]0.006651[/C][C]0.0688[/C][C]0.472639[/C][/ROW]
[ROW][C]44[/C][C]-0.086815[/C][C]-0.898[/C][C]0.185595[/C][/ROW]
[ROW][C]45[/C][C]-0.015877[/C][C]-0.1642[/C][C]0.434929[/C][/ROW]
[ROW][C]46[/C][C]-0.017994[/C][C]-0.1861[/C][C]0.426347[/C][/ROW]
[ROW][C]47[/C][C]-0.012932[/C][C]-0.1338[/C][C]0.44692[/C][/ROW]
[ROW][C]48[/C][C]0.015157[/C][C]0.1568[/C][C]0.437853[/C][/ROW]
[/TABLE]
Source: https://freestatistics.org/blog/index.php?pk=169273&T=2

Globally Unique Identifier (entire table): ba.freestatistics.org/blog/index.php?pk=169273&T=2

As an alternative you can also use a QR Code:  

The GUIDs for individual cells are displayed in the table below:

Partial Autocorrelation Function
Time lag kPACF(k)T-STATP-value
1-0.100951-1.04420.149364
2-0.347533-3.59490.000246
3-0.295516-3.05680.001413
4-0.445207-4.60536e-06
5-0.535972-5.54410
6-0.081311-0.84110.201088
7-0.109928-1.13710.129017
8-0.034402-0.35590.361322
90.0569380.5890.278563
10-0.229421-2.37310.009711
11-0.655269-6.77820
120.2190272.26560.012743
13-0.008138-0.08420.466535
14-0.091257-0.9440.173656
150.0411470.42560.335616
160.1845941.90950.029441
170.0750790.77660.219547
18-0.001822-0.01890.492498
19-0.030718-0.31780.375645
200.1714351.77330.039509
21-0.089376-0.92450.178651
22-0.05633-0.58270.280665
23-0.005179-0.05360.478689
240.0026550.02750.489069
25-0.00451-0.04660.48144
26-0.033868-0.35030.363388
270.0372070.38490.35055
280.0384910.39820.345655
290.0180230.18640.426231
300.021190.21920.413459
31-0.056218-0.58150.281056
32-0.001712-0.01770.492951
330.0316130.3270.37215
340.0042840.04430.482366
350.0896230.92710.17799
36-0.04788-0.49530.310712
370.003690.03820.484814
380.02530.26170.397025
39-0.005519-0.05710.477289
40-0.034051-0.35220.36268
410.0488650.50550.307137
42-0.110494-1.1430.127803
430.0066510.06880.472639
44-0.086815-0.8980.185595
45-0.015877-0.16420.434929
46-0.017994-0.18610.426347
47-0.012932-0.13380.44692
480.0151570.15680.437853


Parameters (Session):
par1 = 48 ; par2 = 1 ; par3 = 1 ; par4 = 0 ; par5 = 12 ; par6 = White Noise ; par7 = 0.95 ;
Parameters (R input):
par1 = 48 ; par2 = 1 ; par3 = 1 ; par4 = 0 ; par5 = 12 ; par6 = White Noise ; par7 = 0.95 ; par8 = ;
R code (references can be found in the software module):
par8 <- ''
par7 <- '0.95'
par6 <- 'White Noise'
par5 <- '12'
par4 <- '0'
par3 <- '1'
par2 <- '1'
par1 <- '48'
if (par1 == 'Default') {
par1 = 10*log10(length(x))
} else {
par1 <- as.numeric(par1)
}
par2 <- as.numeric(par2)
par3 <- as.numeric(par3)
par4 <- as.numeric(par4)
par5 <- as.numeric(par5)
if (par6 == 'White Noise') par6 <- 'white' else par6 <- 'ma'
par7 <- as.numeric(par7)
if (par8 != '') par8 <- as.numeric(par8)
ox <- x
if (par8 == '') {
if (par2 == 0) {
x <- log(x)
} else {
x <- (x ^ par2 - 1) / par2
}
} else {
x <- log(x,base=par8)
}
if (par3 > 0) x <- diff(x,lag=1,difference=par3)
if (par4 > 0) x <- diff(x,lag=par5,difference=par4)
bitmap(file='picts.png')
op <- par(mfrow=c(2,1))
plot(ox,type='l',main='Original Time Series',xlab='time',ylab='value')
if (par8=='') {
mytitle <- paste('Working Time Series (lambda=',par2,', d=',par3,', D=',par4,')',sep='')
mysub <- paste('(lambda=',par2,', d=',par3,', D=',par4,', CI=', par7, ', CI type=',par6,')',sep='')
} else {
mytitle <- paste('Working Time Series (base=',par8,', d=',par3,', D=',par4,')',sep='')
mysub <- paste('(base=',par8,', d=',par3,', D=',par4,', CI=', par7, ', CI type=',par6,')',sep='')
}
plot(x,type='l', main=mytitle,xlab='time',ylab='value')
par(op)
dev.off()
bitmap(file='pic1.png')
racf <- acf(x, par1, main='Autocorrelation', xlab='time lag', ylab='ACF', ci.type=par6, ci=par7, sub=mysub)
dev.off()
bitmap(file='pic2.png')
rpacf <- pacf(x,par1,main='Partial Autocorrelation',xlab='lags',ylab='PACF',sub=mysub)
dev.off()
(myacf <- c(racf$acf))
(mypacf <- c(rpacf$acf))
lengthx <- length(x)
sqrtn <- sqrt(lengthx)
load(file='createtable')
a<-table.start()
a<-table.row.start(a)
a<-table.element(a,'Autocorrelation Function',4,TRUE)
a<-table.row.end(a)
a<-table.row.start(a)
a<-table.element(a,'Time lag k',header=TRUE)
a<-table.element(a,hyperlink('basics.htm','ACF(k)','click here for more information about the Autocorrelation Function'),header=TRUE)
a<-table.element(a,'T-STAT',header=TRUE)
a<-table.element(a,'P-value',header=TRUE)
a<-table.row.end(a)
for (i in 2:(par1+1)) {
a<-table.row.start(a)
a<-table.element(a,i-1,header=TRUE)
a<-table.element(a,round(myacf[i],6))
mytstat <- myacf[i]*sqrtn
a<-table.element(a,round(mytstat,4))
a<-table.element(a,round(1-pt(abs(mytstat),lengthx),6))
a<-table.row.end(a)
}
a<-table.end(a)
table.save(a,file='mytable.tab')
a<-table.start()
a<-table.row.start(a)
a<-table.element(a,'Partial Autocorrelation Function',4,TRUE)
a<-table.row.end(a)
a<-table.row.start(a)
a<-table.element(a,'Time lag k',header=TRUE)
a<-table.element(a,hyperlink('basics.htm','PACF(k)','click here for more information about the Partial Autocorrelation Function'),header=TRUE)
a<-table.element(a,'T-STAT',header=TRUE)
a<-table.element(a,'P-value',header=TRUE)
a<-table.row.end(a)
for (i in 1:par1) {
a<-table.row.start(a)
a<-table.element(a,i,header=TRUE)
a<-table.element(a,round(mypacf[i],6))
mytstat <- mypacf[i]*sqrtn
a<-table.element(a,round(mytstat,4))
a<-table.element(a,round(1-pt(abs(mytstat),lengthx),6))
a<-table.row.end(a)
}
a<-table.end(a)
table.save(a,file='mytable1.tab')