Free Statistics

of Irreproducible Research!

Author's title

Author*Unverified author*
R Software Modulerwasp_autocorrelation.wasp
Title produced by software(Partial) Autocorrelation Function
Date of computationMon, 13 Aug 2012 05:33:54 -0400
Cite this page as followsStatistical Computations at FreeStatistics.org, Office for Research Development and Education, URL https://freestatistics.org/blog/index.php?v=date/2012/Aug/13/t1344850483qbx6r2860r7c999.htm/, Retrieved Sun, 28 Apr 2024 09:48:30 +0000
Statistical Computations at FreeStatistics.org, Office for Research Development and Education, URL https://freestatistics.org/blog/index.php?pk=169268, Retrieved Sun, 28 Apr 2024 09:48:30 +0000
QR Codes:

Original text written by user:
IsPrivate?No (this computation is public)
User-defined keywordsVerbraken Frederik
Estimated Impact149
Family? (F = Feedback message, R = changed R code, M = changed R Module, P = changed Parameters, D = changed Data)
-       [(Partial) Autocorrelation Function] [TIJDREEKS B - STA...] [2012-08-13 09:33:54] [31886bd2f92a612f059dd2285dd41f3c] [Current]
Feedback Forum

Post a new message
Dataseries X:
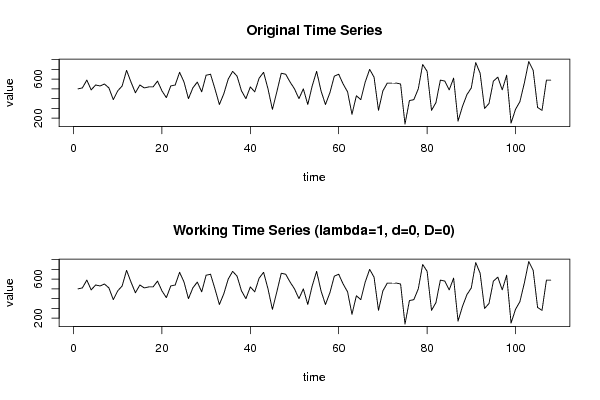
500
510
590
490
540
530
550
510
390
480
530
690
570
460
540
510
520
520
580
480
410
530
540
670
570
400
510
570
470
640
650
500
340
450
600
680
630
480
400
520
470
610
670
500
290
470
660
650
570
500
400
500
340
530
680
480
340
460
630
650
550
470
240
430
390
570
700
620
280
480
560
560
560
550
140
380
390
500
750
680
280
360
590
580
490
610
170
320
440
510
770
660
300
350
580
620
490
640
150
290
370
560
780
690
310
280
590
590


Summary of computational transaction
Raw Inputview raw input (R code)
Raw Outputview raw output of R engine
Computing time2 seconds
R Server'Herman Ole Andreas Wold' @ wold.wessa.net

\begin{tabular}{lllllllll}
\hline
Summary of computational transaction \tabularnewline
Raw Input & view raw input (R code)  \tabularnewline
Raw Output & view raw output of R engine  \tabularnewline
Computing time & 2 seconds \tabularnewline
R Server & 'Herman Ole Andreas Wold' @ wold.wessa.net \tabularnewline
\hline
\end{tabular}
%Source: https://freestatistics.org/blog/index.php?pk=169268&T=0

[TABLE]
[ROW][C]Summary of computational transaction[/C][/ROW]
[ROW][C]Raw Input[/C][C]view raw input (R code) [/C][/ROW]
[ROW][C]Raw Output[/C][C]view raw output of R engine [/C][/ROW]
[ROW][C]Computing time[/C][C]2 seconds[/C][/ROW]
[ROW][C]R Server[/C][C]'Herman Ole Andreas Wold' @ wold.wessa.net[/C][/ROW]
[/TABLE]
Source: https://freestatistics.org/blog/index.php?pk=169268&T=0

Globally Unique Identifier (entire table): ba.freestatistics.org/blog/index.php?pk=169268&T=0

As an alternative you can also use a QR Code:  

The GUIDs for individual cells are displayed in the table below:

Summary of computational transaction
Raw Inputview raw input (R code)
Raw Outputview raw output of R engine
Computing time2 seconds
R Server'Herman Ole Andreas Wold' @ wold.wessa.net


Autocorrelation Function
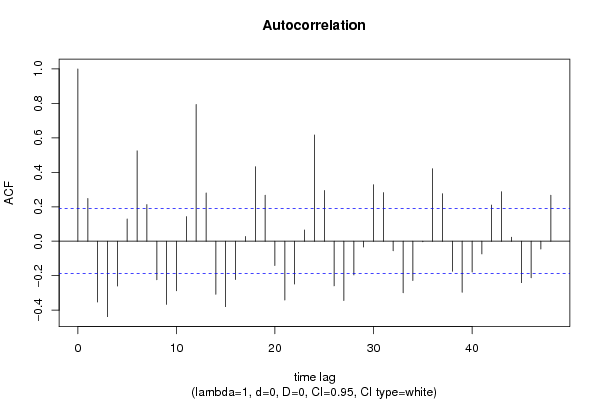
Time lag kACF(k)T-STATP-value
10.2480412.57770.005647
2-0.352495-3.66320.000194
3-0.437855-4.55037e-06
4-0.259774-2.69960.004029
50.1293991.34480.090761
60.5246945.45280
70.2124772.20810.014675
8-0.223281-2.32040.011099
9-0.366627-3.81010.000116
10-0.287485-2.98760.00174
110.142841.48440.070302
120.7937918.24930
130.2803052.9130.002175
14-0.307912-3.19990.000903
15-0.379628-3.94527.1e-05
16-0.221835-2.30540.011528
170.027540.28620.387635
180.4325824.49559e-06
190.2666292.77090.003292
20-0.140925-1.46450.072977
21-0.341245-3.54630.00029
22-0.248629-2.58380.005553
230.0650050.67550.250386
240.6170496.41260
250.2945533.06110.001391
26-0.259057-2.69220.004115
27-0.3442-3.5770.000261
28-0.195446-2.03110.022349
29-0.033744-0.35070.363258
300.3278453.40710.000462
310.2821032.93170.002058
32-0.055049-0.57210.284227
33-0.298786-3.10510.001215
34-0.227799-2.36740.009848
35-0.003201-0.03330.486763
360.4202814.36771.4e-05
370.2760342.86860.00248
38-0.174319-1.81160.036415
39-0.296405-3.08030.001311
40-0.178633-1.85640.033061
41-0.073383-0.76260.223675
420.2095932.17820.015785
430.2871732.98440.001757
440.0231040.24010.405352
45-0.240251-2.49680.007022
46-0.212332-2.20660.014729
47-0.044979-0.46740.320564
480.2666532.77110.00329

\begin{tabular}{lllllllll}
\hline
Autocorrelation Function \tabularnewline
Time lag k & ACF(k) & T-STAT & P-value \tabularnewline
1 & 0.248041 & 2.5777 & 0.005647 \tabularnewline
2 & -0.352495 & -3.6632 & 0.000194 \tabularnewline
3 & -0.437855 & -4.5503 & 7e-06 \tabularnewline
4 & -0.259774 & -2.6996 & 0.004029 \tabularnewline
5 & 0.129399 & 1.3448 & 0.090761 \tabularnewline
6 & 0.524694 & 5.4528 & 0 \tabularnewline
7 & 0.212477 & 2.2081 & 0.014675 \tabularnewline
8 & -0.223281 & -2.3204 & 0.011099 \tabularnewline
9 & -0.366627 & -3.8101 & 0.000116 \tabularnewline
10 & -0.287485 & -2.9876 & 0.00174 \tabularnewline
11 & 0.14284 & 1.4844 & 0.070302 \tabularnewline
12 & 0.793791 & 8.2493 & 0 \tabularnewline
13 & 0.280305 & 2.913 & 0.002175 \tabularnewline
14 & -0.307912 & -3.1999 & 0.000903 \tabularnewline
15 & -0.379628 & -3.9452 & 7.1e-05 \tabularnewline
16 & -0.221835 & -2.3054 & 0.011528 \tabularnewline
17 & 0.02754 & 0.2862 & 0.387635 \tabularnewline
18 & 0.432582 & 4.4955 & 9e-06 \tabularnewline
19 & 0.266629 & 2.7709 & 0.003292 \tabularnewline
20 & -0.140925 & -1.4645 & 0.072977 \tabularnewline
21 & -0.341245 & -3.5463 & 0.00029 \tabularnewline
22 & -0.248629 & -2.5838 & 0.005553 \tabularnewline
23 & 0.065005 & 0.6755 & 0.250386 \tabularnewline
24 & 0.617049 & 6.4126 & 0 \tabularnewline
25 & 0.294553 & 3.0611 & 0.001391 \tabularnewline
26 & -0.259057 & -2.6922 & 0.004115 \tabularnewline
27 & -0.3442 & -3.577 & 0.000261 \tabularnewline
28 & -0.195446 & -2.0311 & 0.022349 \tabularnewline
29 & -0.033744 & -0.3507 & 0.363258 \tabularnewline
30 & 0.327845 & 3.4071 & 0.000462 \tabularnewline
31 & 0.282103 & 2.9317 & 0.002058 \tabularnewline
32 & -0.055049 & -0.5721 & 0.284227 \tabularnewline
33 & -0.298786 & -3.1051 & 0.001215 \tabularnewline
34 & -0.227799 & -2.3674 & 0.009848 \tabularnewline
35 & -0.003201 & -0.0333 & 0.486763 \tabularnewline
36 & 0.420281 & 4.3677 & 1.4e-05 \tabularnewline
37 & 0.276034 & 2.8686 & 0.00248 \tabularnewline
38 & -0.174319 & -1.8116 & 0.036415 \tabularnewline
39 & -0.296405 & -3.0803 & 0.001311 \tabularnewline
40 & -0.178633 & -1.8564 & 0.033061 \tabularnewline
41 & -0.073383 & -0.7626 & 0.223675 \tabularnewline
42 & 0.209593 & 2.1782 & 0.015785 \tabularnewline
43 & 0.287173 & 2.9844 & 0.001757 \tabularnewline
44 & 0.023104 & 0.2401 & 0.405352 \tabularnewline
45 & -0.240251 & -2.4968 & 0.007022 \tabularnewline
46 & -0.212332 & -2.2066 & 0.014729 \tabularnewline
47 & -0.044979 & -0.4674 & 0.320564 \tabularnewline
48 & 0.266653 & 2.7711 & 0.00329 \tabularnewline
\hline
\end{tabular}
%Source: https://freestatistics.org/blog/index.php?pk=169268&T=1

[TABLE]
[ROW][C]Autocorrelation Function[/C][/ROW]
[ROW][C]Time lag k[/C][C]ACF(k)[/C][C]T-STAT[/C][C]P-value[/C][/ROW]
[ROW][C]1[/C][C]0.248041[/C][C]2.5777[/C][C]0.005647[/C][/ROW]
[ROW][C]2[/C][C]-0.352495[/C][C]-3.6632[/C][C]0.000194[/C][/ROW]
[ROW][C]3[/C][C]-0.437855[/C][C]-4.5503[/C][C]7e-06[/C][/ROW]
[ROW][C]4[/C][C]-0.259774[/C][C]-2.6996[/C][C]0.004029[/C][/ROW]
[ROW][C]5[/C][C]0.129399[/C][C]1.3448[/C][C]0.090761[/C][/ROW]
[ROW][C]6[/C][C]0.524694[/C][C]5.4528[/C][C]0[/C][/ROW]
[ROW][C]7[/C][C]0.212477[/C][C]2.2081[/C][C]0.014675[/C][/ROW]
[ROW][C]8[/C][C]-0.223281[/C][C]-2.3204[/C][C]0.011099[/C][/ROW]
[ROW][C]9[/C][C]-0.366627[/C][C]-3.8101[/C][C]0.000116[/C][/ROW]
[ROW][C]10[/C][C]-0.287485[/C][C]-2.9876[/C][C]0.00174[/C][/ROW]
[ROW][C]11[/C][C]0.14284[/C][C]1.4844[/C][C]0.070302[/C][/ROW]
[ROW][C]12[/C][C]0.793791[/C][C]8.2493[/C][C]0[/C][/ROW]
[ROW][C]13[/C][C]0.280305[/C][C]2.913[/C][C]0.002175[/C][/ROW]
[ROW][C]14[/C][C]-0.307912[/C][C]-3.1999[/C][C]0.000903[/C][/ROW]
[ROW][C]15[/C][C]-0.379628[/C][C]-3.9452[/C][C]7.1e-05[/C][/ROW]
[ROW][C]16[/C][C]-0.221835[/C][C]-2.3054[/C][C]0.011528[/C][/ROW]
[ROW][C]17[/C][C]0.02754[/C][C]0.2862[/C][C]0.387635[/C][/ROW]
[ROW][C]18[/C][C]0.432582[/C][C]4.4955[/C][C]9e-06[/C][/ROW]
[ROW][C]19[/C][C]0.266629[/C][C]2.7709[/C][C]0.003292[/C][/ROW]
[ROW][C]20[/C][C]-0.140925[/C][C]-1.4645[/C][C]0.072977[/C][/ROW]
[ROW][C]21[/C][C]-0.341245[/C][C]-3.5463[/C][C]0.00029[/C][/ROW]
[ROW][C]22[/C][C]-0.248629[/C][C]-2.5838[/C][C]0.005553[/C][/ROW]
[ROW][C]23[/C][C]0.065005[/C][C]0.6755[/C][C]0.250386[/C][/ROW]
[ROW][C]24[/C][C]0.617049[/C][C]6.4126[/C][C]0[/C][/ROW]
[ROW][C]25[/C][C]0.294553[/C][C]3.0611[/C][C]0.001391[/C][/ROW]
[ROW][C]26[/C][C]-0.259057[/C][C]-2.6922[/C][C]0.004115[/C][/ROW]
[ROW][C]27[/C][C]-0.3442[/C][C]-3.577[/C][C]0.000261[/C][/ROW]
[ROW][C]28[/C][C]-0.195446[/C][C]-2.0311[/C][C]0.022349[/C][/ROW]
[ROW][C]29[/C][C]-0.033744[/C][C]-0.3507[/C][C]0.363258[/C][/ROW]
[ROW][C]30[/C][C]0.327845[/C][C]3.4071[/C][C]0.000462[/C][/ROW]
[ROW][C]31[/C][C]0.282103[/C][C]2.9317[/C][C]0.002058[/C][/ROW]
[ROW][C]32[/C][C]-0.055049[/C][C]-0.5721[/C][C]0.284227[/C][/ROW]
[ROW][C]33[/C][C]-0.298786[/C][C]-3.1051[/C][C]0.001215[/C][/ROW]
[ROW][C]34[/C][C]-0.227799[/C][C]-2.3674[/C][C]0.009848[/C][/ROW]
[ROW][C]35[/C][C]-0.003201[/C][C]-0.0333[/C][C]0.486763[/C][/ROW]
[ROW][C]36[/C][C]0.420281[/C][C]4.3677[/C][C]1.4e-05[/C][/ROW]
[ROW][C]37[/C][C]0.276034[/C][C]2.8686[/C][C]0.00248[/C][/ROW]
[ROW][C]38[/C][C]-0.174319[/C][C]-1.8116[/C][C]0.036415[/C][/ROW]
[ROW][C]39[/C][C]-0.296405[/C][C]-3.0803[/C][C]0.001311[/C][/ROW]
[ROW][C]40[/C][C]-0.178633[/C][C]-1.8564[/C][C]0.033061[/C][/ROW]
[ROW][C]41[/C][C]-0.073383[/C][C]-0.7626[/C][C]0.223675[/C][/ROW]
[ROW][C]42[/C][C]0.209593[/C][C]2.1782[/C][C]0.015785[/C][/ROW]
[ROW][C]43[/C][C]0.287173[/C][C]2.9844[/C][C]0.001757[/C][/ROW]
[ROW][C]44[/C][C]0.023104[/C][C]0.2401[/C][C]0.405352[/C][/ROW]
[ROW][C]45[/C][C]-0.240251[/C][C]-2.4968[/C][C]0.007022[/C][/ROW]
[ROW][C]46[/C][C]-0.212332[/C][C]-2.2066[/C][C]0.014729[/C][/ROW]
[ROW][C]47[/C][C]-0.044979[/C][C]-0.4674[/C][C]0.320564[/C][/ROW]
[ROW][C]48[/C][C]0.266653[/C][C]2.7711[/C][C]0.00329[/C][/ROW]
[/TABLE]
Source: https://freestatistics.org/blog/index.php?pk=169268&T=1

Globally Unique Identifier (entire table): ba.freestatistics.org/blog/index.php?pk=169268&T=1

As an alternative you can also use a QR Code:  

The GUIDs for individual cells are displayed in the table below:

Autocorrelation Function
Time lag kACF(k)T-STATP-value
10.2480412.57770.005647
2-0.352495-3.66320.000194
3-0.437855-4.55037e-06
4-0.259774-2.69960.004029
50.1293991.34480.090761
60.5246945.45280
70.2124772.20810.014675
8-0.223281-2.32040.011099
9-0.366627-3.81010.000116
10-0.287485-2.98760.00174
110.142841.48440.070302
120.7937918.24930
130.2803052.9130.002175
14-0.307912-3.19990.000903
15-0.379628-3.94527.1e-05
16-0.221835-2.30540.011528
170.027540.28620.387635
180.4325824.49559e-06
190.2666292.77090.003292
20-0.140925-1.46450.072977
21-0.341245-3.54630.00029
22-0.248629-2.58380.005553
230.0650050.67550.250386
240.6170496.41260
250.2945533.06110.001391
26-0.259057-2.69220.004115
27-0.3442-3.5770.000261
28-0.195446-2.03110.022349
29-0.033744-0.35070.363258
300.3278453.40710.000462
310.2821032.93170.002058
32-0.055049-0.57210.284227
33-0.298786-3.10510.001215
34-0.227799-2.36740.009848
35-0.003201-0.03330.486763
360.4202814.36771.4e-05
370.2760342.86860.00248
38-0.174319-1.81160.036415
39-0.296405-3.08030.001311
40-0.178633-1.85640.033061
41-0.073383-0.76260.223675
420.2095932.17820.015785
430.2871732.98440.001757
440.0231040.24010.405352
45-0.240251-2.49680.007022
46-0.212332-2.20660.014729
47-0.044979-0.46740.320564
480.2666532.77110.00329


Partial Autocorrelation Function
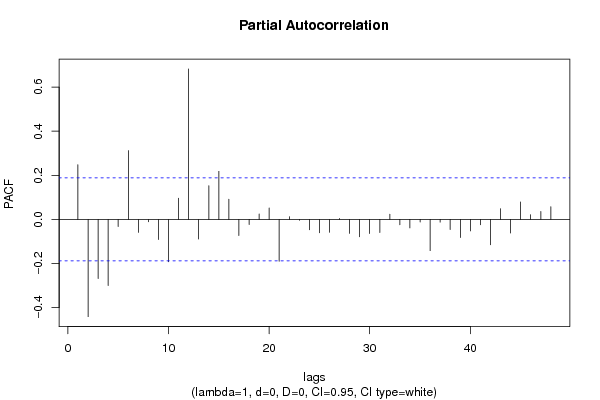
Time lag kPACF(k)T-STATP-value
10.2480412.57770.005647
2-0.441162-4.58476e-06
3-0.267818-2.78320.003177
4-0.299766-3.11530.001177
5-0.032316-0.33580.368823
60.3120333.24270.000788
7-0.058704-0.61010.271547
8-0.010339-0.10750.457316
9-0.090894-0.94460.173485
10-0.192189-1.99730.024154
110.096140.99910.159985
120.6825837.09360
13-0.088604-0.92080.179603
140.1527641.58760.057654
150.2178382.26380.012791
160.0913440.94930.172299
17-0.073197-0.76070.224252
18-0.023011-0.23910.405725
190.0246590.25630.399117
200.0520190.54060.294948
21-0.189617-1.97060.025667
220.0121750.12650.449775
23-0.004057-0.04220.483224
24-0.046912-0.48750.313438
25-0.060469-0.62840.26553
26-0.058018-0.60290.273905
270.004220.04390.48255
28-0.063437-0.65930.255566
29-0.078629-0.81710.207825
30-0.063778-0.66280.254435
31-0.059346-0.61670.269351
320.0233820.2430.404236
33-0.024117-0.25060.401288
34-0.038406-0.39910.345292
35-0.011488-0.11940.452595
36-0.141631-1.47190.071981
37-0.012512-0.130.448395
38-0.045707-0.4750.317871
39-0.082208-0.85430.197407
40-0.052175-0.54220.294394
41-0.024415-0.25370.400092
42-0.115277-1.1980.116771
430.0486550.50560.307071
44-0.061909-0.64340.26067
450.078870.81960.207112
460.0212120.22040.412971
470.0358250.37230.355197
480.0571340.59380.276959

\begin{tabular}{lllllllll}
\hline
Partial Autocorrelation Function \tabularnewline
Time lag k & PACF(k) & T-STAT & P-value \tabularnewline
1 & 0.248041 & 2.5777 & 0.005647 \tabularnewline
2 & -0.441162 & -4.5847 & 6e-06 \tabularnewline
3 & -0.267818 & -2.7832 & 0.003177 \tabularnewline
4 & -0.299766 & -3.1153 & 0.001177 \tabularnewline
5 & -0.032316 & -0.3358 & 0.368823 \tabularnewline
6 & 0.312033 & 3.2427 & 0.000788 \tabularnewline
7 & -0.058704 & -0.6101 & 0.271547 \tabularnewline
8 & -0.010339 & -0.1075 & 0.457316 \tabularnewline
9 & -0.090894 & -0.9446 & 0.173485 \tabularnewline
10 & -0.192189 & -1.9973 & 0.024154 \tabularnewline
11 & 0.09614 & 0.9991 & 0.159985 \tabularnewline
12 & 0.682583 & 7.0936 & 0 \tabularnewline
13 & -0.088604 & -0.9208 & 0.179603 \tabularnewline
14 & 0.152764 & 1.5876 & 0.057654 \tabularnewline
15 & 0.217838 & 2.2638 & 0.012791 \tabularnewline
16 & 0.091344 & 0.9493 & 0.172299 \tabularnewline
17 & -0.073197 & -0.7607 & 0.224252 \tabularnewline
18 & -0.023011 & -0.2391 & 0.405725 \tabularnewline
19 & 0.024659 & 0.2563 & 0.399117 \tabularnewline
20 & 0.052019 & 0.5406 & 0.294948 \tabularnewline
21 & -0.189617 & -1.9706 & 0.025667 \tabularnewline
22 & 0.012175 & 0.1265 & 0.449775 \tabularnewline
23 & -0.004057 & -0.0422 & 0.483224 \tabularnewline
24 & -0.046912 & -0.4875 & 0.313438 \tabularnewline
25 & -0.060469 & -0.6284 & 0.26553 \tabularnewline
26 & -0.058018 & -0.6029 & 0.273905 \tabularnewline
27 & 0.00422 & 0.0439 & 0.48255 \tabularnewline
28 & -0.063437 & -0.6593 & 0.255566 \tabularnewline
29 & -0.078629 & -0.8171 & 0.207825 \tabularnewline
30 & -0.063778 & -0.6628 & 0.254435 \tabularnewline
31 & -0.059346 & -0.6167 & 0.269351 \tabularnewline
32 & 0.023382 & 0.243 & 0.404236 \tabularnewline
33 & -0.024117 & -0.2506 & 0.401288 \tabularnewline
34 & -0.038406 & -0.3991 & 0.345292 \tabularnewline
35 & -0.011488 & -0.1194 & 0.452595 \tabularnewline
36 & -0.141631 & -1.4719 & 0.071981 \tabularnewline
37 & -0.012512 & -0.13 & 0.448395 \tabularnewline
38 & -0.045707 & -0.475 & 0.317871 \tabularnewline
39 & -0.082208 & -0.8543 & 0.197407 \tabularnewline
40 & -0.052175 & -0.5422 & 0.294394 \tabularnewline
41 & -0.024415 & -0.2537 & 0.400092 \tabularnewline
42 & -0.115277 & -1.198 & 0.116771 \tabularnewline
43 & 0.048655 & 0.5056 & 0.307071 \tabularnewline
44 & -0.061909 & -0.6434 & 0.26067 \tabularnewline
45 & 0.07887 & 0.8196 & 0.207112 \tabularnewline
46 & 0.021212 & 0.2204 & 0.412971 \tabularnewline
47 & 0.035825 & 0.3723 & 0.355197 \tabularnewline
48 & 0.057134 & 0.5938 & 0.276959 \tabularnewline
\hline
\end{tabular}
%Source: https://freestatistics.org/blog/index.php?pk=169268&T=2

[TABLE]
[ROW][C]Partial Autocorrelation Function[/C][/ROW]
[ROW][C]Time lag k[/C][C]PACF(k)[/C][C]T-STAT[/C][C]P-value[/C][/ROW]
[ROW][C]1[/C][C]0.248041[/C][C]2.5777[/C][C]0.005647[/C][/ROW]
[ROW][C]2[/C][C]-0.441162[/C][C]-4.5847[/C][C]6e-06[/C][/ROW]
[ROW][C]3[/C][C]-0.267818[/C][C]-2.7832[/C][C]0.003177[/C][/ROW]
[ROW][C]4[/C][C]-0.299766[/C][C]-3.1153[/C][C]0.001177[/C][/ROW]
[ROW][C]5[/C][C]-0.032316[/C][C]-0.3358[/C][C]0.368823[/C][/ROW]
[ROW][C]6[/C][C]0.312033[/C][C]3.2427[/C][C]0.000788[/C][/ROW]
[ROW][C]7[/C][C]-0.058704[/C][C]-0.6101[/C][C]0.271547[/C][/ROW]
[ROW][C]8[/C][C]-0.010339[/C][C]-0.1075[/C][C]0.457316[/C][/ROW]
[ROW][C]9[/C][C]-0.090894[/C][C]-0.9446[/C][C]0.173485[/C][/ROW]
[ROW][C]10[/C][C]-0.192189[/C][C]-1.9973[/C][C]0.024154[/C][/ROW]
[ROW][C]11[/C][C]0.09614[/C][C]0.9991[/C][C]0.159985[/C][/ROW]
[ROW][C]12[/C][C]0.682583[/C][C]7.0936[/C][C]0[/C][/ROW]
[ROW][C]13[/C][C]-0.088604[/C][C]-0.9208[/C][C]0.179603[/C][/ROW]
[ROW][C]14[/C][C]0.152764[/C][C]1.5876[/C][C]0.057654[/C][/ROW]
[ROW][C]15[/C][C]0.217838[/C][C]2.2638[/C][C]0.012791[/C][/ROW]
[ROW][C]16[/C][C]0.091344[/C][C]0.9493[/C][C]0.172299[/C][/ROW]
[ROW][C]17[/C][C]-0.073197[/C][C]-0.7607[/C][C]0.224252[/C][/ROW]
[ROW][C]18[/C][C]-0.023011[/C][C]-0.2391[/C][C]0.405725[/C][/ROW]
[ROW][C]19[/C][C]0.024659[/C][C]0.2563[/C][C]0.399117[/C][/ROW]
[ROW][C]20[/C][C]0.052019[/C][C]0.5406[/C][C]0.294948[/C][/ROW]
[ROW][C]21[/C][C]-0.189617[/C][C]-1.9706[/C][C]0.025667[/C][/ROW]
[ROW][C]22[/C][C]0.012175[/C][C]0.1265[/C][C]0.449775[/C][/ROW]
[ROW][C]23[/C][C]-0.004057[/C][C]-0.0422[/C][C]0.483224[/C][/ROW]
[ROW][C]24[/C][C]-0.046912[/C][C]-0.4875[/C][C]0.313438[/C][/ROW]
[ROW][C]25[/C][C]-0.060469[/C][C]-0.6284[/C][C]0.26553[/C][/ROW]
[ROW][C]26[/C][C]-0.058018[/C][C]-0.6029[/C][C]0.273905[/C][/ROW]
[ROW][C]27[/C][C]0.00422[/C][C]0.0439[/C][C]0.48255[/C][/ROW]
[ROW][C]28[/C][C]-0.063437[/C][C]-0.6593[/C][C]0.255566[/C][/ROW]
[ROW][C]29[/C][C]-0.078629[/C][C]-0.8171[/C][C]0.207825[/C][/ROW]
[ROW][C]30[/C][C]-0.063778[/C][C]-0.6628[/C][C]0.254435[/C][/ROW]
[ROW][C]31[/C][C]-0.059346[/C][C]-0.6167[/C][C]0.269351[/C][/ROW]
[ROW][C]32[/C][C]0.023382[/C][C]0.243[/C][C]0.404236[/C][/ROW]
[ROW][C]33[/C][C]-0.024117[/C][C]-0.2506[/C][C]0.401288[/C][/ROW]
[ROW][C]34[/C][C]-0.038406[/C][C]-0.3991[/C][C]0.345292[/C][/ROW]
[ROW][C]35[/C][C]-0.011488[/C][C]-0.1194[/C][C]0.452595[/C][/ROW]
[ROW][C]36[/C][C]-0.141631[/C][C]-1.4719[/C][C]0.071981[/C][/ROW]
[ROW][C]37[/C][C]-0.012512[/C][C]-0.13[/C][C]0.448395[/C][/ROW]
[ROW][C]38[/C][C]-0.045707[/C][C]-0.475[/C][C]0.317871[/C][/ROW]
[ROW][C]39[/C][C]-0.082208[/C][C]-0.8543[/C][C]0.197407[/C][/ROW]
[ROW][C]40[/C][C]-0.052175[/C][C]-0.5422[/C][C]0.294394[/C][/ROW]
[ROW][C]41[/C][C]-0.024415[/C][C]-0.2537[/C][C]0.400092[/C][/ROW]
[ROW][C]42[/C][C]-0.115277[/C][C]-1.198[/C][C]0.116771[/C][/ROW]
[ROW][C]43[/C][C]0.048655[/C][C]0.5056[/C][C]0.307071[/C][/ROW]
[ROW][C]44[/C][C]-0.061909[/C][C]-0.6434[/C][C]0.26067[/C][/ROW]
[ROW][C]45[/C][C]0.07887[/C][C]0.8196[/C][C]0.207112[/C][/ROW]
[ROW][C]46[/C][C]0.021212[/C][C]0.2204[/C][C]0.412971[/C][/ROW]
[ROW][C]47[/C][C]0.035825[/C][C]0.3723[/C][C]0.355197[/C][/ROW]
[ROW][C]48[/C][C]0.057134[/C][C]0.5938[/C][C]0.276959[/C][/ROW]
[/TABLE]
Source: https://freestatistics.org/blog/index.php?pk=169268&T=2

Globally Unique Identifier (entire table): ba.freestatistics.org/blog/index.php?pk=169268&T=2

As an alternative you can also use a QR Code:  

The GUIDs for individual cells are displayed in the table below:

Partial Autocorrelation Function
Time lag kPACF(k)T-STATP-value
10.2480412.57770.005647
2-0.441162-4.58476e-06
3-0.267818-2.78320.003177
4-0.299766-3.11530.001177
5-0.032316-0.33580.368823
60.3120333.24270.000788
7-0.058704-0.61010.271547
8-0.010339-0.10750.457316
9-0.090894-0.94460.173485
10-0.192189-1.99730.024154
110.096140.99910.159985
120.6825837.09360
13-0.088604-0.92080.179603
140.1527641.58760.057654
150.2178382.26380.012791
160.0913440.94930.172299
17-0.073197-0.76070.224252
18-0.023011-0.23910.405725
190.0246590.25630.399117
200.0520190.54060.294948
21-0.189617-1.97060.025667
220.0121750.12650.449775
23-0.004057-0.04220.483224
24-0.046912-0.48750.313438
25-0.060469-0.62840.26553
26-0.058018-0.60290.273905
270.004220.04390.48255
28-0.063437-0.65930.255566
29-0.078629-0.81710.207825
30-0.063778-0.66280.254435
31-0.059346-0.61670.269351
320.0233820.2430.404236
33-0.024117-0.25060.401288
34-0.038406-0.39910.345292
35-0.011488-0.11940.452595
36-0.141631-1.47190.071981
37-0.012512-0.130.448395
38-0.045707-0.4750.317871
39-0.082208-0.85430.197407
40-0.052175-0.54220.294394
41-0.024415-0.25370.400092
42-0.115277-1.1980.116771
430.0486550.50560.307071
44-0.061909-0.64340.26067
450.078870.81960.207112
460.0212120.22040.412971
470.0358250.37230.355197
480.0571340.59380.276959


Parameters (Session):
par1 = 48 ; par2 = 1 ; par3 = 0 ; par4 = 0 ; par5 = 12 ; par6 = White Noise ; par7 = 0.95 ;
Parameters (R input):
par1 = 48 ; par2 = 1 ; par3 = 0 ; par4 = 0 ; par5 = 12 ; par6 = White Noise ; par7 = 0.95 ; par8 = ;
R code (references can be found in the software module):
if (par1 == 'Default') {
par1 = 10*log10(length(x))
} else {
par1 <- as.numeric(par1)
}
par2 <- as.numeric(par2)
par3 <- as.numeric(par3)
par4 <- as.numeric(par4)
par5 <- as.numeric(par5)
if (par6 == 'White Noise') par6 <- 'white' else par6 <- 'ma'
par7 <- as.numeric(par7)
if (par8 != '') par8 <- as.numeric(par8)
ox <- x
if (par8 == '') {
if (par2 == 0) {
x <- log(x)
} else {
x <- (x ^ par2 - 1) / par2
}
} else {
x <- log(x,base=par8)
}
if (par3 > 0) x <- diff(x,lag=1,difference=par3)
if (par4 > 0) x <- diff(x,lag=par5,difference=par4)
bitmap(file='picts.png')
op <- par(mfrow=c(2,1))
plot(ox,type='l',main='Original Time Series',xlab='time',ylab='value')
if (par8=='') {
mytitle <- paste('Working Time Series (lambda=',par2,', d=',par3,', D=',par4,')',sep='')
mysub <- paste('(lambda=',par2,', d=',par3,', D=',par4,', CI=', par7, ', CI type=',par6,')',sep='')
} else {
mytitle <- paste('Working Time Series (base=',par8,', d=',par3,', D=',par4,')',sep='')
mysub <- paste('(base=',par8,', d=',par3,', D=',par4,', CI=', par7, ', CI type=',par6,')',sep='')
}
plot(x,type='l', main=mytitle,xlab='time',ylab='value')
par(op)
dev.off()
bitmap(file='pic1.png')
racf <- acf(x, par1, main='Autocorrelation', xlab='time lag', ylab='ACF', ci.type=par6, ci=par7, sub=mysub)
dev.off()
bitmap(file='pic2.png')
rpacf <- pacf(x,par1,main='Partial Autocorrelation',xlab='lags',ylab='PACF',sub=mysub)
dev.off()
(myacf <- c(racf$acf))
(mypacf <- c(rpacf$acf))
lengthx <- length(x)
sqrtn <- sqrt(lengthx)
load(file='createtable')
a<-table.start()
a<-table.row.start(a)
a<-table.element(a,'Autocorrelation Function',4,TRUE)
a<-table.row.end(a)
a<-table.row.start(a)
a<-table.element(a,'Time lag k',header=TRUE)
a<-table.element(a,hyperlink('basics.htm','ACF(k)','click here for more information about the Autocorrelation Function'),header=TRUE)
a<-table.element(a,'T-STAT',header=TRUE)
a<-table.element(a,'P-value',header=TRUE)
a<-table.row.end(a)
for (i in 2:(par1+1)) {
a<-table.row.start(a)
a<-table.element(a,i-1,header=TRUE)
a<-table.element(a,round(myacf[i],6))
mytstat <- myacf[i]*sqrtn
a<-table.element(a,round(mytstat,4))
a<-table.element(a,round(1-pt(abs(mytstat),lengthx),6))
a<-table.row.end(a)
}
a<-table.end(a)
table.save(a,file='mytable.tab')
a<-table.start()
a<-table.row.start(a)
a<-table.element(a,'Partial Autocorrelation Function',4,TRUE)
a<-table.row.end(a)
a<-table.row.start(a)
a<-table.element(a,'Time lag k',header=TRUE)
a<-table.element(a,hyperlink('basics.htm','PACF(k)','click here for more information about the Partial Autocorrelation Function'),header=TRUE)
a<-table.element(a,'T-STAT',header=TRUE)
a<-table.element(a,'P-value',header=TRUE)
a<-table.row.end(a)
for (i in 1:par1) {
a<-table.row.start(a)
a<-table.element(a,i,header=TRUE)
a<-table.element(a,round(mypacf[i],6))
mytstat <- mypacf[i]*sqrtn
a<-table.element(a,round(mytstat,4))
a<-table.element(a,round(1-pt(abs(mytstat),lengthx),6))
a<-table.row.end(a)
}
a<-table.end(a)
table.save(a,file='mytable1.tab')