Free Statistics

of Irreproducible Research!

Author's title

Author*Unverified author*
R Software Modulerwasp_autocorrelation.wasp
Title produced by software(Partial) Autocorrelation Function
Date of computationSun, 12 Aug 2012 10:00:51 -0400
Cite this page as followsStatistical Computations at FreeStatistics.org, Office for Research Development and Education, URL https://freestatistics.org/blog/index.php?v=date/2012/Aug/12/t1344780082ae1w11k4lwek3cb.htm/, Retrieved Sun, 28 Apr 2024 12:52:13 +0000
Statistical Computations at FreeStatistics.org, Office for Research Development and Education, URL https://freestatistics.org/blog/index.php?pk=169246, Retrieved Sun, 28 Apr 2024 12:52:13 +0000
QR Codes:

Original text written by user:
IsPrivate?No (this computation is public)
User-defined keywordsVan der Smissen britt
Estimated Impact138
Family? (F = Feedback message, R = changed R code, M = changed R Module, P = changed Parameters, D = changed Data)
-       [(Partial) Autocorrelation Function] [Tijdreeks B-Stap 17] [2012-08-12 14:00:51] [b3616d670e39c9c081ac68ec1f5d1a32] [Current]
Feedback Forum

Post a new message
Dataseries X:
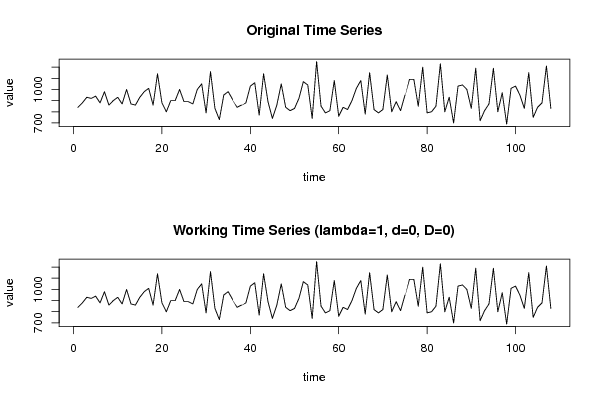
840
880
930
920
940
880
980
860
900
930
870
1000
870
860
930
980
1010
860
1140
880
800
900
900
1000
890
890
870
1000
1050
790
1160
830
730
950
980
910
840
860
880
1030
1060
770
1140
890
740
860
1050
840
810
830
920
1070
1040
740
1250
850
790
810
1080
760
840
820
900
1010
1080
780
1150
820
790
820
1130
800
890
810
950
1090
1090
850
1200
790
800
850
1230
800
930
700
1030
1040
1000
830
1190
720
810
870
1190
800
970
690
1010
1030
950
830
1150
750
840
880
1210
830


Summary of computational transaction
Raw Inputview raw input (R code)
Raw Outputview raw output of R engine
Computing time1 seconds
R Server'Gwilym Jenkins' @ jenkins.wessa.net

\begin{tabular}{lllllllll}
\hline
Summary of computational transaction \tabularnewline
Raw Input & view raw input (R code)  \tabularnewline
Raw Output & view raw output of R engine  \tabularnewline
Computing time & 1 seconds \tabularnewline
R Server & 'Gwilym Jenkins' @ jenkins.wessa.net \tabularnewline
\hline
\end{tabular}
%Source: https://freestatistics.org/blog/index.php?pk=169246&T=0

[TABLE]
[ROW][C]Summary of computational transaction[/C][/ROW]
[ROW][C]Raw Input[/C][C]view raw input (R code) [/C][/ROW]
[ROW][C]Raw Output[/C][C]view raw output of R engine [/C][/ROW]
[ROW][C]Computing time[/C][C]1 seconds[/C][/ROW]
[ROW][C]R Server[/C][C]'Gwilym Jenkins' @ jenkins.wessa.net[/C][/ROW]
[/TABLE]
Source: https://freestatistics.org/blog/index.php?pk=169246&T=0

Globally Unique Identifier (entire table): ba.freestatistics.org/blog/index.php?pk=169246&T=0

As an alternative you can also use a QR Code:  

The GUIDs for individual cells are displayed in the table below:

Summary of computational transaction
Raw Inputview raw input (R code)
Raw Outputview raw output of R engine
Computing time1 seconds
R Server'Gwilym Jenkins' @ jenkins.wessa.net


Autocorrelation Function
Time lag kACF(k)T-STATP-value
1-0.303089-3.14980.001057
2-0.081479-0.84680.199502
3-0.149562-1.55430.06152
40.2419492.51440.006699
5-0.279415-2.90380.002236
60.1942182.01840.023015
7-0.216977-2.25490.013078
80.1939342.01540.023172
9-0.157609-1.63790.052174
10-0.064173-0.66690.253127
11-0.243052-2.52590.006496
120.8518288.85250
13-0.288995-3.00330.001659
14-0.075946-0.78930.215847
15-0.139587-1.45060.074891
160.2206782.29340.011882
17-0.259639-2.69830.004045
180.1410721.46610.072769
19-0.168544-1.75160.041344
200.1531691.59180.057178
21-0.117057-1.21650.113225
22-0.083711-0.870.193127
23-0.153328-1.59340.056993
240.6817867.08530
25-0.256128-2.66180.00448
26-0.054991-0.57150.28443
27-0.104476-1.08580.140003
280.1941242.01740.023067
29-0.222373-2.3110.011367
300.1071481.11350.13398
31-0.114148-1.18630.119061
320.1189971.23670.109449
33-0.084353-0.87660.191319
34-0.105237-1.09370.13827
35-0.072638-0.75490.225982
360.5188885.39240
37-0.212451-2.20790.014684
38-0.050583-0.52570.300095
39-0.082609-0.85850.196258
400.1654951.71990.04416
41-0.182745-1.89910.030107
420.085910.89280.186975
43-0.084028-0.87320.192234
440.0793040.82410.205836
45-0.054803-0.56950.285091
46-0.111229-1.15590.125132
47-0.014456-0.15020.440433
480.375823.90568.2e-05

\begin{tabular}{lllllllll}
\hline
Autocorrelation Function \tabularnewline
Time lag k & ACF(k) & T-STAT & P-value \tabularnewline
1 & -0.303089 & -3.1498 & 0.001057 \tabularnewline
2 & -0.081479 & -0.8468 & 0.199502 \tabularnewline
3 & -0.149562 & -1.5543 & 0.06152 \tabularnewline
4 & 0.241949 & 2.5144 & 0.006699 \tabularnewline
5 & -0.279415 & -2.9038 & 0.002236 \tabularnewline
6 & 0.194218 & 2.0184 & 0.023015 \tabularnewline
7 & -0.216977 & -2.2549 & 0.013078 \tabularnewline
8 & 0.193934 & 2.0154 & 0.023172 \tabularnewline
9 & -0.157609 & -1.6379 & 0.052174 \tabularnewline
10 & -0.064173 & -0.6669 & 0.253127 \tabularnewline
11 & -0.243052 & -2.5259 & 0.006496 \tabularnewline
12 & 0.851828 & 8.8525 & 0 \tabularnewline
13 & -0.288995 & -3.0033 & 0.001659 \tabularnewline
14 & -0.075946 & -0.7893 & 0.215847 \tabularnewline
15 & -0.139587 & -1.4506 & 0.074891 \tabularnewline
16 & 0.220678 & 2.2934 & 0.011882 \tabularnewline
17 & -0.259639 & -2.6983 & 0.004045 \tabularnewline
18 & 0.141072 & 1.4661 & 0.072769 \tabularnewline
19 & -0.168544 & -1.7516 & 0.041344 \tabularnewline
20 & 0.153169 & 1.5918 & 0.057178 \tabularnewline
21 & -0.117057 & -1.2165 & 0.113225 \tabularnewline
22 & -0.083711 & -0.87 & 0.193127 \tabularnewline
23 & -0.153328 & -1.5934 & 0.056993 \tabularnewline
24 & 0.681786 & 7.0853 & 0 \tabularnewline
25 & -0.256128 & -2.6618 & 0.00448 \tabularnewline
26 & -0.054991 & -0.5715 & 0.28443 \tabularnewline
27 & -0.104476 & -1.0858 & 0.140003 \tabularnewline
28 & 0.194124 & 2.0174 & 0.023067 \tabularnewline
29 & -0.222373 & -2.311 & 0.011367 \tabularnewline
30 & 0.107148 & 1.1135 & 0.13398 \tabularnewline
31 & -0.114148 & -1.1863 & 0.119061 \tabularnewline
32 & 0.118997 & 1.2367 & 0.109449 \tabularnewline
33 & -0.084353 & -0.8766 & 0.191319 \tabularnewline
34 & -0.105237 & -1.0937 & 0.13827 \tabularnewline
35 & -0.072638 & -0.7549 & 0.225982 \tabularnewline
36 & 0.518888 & 5.3924 & 0 \tabularnewline
37 & -0.212451 & -2.2079 & 0.014684 \tabularnewline
38 & -0.050583 & -0.5257 & 0.300095 \tabularnewline
39 & -0.082609 & -0.8585 & 0.196258 \tabularnewline
40 & 0.165495 & 1.7199 & 0.04416 \tabularnewline
41 & -0.182745 & -1.8991 & 0.030107 \tabularnewline
42 & 0.08591 & 0.8928 & 0.186975 \tabularnewline
43 & -0.084028 & -0.8732 & 0.192234 \tabularnewline
44 & 0.079304 & 0.8241 & 0.205836 \tabularnewline
45 & -0.054803 & -0.5695 & 0.285091 \tabularnewline
46 & -0.111229 & -1.1559 & 0.125132 \tabularnewline
47 & -0.014456 & -0.1502 & 0.440433 \tabularnewline
48 & 0.37582 & 3.9056 & 8.2e-05 \tabularnewline
\hline
\end{tabular}
%Source: https://freestatistics.org/blog/index.php?pk=169246&T=1

[TABLE]
[ROW][C]Autocorrelation Function[/C][/ROW]
[ROW][C]Time lag k[/C][C]ACF(k)[/C][C]T-STAT[/C][C]P-value[/C][/ROW]
[ROW][C]1[/C][C]-0.303089[/C][C]-3.1498[/C][C]0.001057[/C][/ROW]
[ROW][C]2[/C][C]-0.081479[/C][C]-0.8468[/C][C]0.199502[/C][/ROW]
[ROW][C]3[/C][C]-0.149562[/C][C]-1.5543[/C][C]0.06152[/C][/ROW]
[ROW][C]4[/C][C]0.241949[/C][C]2.5144[/C][C]0.006699[/C][/ROW]
[ROW][C]5[/C][C]-0.279415[/C][C]-2.9038[/C][C]0.002236[/C][/ROW]
[ROW][C]6[/C][C]0.194218[/C][C]2.0184[/C][C]0.023015[/C][/ROW]
[ROW][C]7[/C][C]-0.216977[/C][C]-2.2549[/C][C]0.013078[/C][/ROW]
[ROW][C]8[/C][C]0.193934[/C][C]2.0154[/C][C]0.023172[/C][/ROW]
[ROW][C]9[/C][C]-0.157609[/C][C]-1.6379[/C][C]0.052174[/C][/ROW]
[ROW][C]10[/C][C]-0.064173[/C][C]-0.6669[/C][C]0.253127[/C][/ROW]
[ROW][C]11[/C][C]-0.243052[/C][C]-2.5259[/C][C]0.006496[/C][/ROW]
[ROW][C]12[/C][C]0.851828[/C][C]8.8525[/C][C]0[/C][/ROW]
[ROW][C]13[/C][C]-0.288995[/C][C]-3.0033[/C][C]0.001659[/C][/ROW]
[ROW][C]14[/C][C]-0.075946[/C][C]-0.7893[/C][C]0.215847[/C][/ROW]
[ROW][C]15[/C][C]-0.139587[/C][C]-1.4506[/C][C]0.074891[/C][/ROW]
[ROW][C]16[/C][C]0.220678[/C][C]2.2934[/C][C]0.011882[/C][/ROW]
[ROW][C]17[/C][C]-0.259639[/C][C]-2.6983[/C][C]0.004045[/C][/ROW]
[ROW][C]18[/C][C]0.141072[/C][C]1.4661[/C][C]0.072769[/C][/ROW]
[ROW][C]19[/C][C]-0.168544[/C][C]-1.7516[/C][C]0.041344[/C][/ROW]
[ROW][C]20[/C][C]0.153169[/C][C]1.5918[/C][C]0.057178[/C][/ROW]
[ROW][C]21[/C][C]-0.117057[/C][C]-1.2165[/C][C]0.113225[/C][/ROW]
[ROW][C]22[/C][C]-0.083711[/C][C]-0.87[/C][C]0.193127[/C][/ROW]
[ROW][C]23[/C][C]-0.153328[/C][C]-1.5934[/C][C]0.056993[/C][/ROW]
[ROW][C]24[/C][C]0.681786[/C][C]7.0853[/C][C]0[/C][/ROW]
[ROW][C]25[/C][C]-0.256128[/C][C]-2.6618[/C][C]0.00448[/C][/ROW]
[ROW][C]26[/C][C]-0.054991[/C][C]-0.5715[/C][C]0.28443[/C][/ROW]
[ROW][C]27[/C][C]-0.104476[/C][C]-1.0858[/C][C]0.140003[/C][/ROW]
[ROW][C]28[/C][C]0.194124[/C][C]2.0174[/C][C]0.023067[/C][/ROW]
[ROW][C]29[/C][C]-0.222373[/C][C]-2.311[/C][C]0.011367[/C][/ROW]
[ROW][C]30[/C][C]0.107148[/C][C]1.1135[/C][C]0.13398[/C][/ROW]
[ROW][C]31[/C][C]-0.114148[/C][C]-1.1863[/C][C]0.119061[/C][/ROW]
[ROW][C]32[/C][C]0.118997[/C][C]1.2367[/C][C]0.109449[/C][/ROW]
[ROW][C]33[/C][C]-0.084353[/C][C]-0.8766[/C][C]0.191319[/C][/ROW]
[ROW][C]34[/C][C]-0.105237[/C][C]-1.0937[/C][C]0.13827[/C][/ROW]
[ROW][C]35[/C][C]-0.072638[/C][C]-0.7549[/C][C]0.225982[/C][/ROW]
[ROW][C]36[/C][C]0.518888[/C][C]5.3924[/C][C]0[/C][/ROW]
[ROW][C]37[/C][C]-0.212451[/C][C]-2.2079[/C][C]0.014684[/C][/ROW]
[ROW][C]38[/C][C]-0.050583[/C][C]-0.5257[/C][C]0.300095[/C][/ROW]
[ROW][C]39[/C][C]-0.082609[/C][C]-0.8585[/C][C]0.196258[/C][/ROW]
[ROW][C]40[/C][C]0.165495[/C][C]1.7199[/C][C]0.04416[/C][/ROW]
[ROW][C]41[/C][C]-0.182745[/C][C]-1.8991[/C][C]0.030107[/C][/ROW]
[ROW][C]42[/C][C]0.08591[/C][C]0.8928[/C][C]0.186975[/C][/ROW]
[ROW][C]43[/C][C]-0.084028[/C][C]-0.8732[/C][C]0.192234[/C][/ROW]
[ROW][C]44[/C][C]0.079304[/C][C]0.8241[/C][C]0.205836[/C][/ROW]
[ROW][C]45[/C][C]-0.054803[/C][C]-0.5695[/C][C]0.285091[/C][/ROW]
[ROW][C]46[/C][C]-0.111229[/C][C]-1.1559[/C][C]0.125132[/C][/ROW]
[ROW][C]47[/C][C]-0.014456[/C][C]-0.1502[/C][C]0.440433[/C][/ROW]
[ROW][C]48[/C][C]0.37582[/C][C]3.9056[/C][C]8.2e-05[/C][/ROW]
[/TABLE]
Source: https://freestatistics.org/blog/index.php?pk=169246&T=1

Globally Unique Identifier (entire table): ba.freestatistics.org/blog/index.php?pk=169246&T=1

As an alternative you can also use a QR Code:  

The GUIDs for individual cells are displayed in the table below:

Autocorrelation Function
Time lag kACF(k)T-STATP-value
1-0.303089-3.14980.001057
2-0.081479-0.84680.199502
3-0.149562-1.55430.06152
40.2419492.51440.006699
5-0.279415-2.90380.002236
60.1942182.01840.023015
7-0.216977-2.25490.013078
80.1939342.01540.023172
9-0.157609-1.63790.052174
10-0.064173-0.66690.253127
11-0.243052-2.52590.006496
120.8518288.85250
13-0.288995-3.00330.001659
14-0.075946-0.78930.215847
15-0.139587-1.45060.074891
160.2206782.29340.011882
17-0.259639-2.69830.004045
180.1410721.46610.072769
19-0.168544-1.75160.041344
200.1531691.59180.057178
21-0.117057-1.21650.113225
22-0.083711-0.870.193127
23-0.153328-1.59340.056993
240.6817867.08530
25-0.256128-2.66180.00448
26-0.054991-0.57150.28443
27-0.104476-1.08580.140003
280.1941242.01740.023067
29-0.222373-2.3110.011367
300.1071481.11350.13398
31-0.114148-1.18630.119061
320.1189971.23670.109449
33-0.084353-0.87660.191319
34-0.105237-1.09370.13827
35-0.072638-0.75490.225982
360.5188885.39240
37-0.212451-2.20790.014684
38-0.050583-0.52570.300095
39-0.082609-0.85850.196258
400.1654951.71990.04416
41-0.182745-1.89910.030107
420.085910.89280.186975
43-0.084028-0.87320.192234
440.0793040.82410.205836
45-0.054803-0.56950.285091
46-0.111229-1.15590.125132
47-0.014456-0.15020.440433
480.375823.90568.2e-05


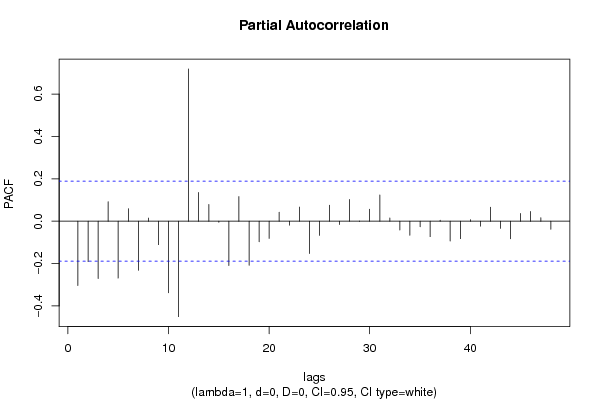
Partial Autocorrelation Function
Time lag kPACF(k)T-STATP-value
1-0.303089-3.14980.001057
2-0.190877-1.98360.024916
3-0.270641-2.81260.00292
40.0921130.95730.170286
5-0.26843-2.78960.00312
60.0585110.60810.272209
7-0.231763-2.40860.008854
80.0147190.1530.439357
9-0.110567-1.1490.126537
10-0.337895-3.51150.000326
11-0.450367-4.68044e-06
120.7185087.46690
130.1357311.41060.080625
140.0791580.82260.206263
15-0.004796-0.04980.480169
16-0.20892-2.17120.016054
170.116071.20620.115182
18-0.207709-2.15860.016549
19-0.09662-1.00410.158786
20-0.081186-0.84370.200349
210.0427430.44420.328893
22-0.018664-0.1940.423286
230.0666870.6930.244888
24-0.152782-1.58780.057633
25-0.066884-0.69510.24425
260.0755030.78460.21719
27-0.015188-0.15780.437439
280.1027151.06740.144075
29-0.001002-0.01040.495857
300.0562250.58430.280117
310.1236631.28510.100746
320.0154020.16010.436565
33-0.041849-0.43490.332248
34-0.06606-0.68650.246931
35-0.026559-0.2760.391534
36-0.072841-0.7570.225352
370.0047950.04980.480174
38-0.093029-0.96680.167906
39-0.082241-0.85470.197311
400.0073240.07610.469734
41-0.023277-0.24190.404658
420.0662260.68820.24639
43-0.033919-0.35250.362577
44-0.082785-0.86030.195757
450.0367930.38240.35147
460.046110.47920.316388
470.0167420.1740.431099
48-0.038068-0.39560.346585

\begin{tabular}{lllllllll}
\hline
Partial Autocorrelation Function \tabularnewline
Time lag k & PACF(k) & T-STAT & P-value \tabularnewline
1 & -0.303089 & -3.1498 & 0.001057 \tabularnewline
2 & -0.190877 & -1.9836 & 0.024916 \tabularnewline
3 & -0.270641 & -2.8126 & 0.00292 \tabularnewline
4 & 0.092113 & 0.9573 & 0.170286 \tabularnewline
5 & -0.26843 & -2.7896 & 0.00312 \tabularnewline
6 & 0.058511 & 0.6081 & 0.272209 \tabularnewline
7 & -0.231763 & -2.4086 & 0.008854 \tabularnewline
8 & 0.014719 & 0.153 & 0.439357 \tabularnewline
9 & -0.110567 & -1.149 & 0.126537 \tabularnewline
10 & -0.337895 & -3.5115 & 0.000326 \tabularnewline
11 & -0.450367 & -4.6804 & 4e-06 \tabularnewline
12 & 0.718508 & 7.4669 & 0 \tabularnewline
13 & 0.135731 & 1.4106 & 0.080625 \tabularnewline
14 & 0.079158 & 0.8226 & 0.206263 \tabularnewline
15 & -0.004796 & -0.0498 & 0.480169 \tabularnewline
16 & -0.20892 & -2.1712 & 0.016054 \tabularnewline
17 & 0.11607 & 1.2062 & 0.115182 \tabularnewline
18 & -0.207709 & -2.1586 & 0.016549 \tabularnewline
19 & -0.09662 & -1.0041 & 0.158786 \tabularnewline
20 & -0.081186 & -0.8437 & 0.200349 \tabularnewline
21 & 0.042743 & 0.4442 & 0.328893 \tabularnewline
22 & -0.018664 & -0.194 & 0.423286 \tabularnewline
23 & 0.066687 & 0.693 & 0.244888 \tabularnewline
24 & -0.152782 & -1.5878 & 0.057633 \tabularnewline
25 & -0.066884 & -0.6951 & 0.24425 \tabularnewline
26 & 0.075503 & 0.7846 & 0.21719 \tabularnewline
27 & -0.015188 & -0.1578 & 0.437439 \tabularnewline
28 & 0.102715 & 1.0674 & 0.144075 \tabularnewline
29 & -0.001002 & -0.0104 & 0.495857 \tabularnewline
30 & 0.056225 & 0.5843 & 0.280117 \tabularnewline
31 & 0.123663 & 1.2851 & 0.100746 \tabularnewline
32 & 0.015402 & 0.1601 & 0.436565 \tabularnewline
33 & -0.041849 & -0.4349 & 0.332248 \tabularnewline
34 & -0.06606 & -0.6865 & 0.246931 \tabularnewline
35 & -0.026559 & -0.276 & 0.391534 \tabularnewline
36 & -0.072841 & -0.757 & 0.225352 \tabularnewline
37 & 0.004795 & 0.0498 & 0.480174 \tabularnewline
38 & -0.093029 & -0.9668 & 0.167906 \tabularnewline
39 & -0.082241 & -0.8547 & 0.197311 \tabularnewline
40 & 0.007324 & 0.0761 & 0.469734 \tabularnewline
41 & -0.023277 & -0.2419 & 0.404658 \tabularnewline
42 & 0.066226 & 0.6882 & 0.24639 \tabularnewline
43 & -0.033919 & -0.3525 & 0.362577 \tabularnewline
44 & -0.082785 & -0.8603 & 0.195757 \tabularnewline
45 & 0.036793 & 0.3824 & 0.35147 \tabularnewline
46 & 0.04611 & 0.4792 & 0.316388 \tabularnewline
47 & 0.016742 & 0.174 & 0.431099 \tabularnewline
48 & -0.038068 & -0.3956 & 0.346585 \tabularnewline
\hline
\end{tabular}
%Source: https://freestatistics.org/blog/index.php?pk=169246&T=2

[TABLE]
[ROW][C]Partial Autocorrelation Function[/C][/ROW]
[ROW][C]Time lag k[/C][C]PACF(k)[/C][C]T-STAT[/C][C]P-value[/C][/ROW]
[ROW][C]1[/C][C]-0.303089[/C][C]-3.1498[/C][C]0.001057[/C][/ROW]
[ROW][C]2[/C][C]-0.190877[/C][C]-1.9836[/C][C]0.024916[/C][/ROW]
[ROW][C]3[/C][C]-0.270641[/C][C]-2.8126[/C][C]0.00292[/C][/ROW]
[ROW][C]4[/C][C]0.092113[/C][C]0.9573[/C][C]0.170286[/C][/ROW]
[ROW][C]5[/C][C]-0.26843[/C][C]-2.7896[/C][C]0.00312[/C][/ROW]
[ROW][C]6[/C][C]0.058511[/C][C]0.6081[/C][C]0.272209[/C][/ROW]
[ROW][C]7[/C][C]-0.231763[/C][C]-2.4086[/C][C]0.008854[/C][/ROW]
[ROW][C]8[/C][C]0.014719[/C][C]0.153[/C][C]0.439357[/C][/ROW]
[ROW][C]9[/C][C]-0.110567[/C][C]-1.149[/C][C]0.126537[/C][/ROW]
[ROW][C]10[/C][C]-0.337895[/C][C]-3.5115[/C][C]0.000326[/C][/ROW]
[ROW][C]11[/C][C]-0.450367[/C][C]-4.6804[/C][C]4e-06[/C][/ROW]
[ROW][C]12[/C][C]0.718508[/C][C]7.4669[/C][C]0[/C][/ROW]
[ROW][C]13[/C][C]0.135731[/C][C]1.4106[/C][C]0.080625[/C][/ROW]
[ROW][C]14[/C][C]0.079158[/C][C]0.8226[/C][C]0.206263[/C][/ROW]
[ROW][C]15[/C][C]-0.004796[/C][C]-0.0498[/C][C]0.480169[/C][/ROW]
[ROW][C]16[/C][C]-0.20892[/C][C]-2.1712[/C][C]0.016054[/C][/ROW]
[ROW][C]17[/C][C]0.11607[/C][C]1.2062[/C][C]0.115182[/C][/ROW]
[ROW][C]18[/C][C]-0.207709[/C][C]-2.1586[/C][C]0.016549[/C][/ROW]
[ROW][C]19[/C][C]-0.09662[/C][C]-1.0041[/C][C]0.158786[/C][/ROW]
[ROW][C]20[/C][C]-0.081186[/C][C]-0.8437[/C][C]0.200349[/C][/ROW]
[ROW][C]21[/C][C]0.042743[/C][C]0.4442[/C][C]0.328893[/C][/ROW]
[ROW][C]22[/C][C]-0.018664[/C][C]-0.194[/C][C]0.423286[/C][/ROW]
[ROW][C]23[/C][C]0.066687[/C][C]0.693[/C][C]0.244888[/C][/ROW]
[ROW][C]24[/C][C]-0.152782[/C][C]-1.5878[/C][C]0.057633[/C][/ROW]
[ROW][C]25[/C][C]-0.066884[/C][C]-0.6951[/C][C]0.24425[/C][/ROW]
[ROW][C]26[/C][C]0.075503[/C][C]0.7846[/C][C]0.21719[/C][/ROW]
[ROW][C]27[/C][C]-0.015188[/C][C]-0.1578[/C][C]0.437439[/C][/ROW]
[ROW][C]28[/C][C]0.102715[/C][C]1.0674[/C][C]0.144075[/C][/ROW]
[ROW][C]29[/C][C]-0.001002[/C][C]-0.0104[/C][C]0.495857[/C][/ROW]
[ROW][C]30[/C][C]0.056225[/C][C]0.5843[/C][C]0.280117[/C][/ROW]
[ROW][C]31[/C][C]0.123663[/C][C]1.2851[/C][C]0.100746[/C][/ROW]
[ROW][C]32[/C][C]0.015402[/C][C]0.1601[/C][C]0.436565[/C][/ROW]
[ROW][C]33[/C][C]-0.041849[/C][C]-0.4349[/C][C]0.332248[/C][/ROW]
[ROW][C]34[/C][C]-0.06606[/C][C]-0.6865[/C][C]0.246931[/C][/ROW]
[ROW][C]35[/C][C]-0.026559[/C][C]-0.276[/C][C]0.391534[/C][/ROW]
[ROW][C]36[/C][C]-0.072841[/C][C]-0.757[/C][C]0.225352[/C][/ROW]
[ROW][C]37[/C][C]0.004795[/C][C]0.0498[/C][C]0.480174[/C][/ROW]
[ROW][C]38[/C][C]-0.093029[/C][C]-0.9668[/C][C]0.167906[/C][/ROW]
[ROW][C]39[/C][C]-0.082241[/C][C]-0.8547[/C][C]0.197311[/C][/ROW]
[ROW][C]40[/C][C]0.007324[/C][C]0.0761[/C][C]0.469734[/C][/ROW]
[ROW][C]41[/C][C]-0.023277[/C][C]-0.2419[/C][C]0.404658[/C][/ROW]
[ROW][C]42[/C][C]0.066226[/C][C]0.6882[/C][C]0.24639[/C][/ROW]
[ROW][C]43[/C][C]-0.033919[/C][C]-0.3525[/C][C]0.362577[/C][/ROW]
[ROW][C]44[/C][C]-0.082785[/C][C]-0.8603[/C][C]0.195757[/C][/ROW]
[ROW][C]45[/C][C]0.036793[/C][C]0.3824[/C][C]0.35147[/C][/ROW]
[ROW][C]46[/C][C]0.04611[/C][C]0.4792[/C][C]0.316388[/C][/ROW]
[ROW][C]47[/C][C]0.016742[/C][C]0.174[/C][C]0.431099[/C][/ROW]
[ROW][C]48[/C][C]-0.038068[/C][C]-0.3956[/C][C]0.346585[/C][/ROW]
[/TABLE]
Source: https://freestatistics.org/blog/index.php?pk=169246&T=2

Globally Unique Identifier (entire table): ba.freestatistics.org/blog/index.php?pk=169246&T=2

As an alternative you can also use a QR Code:  

The GUIDs for individual cells are displayed in the table below:

Partial Autocorrelation Function
Time lag kPACF(k)T-STATP-value
1-0.303089-3.14980.001057
2-0.190877-1.98360.024916
3-0.270641-2.81260.00292
40.0921130.95730.170286
5-0.26843-2.78960.00312
60.0585110.60810.272209
7-0.231763-2.40860.008854
80.0147190.1530.439357
9-0.110567-1.1490.126537
10-0.337895-3.51150.000326
11-0.450367-4.68044e-06
120.7185087.46690
130.1357311.41060.080625
140.0791580.82260.206263
15-0.004796-0.04980.480169
16-0.20892-2.17120.016054
170.116071.20620.115182
18-0.207709-2.15860.016549
19-0.09662-1.00410.158786
20-0.081186-0.84370.200349
210.0427430.44420.328893
22-0.018664-0.1940.423286
230.0666870.6930.244888
24-0.152782-1.58780.057633
25-0.066884-0.69510.24425
260.0755030.78460.21719
27-0.015188-0.15780.437439
280.1027151.06740.144075
29-0.001002-0.01040.495857
300.0562250.58430.280117
310.1236631.28510.100746
320.0154020.16010.436565
33-0.041849-0.43490.332248
34-0.06606-0.68650.246931
35-0.026559-0.2760.391534
36-0.072841-0.7570.225352
370.0047950.04980.480174
38-0.093029-0.96680.167906
39-0.082241-0.85470.197311
400.0073240.07610.469734
41-0.023277-0.24190.404658
420.0662260.68820.24639
43-0.033919-0.35250.362577
44-0.082785-0.86030.195757
450.0367930.38240.35147
460.046110.47920.316388
470.0167420.1740.431099
48-0.038068-0.39560.346585


Parameters (Session):
par1 = 48 ; par2 = 1 ; par3 = 0 ; par4 = 0 ; par5 = 12 ; par6 = White Noise ; par7 = 0.95 ;
Parameters (R input):
par1 = 48 ; par2 = 1 ; par3 = 0 ; par4 = 0 ; par5 = 12 ; par6 = White Noise ; par7 = 0.95 ; par8 = ;
R code (references can be found in the software module):
if (par1 == 'Default') {
par1 = 10*log10(length(x))
} else {
par1 <- as.numeric(par1)
}
par2 <- as.numeric(par2)
par3 <- as.numeric(par3)
par4 <- as.numeric(par4)
par5 <- as.numeric(par5)
if (par6 == 'White Noise') par6 <- 'white' else par6 <- 'ma'
par7 <- as.numeric(par7)
if (par8 != '') par8 <- as.numeric(par8)
ox <- x
if (par8 == '') {
if (par2 == 0) {
x <- log(x)
} else {
x <- (x ^ par2 - 1) / par2
}
} else {
x <- log(x,base=par8)
}
if (par3 > 0) x <- diff(x,lag=1,difference=par3)
if (par4 > 0) x <- diff(x,lag=par5,difference=par4)
bitmap(file='picts.png')
op <- par(mfrow=c(2,1))
plot(ox,type='l',main='Original Time Series',xlab='time',ylab='value')
if (par8=='') {
mytitle <- paste('Working Time Series (lambda=',par2,', d=',par3,', D=',par4,')',sep='')
mysub <- paste('(lambda=',par2,', d=',par3,', D=',par4,', CI=', par7, ', CI type=',par6,')',sep='')
} else {
mytitle <- paste('Working Time Series (base=',par8,', d=',par3,', D=',par4,')',sep='')
mysub <- paste('(base=',par8,', d=',par3,', D=',par4,', CI=', par7, ', CI type=',par6,')',sep='')
}
plot(x,type='l', main=mytitle,xlab='time',ylab='value')
par(op)
dev.off()
bitmap(file='pic1.png')
racf <- acf(x, par1, main='Autocorrelation', xlab='time lag', ylab='ACF', ci.type=par6, ci=par7, sub=mysub)
dev.off()
bitmap(file='pic2.png')
rpacf <- pacf(x,par1,main='Partial Autocorrelation',xlab='lags',ylab='PACF',sub=mysub)
dev.off()
(myacf <- c(racf$acf))
(mypacf <- c(rpacf$acf))
lengthx <- length(x)
sqrtn <- sqrt(lengthx)
load(file='createtable')
a<-table.start()
a<-table.row.start(a)
a<-table.element(a,'Autocorrelation Function',4,TRUE)
a<-table.row.end(a)
a<-table.row.start(a)
a<-table.element(a,'Time lag k',header=TRUE)
a<-table.element(a,hyperlink('basics.htm','ACF(k)','click here for more information about the Autocorrelation Function'),header=TRUE)
a<-table.element(a,'T-STAT',header=TRUE)
a<-table.element(a,'P-value',header=TRUE)
a<-table.row.end(a)
for (i in 2:(par1+1)) {
a<-table.row.start(a)
a<-table.element(a,i-1,header=TRUE)
a<-table.element(a,round(myacf[i],6))
mytstat <- myacf[i]*sqrtn
a<-table.element(a,round(mytstat,4))
a<-table.element(a,round(1-pt(abs(mytstat),lengthx),6))
a<-table.row.end(a)
}
a<-table.end(a)
table.save(a,file='mytable.tab')
a<-table.start()
a<-table.row.start(a)
a<-table.element(a,'Partial Autocorrelation Function',4,TRUE)
a<-table.row.end(a)
a<-table.row.start(a)
a<-table.element(a,'Time lag k',header=TRUE)
a<-table.element(a,hyperlink('basics.htm','PACF(k)','click here for more information about the Partial Autocorrelation Function'),header=TRUE)
a<-table.element(a,'T-STAT',header=TRUE)
a<-table.element(a,'P-value',header=TRUE)
a<-table.row.end(a)
for (i in 1:par1) {
a<-table.row.start(a)
a<-table.element(a,i,header=TRUE)
a<-table.element(a,round(mypacf[i],6))
mytstat <- mypacf[i]*sqrtn
a<-table.element(a,round(mytstat,4))
a<-table.element(a,round(1-pt(abs(mytstat),lengthx),6))
a<-table.row.end(a)
}
a<-table.end(a)
table.save(a,file='mytable1.tab')