Free Statistics

of Irreproducible Research!

Author's title

Author*Unverified author*
R Software Modulerwasp_autocorrelation.wasp
Title produced by software(Partial) Autocorrelation Function
Date of computationSun, 12 Aug 2012 09:46:38 -0400
Cite this page as followsStatistical Computations at FreeStatistics.org, Office for Research Development and Education, URL https://freestatistics.org/blog/index.php?v=date/2012/Aug/12/t13447792550e8haz97mydp0a7.htm/, Retrieved Sat, 27 Apr 2024 17:45:18 +0000
Statistical Computations at FreeStatistics.org, Office for Research Development and Education, URL https://freestatistics.org/blog/index.php?pk=169242, Retrieved Sat, 27 Apr 2024 17:45:18 +0000
QR Codes:

Original text written by user:
IsPrivate?No (this computation is public)
User-defined keywordsBlij Arnaud
Estimated Impact133
Family? (F = Feedback message, R = changed R code, M = changed R Module, P = changed Parameters, D = changed Data)
-       [(Partial) Autocorrelation Function] [Tijdreeks B - Sta...] [2012-08-12 13:46:38] [50083fea611f0183deb36cab794727ad] [Current]
Feedback Forum

Post a new message
Dataseries X:
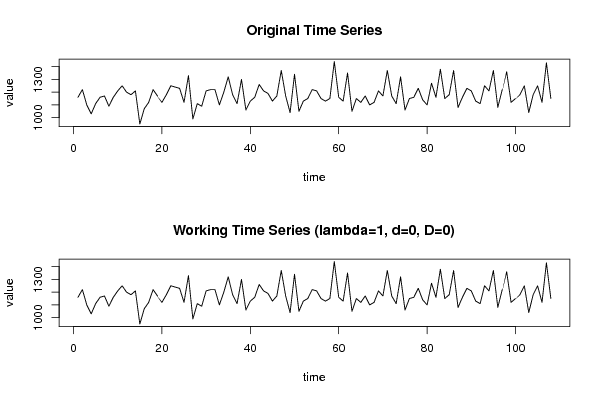
1160
1220
1100
1030
1110
1160
1170
1090
1160
1210
1250
1200
1180
1210
950
1070
1120
1220
1170
1120
1180
1250
1240
1230
1120
1330
990
1110
1090
1210
1220
1220
1100
1200
1320
1180
1110
1300
1060
1130
1160
1260
1210
1190
1130
1170
1370
1170
1040
1340
1050
1130
1150
1220
1210
1150
1130
1150
1440
1160
1130
1350
1050
1150
1120
1170
1100
1120
1210
1170
1370
1170
1110
1320
1060
1150
1160
1230
1140
1100
1270
1160
1380
1150
1180
1370
1080
1160
1230
1210
1130
1110
1250
1210
1370
1080
1220
1360
1120
1150
1180
1250
1040
1180
1250
1120
1430
1150


Summary of computational transaction
Raw Inputview raw input (R code)
Raw Outputview raw output of R engine
Computing time2 seconds
R Server'Herman Ole Andreas Wold' @ wold.wessa.net

\begin{tabular}{lllllllll}
\hline
Summary of computational transaction \tabularnewline
Raw Input & view raw input (R code)  \tabularnewline
Raw Output & view raw output of R engine  \tabularnewline
Computing time & 2 seconds \tabularnewline
R Server & 'Herman Ole Andreas Wold' @ wold.wessa.net \tabularnewline
\hline
\end{tabular}
%Source: https://freestatistics.org/blog/index.php?pk=169242&T=0

[TABLE]
[ROW][C]Summary of computational transaction[/C][/ROW]
[ROW][C]Raw Input[/C][C]view raw input (R code) [/C][/ROW]
[ROW][C]Raw Output[/C][C]view raw output of R engine [/C][/ROW]
[ROW][C]Computing time[/C][C]2 seconds[/C][/ROW]
[ROW][C]R Server[/C][C]'Herman Ole Andreas Wold' @ wold.wessa.net[/C][/ROW]
[/TABLE]
Source: https://freestatistics.org/blog/index.php?pk=169242&T=0

Globally Unique Identifier (entire table): ba.freestatistics.org/blog/index.php?pk=169242&T=0

As an alternative you can also use a QR Code:  

The GUIDs for individual cells are displayed in the table below:

Summary of computational transaction
Raw Inputview raw input (R code)
Raw Outputview raw output of R engine
Computing time2 seconds
R Server'Herman Ole Andreas Wold' @ wold.wessa.net


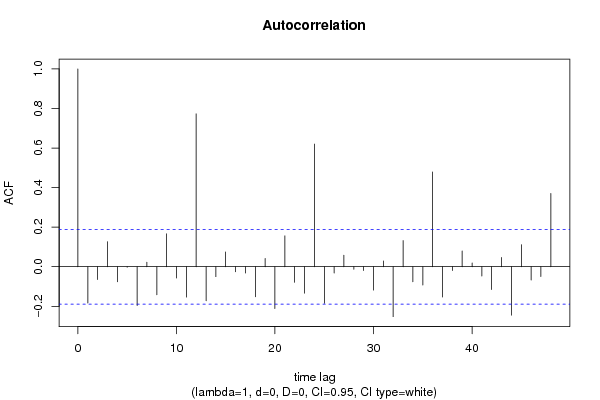
Autocorrelation Function
Time lag kACF(k)T-STATP-value
1-0.183922-1.91140.029303
2-0.064858-0.6740.250869
30.1258661.3080.096819
4-0.07629-0.79280.214807
5-0.00269-0.0280.488876
6-0.196314-2.04020.021887
70.0229770.23880.405864
8-0.142257-1.47840.071109
90.1658911.7240.043785
10-0.057341-0.59590.276242
11-0.153711-1.59740.056548
120.7730388.03360
13-0.172086-1.78840.03826
14-0.050089-0.52050.301875
150.0746610.77590.219753
16-0.025923-0.26940.394068
17-0.032144-0.33410.369494
18-0.152056-1.58020.058492
190.0411670.42780.334816
20-0.21151-2.19810.015039
210.1558921.62010.054066
22-0.078331-0.8140.208707
23-0.133816-1.39070.083595
240.6198286.44140
25-0.185052-1.92310.028549
26-0.031887-0.33140.370501
270.0575790.59840.275421
28-0.01286-0.13360.446964
29-0.019102-0.19850.421509
30-0.118351-1.22990.110695
310.0292970.30450.380682
32-0.2526-2.62510.004959
330.1317921.36960.086823
34-0.07576-0.78730.216409
35-0.092433-0.96060.169451
360.4792574.98061e-06
37-0.153178-1.59190.057169
38-0.019486-0.20250.419954
390.0790330.82130.206633
400.0187950.19530.422755
41-0.04675-0.48580.314033
42-0.115331-1.19860.116663
430.0466790.48510.314293
44-0.245034-2.54650.006146
450.1107971.15140.126048
46-0.067211-0.69850.243191
47-0.049443-0.51380.304212
480.3704733.85011e-04

\begin{tabular}{lllllllll}
\hline
Autocorrelation Function \tabularnewline
Time lag k & ACF(k) & T-STAT & P-value \tabularnewline
1 & -0.183922 & -1.9114 & 0.029303 \tabularnewline
2 & -0.064858 & -0.674 & 0.250869 \tabularnewline
3 & 0.125866 & 1.308 & 0.096819 \tabularnewline
4 & -0.07629 & -0.7928 & 0.214807 \tabularnewline
5 & -0.00269 & -0.028 & 0.488876 \tabularnewline
6 & -0.196314 & -2.0402 & 0.021887 \tabularnewline
7 & 0.022977 & 0.2388 & 0.405864 \tabularnewline
8 & -0.142257 & -1.4784 & 0.071109 \tabularnewline
9 & 0.165891 & 1.724 & 0.043785 \tabularnewline
10 & -0.057341 & -0.5959 & 0.276242 \tabularnewline
11 & -0.153711 & -1.5974 & 0.056548 \tabularnewline
12 & 0.773038 & 8.0336 & 0 \tabularnewline
13 & -0.172086 & -1.7884 & 0.03826 \tabularnewline
14 & -0.050089 & -0.5205 & 0.301875 \tabularnewline
15 & 0.074661 & 0.7759 & 0.219753 \tabularnewline
16 & -0.025923 & -0.2694 & 0.394068 \tabularnewline
17 & -0.032144 & -0.3341 & 0.369494 \tabularnewline
18 & -0.152056 & -1.5802 & 0.058492 \tabularnewline
19 & 0.041167 & 0.4278 & 0.334816 \tabularnewline
20 & -0.21151 & -2.1981 & 0.015039 \tabularnewline
21 & 0.155892 & 1.6201 & 0.054066 \tabularnewline
22 & -0.078331 & -0.814 & 0.208707 \tabularnewline
23 & -0.133816 & -1.3907 & 0.083595 \tabularnewline
24 & 0.619828 & 6.4414 & 0 \tabularnewline
25 & -0.185052 & -1.9231 & 0.028549 \tabularnewline
26 & -0.031887 & -0.3314 & 0.370501 \tabularnewline
27 & 0.057579 & 0.5984 & 0.275421 \tabularnewline
28 & -0.01286 & -0.1336 & 0.446964 \tabularnewline
29 & -0.019102 & -0.1985 & 0.421509 \tabularnewline
30 & -0.118351 & -1.2299 & 0.110695 \tabularnewline
31 & 0.029297 & 0.3045 & 0.380682 \tabularnewline
32 & -0.2526 & -2.6251 & 0.004959 \tabularnewline
33 & 0.131792 & 1.3696 & 0.086823 \tabularnewline
34 & -0.07576 & -0.7873 & 0.216409 \tabularnewline
35 & -0.092433 & -0.9606 & 0.169451 \tabularnewline
36 & 0.479257 & 4.9806 & 1e-06 \tabularnewline
37 & -0.153178 & -1.5919 & 0.057169 \tabularnewline
38 & -0.019486 & -0.2025 & 0.419954 \tabularnewline
39 & 0.079033 & 0.8213 & 0.206633 \tabularnewline
40 & 0.018795 & 0.1953 & 0.422755 \tabularnewline
41 & -0.04675 & -0.4858 & 0.314033 \tabularnewline
42 & -0.115331 & -1.1986 & 0.116663 \tabularnewline
43 & 0.046679 & 0.4851 & 0.314293 \tabularnewline
44 & -0.245034 & -2.5465 & 0.006146 \tabularnewline
45 & 0.110797 & 1.1514 & 0.126048 \tabularnewline
46 & -0.067211 & -0.6985 & 0.243191 \tabularnewline
47 & -0.049443 & -0.5138 & 0.304212 \tabularnewline
48 & 0.370473 & 3.8501 & 1e-04 \tabularnewline
\hline
\end{tabular}
%Source: https://freestatistics.org/blog/index.php?pk=169242&T=1

[TABLE]
[ROW][C]Autocorrelation Function[/C][/ROW]
[ROW][C]Time lag k[/C][C]ACF(k)[/C][C]T-STAT[/C][C]P-value[/C][/ROW]
[ROW][C]1[/C][C]-0.183922[/C][C]-1.9114[/C][C]0.029303[/C][/ROW]
[ROW][C]2[/C][C]-0.064858[/C][C]-0.674[/C][C]0.250869[/C][/ROW]
[ROW][C]3[/C][C]0.125866[/C][C]1.308[/C][C]0.096819[/C][/ROW]
[ROW][C]4[/C][C]-0.07629[/C][C]-0.7928[/C][C]0.214807[/C][/ROW]
[ROW][C]5[/C][C]-0.00269[/C][C]-0.028[/C][C]0.488876[/C][/ROW]
[ROW][C]6[/C][C]-0.196314[/C][C]-2.0402[/C][C]0.021887[/C][/ROW]
[ROW][C]7[/C][C]0.022977[/C][C]0.2388[/C][C]0.405864[/C][/ROW]
[ROW][C]8[/C][C]-0.142257[/C][C]-1.4784[/C][C]0.071109[/C][/ROW]
[ROW][C]9[/C][C]0.165891[/C][C]1.724[/C][C]0.043785[/C][/ROW]
[ROW][C]10[/C][C]-0.057341[/C][C]-0.5959[/C][C]0.276242[/C][/ROW]
[ROW][C]11[/C][C]-0.153711[/C][C]-1.5974[/C][C]0.056548[/C][/ROW]
[ROW][C]12[/C][C]0.773038[/C][C]8.0336[/C][C]0[/C][/ROW]
[ROW][C]13[/C][C]-0.172086[/C][C]-1.7884[/C][C]0.03826[/C][/ROW]
[ROW][C]14[/C][C]-0.050089[/C][C]-0.5205[/C][C]0.301875[/C][/ROW]
[ROW][C]15[/C][C]0.074661[/C][C]0.7759[/C][C]0.219753[/C][/ROW]
[ROW][C]16[/C][C]-0.025923[/C][C]-0.2694[/C][C]0.394068[/C][/ROW]
[ROW][C]17[/C][C]-0.032144[/C][C]-0.3341[/C][C]0.369494[/C][/ROW]
[ROW][C]18[/C][C]-0.152056[/C][C]-1.5802[/C][C]0.058492[/C][/ROW]
[ROW][C]19[/C][C]0.041167[/C][C]0.4278[/C][C]0.334816[/C][/ROW]
[ROW][C]20[/C][C]-0.21151[/C][C]-2.1981[/C][C]0.015039[/C][/ROW]
[ROW][C]21[/C][C]0.155892[/C][C]1.6201[/C][C]0.054066[/C][/ROW]
[ROW][C]22[/C][C]-0.078331[/C][C]-0.814[/C][C]0.208707[/C][/ROW]
[ROW][C]23[/C][C]-0.133816[/C][C]-1.3907[/C][C]0.083595[/C][/ROW]
[ROW][C]24[/C][C]0.619828[/C][C]6.4414[/C][C]0[/C][/ROW]
[ROW][C]25[/C][C]-0.185052[/C][C]-1.9231[/C][C]0.028549[/C][/ROW]
[ROW][C]26[/C][C]-0.031887[/C][C]-0.3314[/C][C]0.370501[/C][/ROW]
[ROW][C]27[/C][C]0.057579[/C][C]0.5984[/C][C]0.275421[/C][/ROW]
[ROW][C]28[/C][C]-0.01286[/C][C]-0.1336[/C][C]0.446964[/C][/ROW]
[ROW][C]29[/C][C]-0.019102[/C][C]-0.1985[/C][C]0.421509[/C][/ROW]
[ROW][C]30[/C][C]-0.118351[/C][C]-1.2299[/C][C]0.110695[/C][/ROW]
[ROW][C]31[/C][C]0.029297[/C][C]0.3045[/C][C]0.380682[/C][/ROW]
[ROW][C]32[/C][C]-0.2526[/C][C]-2.6251[/C][C]0.004959[/C][/ROW]
[ROW][C]33[/C][C]0.131792[/C][C]1.3696[/C][C]0.086823[/C][/ROW]
[ROW][C]34[/C][C]-0.07576[/C][C]-0.7873[/C][C]0.216409[/C][/ROW]
[ROW][C]35[/C][C]-0.092433[/C][C]-0.9606[/C][C]0.169451[/C][/ROW]
[ROW][C]36[/C][C]0.479257[/C][C]4.9806[/C][C]1e-06[/C][/ROW]
[ROW][C]37[/C][C]-0.153178[/C][C]-1.5919[/C][C]0.057169[/C][/ROW]
[ROW][C]38[/C][C]-0.019486[/C][C]-0.2025[/C][C]0.419954[/C][/ROW]
[ROW][C]39[/C][C]0.079033[/C][C]0.8213[/C][C]0.206633[/C][/ROW]
[ROW][C]40[/C][C]0.018795[/C][C]0.1953[/C][C]0.422755[/C][/ROW]
[ROW][C]41[/C][C]-0.04675[/C][C]-0.4858[/C][C]0.314033[/C][/ROW]
[ROW][C]42[/C][C]-0.115331[/C][C]-1.1986[/C][C]0.116663[/C][/ROW]
[ROW][C]43[/C][C]0.046679[/C][C]0.4851[/C][C]0.314293[/C][/ROW]
[ROW][C]44[/C][C]-0.245034[/C][C]-2.5465[/C][C]0.006146[/C][/ROW]
[ROW][C]45[/C][C]0.110797[/C][C]1.1514[/C][C]0.126048[/C][/ROW]
[ROW][C]46[/C][C]-0.067211[/C][C]-0.6985[/C][C]0.243191[/C][/ROW]
[ROW][C]47[/C][C]-0.049443[/C][C]-0.5138[/C][C]0.304212[/C][/ROW]
[ROW][C]48[/C][C]0.370473[/C][C]3.8501[/C][C]1e-04[/C][/ROW]
[/TABLE]
Source: https://freestatistics.org/blog/index.php?pk=169242&T=1

Globally Unique Identifier (entire table): ba.freestatistics.org/blog/index.php?pk=169242&T=1

As an alternative you can also use a QR Code:  

The GUIDs for individual cells are displayed in the table below:

Autocorrelation Function
Time lag kACF(k)T-STATP-value
1-0.183922-1.91140.029303
2-0.064858-0.6740.250869
30.1258661.3080.096819
4-0.07629-0.79280.214807
5-0.00269-0.0280.488876
6-0.196314-2.04020.021887
70.0229770.23880.405864
8-0.142257-1.47840.071109
90.1658911.7240.043785
10-0.057341-0.59590.276242
11-0.153711-1.59740.056548
120.7730388.03360
13-0.172086-1.78840.03826
14-0.050089-0.52050.301875
150.0746610.77590.219753
16-0.025923-0.26940.394068
17-0.032144-0.33410.369494
18-0.152056-1.58020.058492
190.0411670.42780.334816
20-0.21151-2.19810.015039
210.1558921.62010.054066
22-0.078331-0.8140.208707
23-0.133816-1.39070.083595
240.6198286.44140
25-0.185052-1.92310.028549
26-0.031887-0.33140.370501
270.0575790.59840.275421
28-0.01286-0.13360.446964
29-0.019102-0.19850.421509
30-0.118351-1.22990.110695
310.0292970.30450.380682
32-0.2526-2.62510.004959
330.1317921.36960.086823
34-0.07576-0.78730.216409
35-0.092433-0.96060.169451
360.4792574.98061e-06
37-0.153178-1.59190.057169
38-0.019486-0.20250.419954
390.0790330.82130.206633
400.0187950.19530.422755
41-0.04675-0.48580.314033
42-0.115331-1.19860.116663
430.0466790.48510.314293
44-0.245034-2.54650.006146
450.1107971.15140.126048
46-0.067211-0.69850.243191
47-0.049443-0.51380.304212
480.3704733.85011e-04


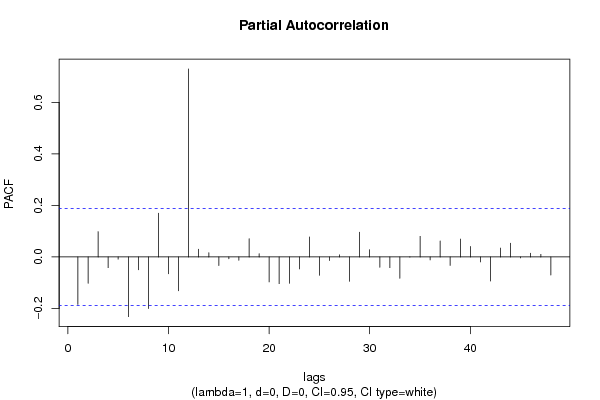
Partial Autocorrelation Function
Time lag kPACF(k)T-STATP-value
1-0.183922-1.91140.029303
2-0.10214-1.06150.145422
30.0982471.0210.154766
4-0.041508-0.43140.333532
5-0.008548-0.08880.46469
6-0.231635-2.40720.008885
7-0.049688-0.51640.303324
8-0.199967-2.07810.020034
90.169391.76040.04059
10-0.065179-0.67740.249812
11-0.131418-1.36570.087429
120.7297247.58350
130.0298270.310.37859
140.0165020.17150.432077
15-0.033446-0.34760.364417
16-0.007117-0.0740.470591
17-0.012843-0.13350.447035
180.0706810.73450.232107
190.012510.130.448403
20-0.096727-1.00520.158519
21-0.103631-1.0770.141949
22-0.102318-1.06330.145004
23-0.046199-0.48010.316058
240.0776960.80740.210595
25-0.070663-0.73440.232162
26-0.013418-0.13940.444678
270.0081740.08490.466231
28-0.094248-0.97950.164773
290.0958830.99640.16063
300.0279310.29030.386084
31-0.039917-0.41480.339543
32-0.041356-0.42980.334106
33-0.082468-0.8570.196663
34-0.000578-0.0060.497609
350.0800320.83170.203703
36-0.011349-0.11790.453168
370.0618380.64260.26091
38-0.032728-0.34010.367213
390.0692520.71970.236635
400.0404170.420.33765
41-0.019037-0.19780.421771
42-0.09325-0.96910.167334
430.0343220.35670.361012
440.0533990.55490.290041
45-0.003532-0.03670.485394
460.014670.15250.439557
470.0100010.10390.458706
48-0.07009-0.72840.233973

\begin{tabular}{lllllllll}
\hline
Partial Autocorrelation Function \tabularnewline
Time lag k & PACF(k) & T-STAT & P-value \tabularnewline
1 & -0.183922 & -1.9114 & 0.029303 \tabularnewline
2 & -0.10214 & -1.0615 & 0.145422 \tabularnewline
3 & 0.098247 & 1.021 & 0.154766 \tabularnewline
4 & -0.041508 & -0.4314 & 0.333532 \tabularnewline
5 & -0.008548 & -0.0888 & 0.46469 \tabularnewline
6 & -0.231635 & -2.4072 & 0.008885 \tabularnewline
7 & -0.049688 & -0.5164 & 0.303324 \tabularnewline
8 & -0.199967 & -2.0781 & 0.020034 \tabularnewline
9 & 0.16939 & 1.7604 & 0.04059 \tabularnewline
10 & -0.065179 & -0.6774 & 0.249812 \tabularnewline
11 & -0.131418 & -1.3657 & 0.087429 \tabularnewline
12 & 0.729724 & 7.5835 & 0 \tabularnewline
13 & 0.029827 & 0.31 & 0.37859 \tabularnewline
14 & 0.016502 & 0.1715 & 0.432077 \tabularnewline
15 & -0.033446 & -0.3476 & 0.364417 \tabularnewline
16 & -0.007117 & -0.074 & 0.470591 \tabularnewline
17 & -0.012843 & -0.1335 & 0.447035 \tabularnewline
18 & 0.070681 & 0.7345 & 0.232107 \tabularnewline
19 & 0.01251 & 0.13 & 0.448403 \tabularnewline
20 & -0.096727 & -1.0052 & 0.158519 \tabularnewline
21 & -0.103631 & -1.077 & 0.141949 \tabularnewline
22 & -0.102318 & -1.0633 & 0.145004 \tabularnewline
23 & -0.046199 & -0.4801 & 0.316058 \tabularnewline
24 & 0.077696 & 0.8074 & 0.210595 \tabularnewline
25 & -0.070663 & -0.7344 & 0.232162 \tabularnewline
26 & -0.013418 & -0.1394 & 0.444678 \tabularnewline
27 & 0.008174 & 0.0849 & 0.466231 \tabularnewline
28 & -0.094248 & -0.9795 & 0.164773 \tabularnewline
29 & 0.095883 & 0.9964 & 0.16063 \tabularnewline
30 & 0.027931 & 0.2903 & 0.386084 \tabularnewline
31 & -0.039917 & -0.4148 & 0.339543 \tabularnewline
32 & -0.041356 & -0.4298 & 0.334106 \tabularnewline
33 & -0.082468 & -0.857 & 0.196663 \tabularnewline
34 & -0.000578 & -0.006 & 0.497609 \tabularnewline
35 & 0.080032 & 0.8317 & 0.203703 \tabularnewline
36 & -0.011349 & -0.1179 & 0.453168 \tabularnewline
37 & 0.061838 & 0.6426 & 0.26091 \tabularnewline
38 & -0.032728 & -0.3401 & 0.367213 \tabularnewline
39 & 0.069252 & 0.7197 & 0.236635 \tabularnewline
40 & 0.040417 & 0.42 & 0.33765 \tabularnewline
41 & -0.019037 & -0.1978 & 0.421771 \tabularnewline
42 & -0.09325 & -0.9691 & 0.167334 \tabularnewline
43 & 0.034322 & 0.3567 & 0.361012 \tabularnewline
44 & 0.053399 & 0.5549 & 0.290041 \tabularnewline
45 & -0.003532 & -0.0367 & 0.485394 \tabularnewline
46 & 0.01467 & 0.1525 & 0.439557 \tabularnewline
47 & 0.010001 & 0.1039 & 0.458706 \tabularnewline
48 & -0.07009 & -0.7284 & 0.233973 \tabularnewline
\hline
\end{tabular}
%Source: https://freestatistics.org/blog/index.php?pk=169242&T=2

[TABLE]
[ROW][C]Partial Autocorrelation Function[/C][/ROW]
[ROW][C]Time lag k[/C][C]PACF(k)[/C][C]T-STAT[/C][C]P-value[/C][/ROW]
[ROW][C]1[/C][C]-0.183922[/C][C]-1.9114[/C][C]0.029303[/C][/ROW]
[ROW][C]2[/C][C]-0.10214[/C][C]-1.0615[/C][C]0.145422[/C][/ROW]
[ROW][C]3[/C][C]0.098247[/C][C]1.021[/C][C]0.154766[/C][/ROW]
[ROW][C]4[/C][C]-0.041508[/C][C]-0.4314[/C][C]0.333532[/C][/ROW]
[ROW][C]5[/C][C]-0.008548[/C][C]-0.0888[/C][C]0.46469[/C][/ROW]
[ROW][C]6[/C][C]-0.231635[/C][C]-2.4072[/C][C]0.008885[/C][/ROW]
[ROW][C]7[/C][C]-0.049688[/C][C]-0.5164[/C][C]0.303324[/C][/ROW]
[ROW][C]8[/C][C]-0.199967[/C][C]-2.0781[/C][C]0.020034[/C][/ROW]
[ROW][C]9[/C][C]0.16939[/C][C]1.7604[/C][C]0.04059[/C][/ROW]
[ROW][C]10[/C][C]-0.065179[/C][C]-0.6774[/C][C]0.249812[/C][/ROW]
[ROW][C]11[/C][C]-0.131418[/C][C]-1.3657[/C][C]0.087429[/C][/ROW]
[ROW][C]12[/C][C]0.729724[/C][C]7.5835[/C][C]0[/C][/ROW]
[ROW][C]13[/C][C]0.029827[/C][C]0.31[/C][C]0.37859[/C][/ROW]
[ROW][C]14[/C][C]0.016502[/C][C]0.1715[/C][C]0.432077[/C][/ROW]
[ROW][C]15[/C][C]-0.033446[/C][C]-0.3476[/C][C]0.364417[/C][/ROW]
[ROW][C]16[/C][C]-0.007117[/C][C]-0.074[/C][C]0.470591[/C][/ROW]
[ROW][C]17[/C][C]-0.012843[/C][C]-0.1335[/C][C]0.447035[/C][/ROW]
[ROW][C]18[/C][C]0.070681[/C][C]0.7345[/C][C]0.232107[/C][/ROW]
[ROW][C]19[/C][C]0.01251[/C][C]0.13[/C][C]0.448403[/C][/ROW]
[ROW][C]20[/C][C]-0.096727[/C][C]-1.0052[/C][C]0.158519[/C][/ROW]
[ROW][C]21[/C][C]-0.103631[/C][C]-1.077[/C][C]0.141949[/C][/ROW]
[ROW][C]22[/C][C]-0.102318[/C][C]-1.0633[/C][C]0.145004[/C][/ROW]
[ROW][C]23[/C][C]-0.046199[/C][C]-0.4801[/C][C]0.316058[/C][/ROW]
[ROW][C]24[/C][C]0.077696[/C][C]0.8074[/C][C]0.210595[/C][/ROW]
[ROW][C]25[/C][C]-0.070663[/C][C]-0.7344[/C][C]0.232162[/C][/ROW]
[ROW][C]26[/C][C]-0.013418[/C][C]-0.1394[/C][C]0.444678[/C][/ROW]
[ROW][C]27[/C][C]0.008174[/C][C]0.0849[/C][C]0.466231[/C][/ROW]
[ROW][C]28[/C][C]-0.094248[/C][C]-0.9795[/C][C]0.164773[/C][/ROW]
[ROW][C]29[/C][C]0.095883[/C][C]0.9964[/C][C]0.16063[/C][/ROW]
[ROW][C]30[/C][C]0.027931[/C][C]0.2903[/C][C]0.386084[/C][/ROW]
[ROW][C]31[/C][C]-0.039917[/C][C]-0.4148[/C][C]0.339543[/C][/ROW]
[ROW][C]32[/C][C]-0.041356[/C][C]-0.4298[/C][C]0.334106[/C][/ROW]
[ROW][C]33[/C][C]-0.082468[/C][C]-0.857[/C][C]0.196663[/C][/ROW]
[ROW][C]34[/C][C]-0.000578[/C][C]-0.006[/C][C]0.497609[/C][/ROW]
[ROW][C]35[/C][C]0.080032[/C][C]0.8317[/C][C]0.203703[/C][/ROW]
[ROW][C]36[/C][C]-0.011349[/C][C]-0.1179[/C][C]0.453168[/C][/ROW]
[ROW][C]37[/C][C]0.061838[/C][C]0.6426[/C][C]0.26091[/C][/ROW]
[ROW][C]38[/C][C]-0.032728[/C][C]-0.3401[/C][C]0.367213[/C][/ROW]
[ROW][C]39[/C][C]0.069252[/C][C]0.7197[/C][C]0.236635[/C][/ROW]
[ROW][C]40[/C][C]0.040417[/C][C]0.42[/C][C]0.33765[/C][/ROW]
[ROW][C]41[/C][C]-0.019037[/C][C]-0.1978[/C][C]0.421771[/C][/ROW]
[ROW][C]42[/C][C]-0.09325[/C][C]-0.9691[/C][C]0.167334[/C][/ROW]
[ROW][C]43[/C][C]0.034322[/C][C]0.3567[/C][C]0.361012[/C][/ROW]
[ROW][C]44[/C][C]0.053399[/C][C]0.5549[/C][C]0.290041[/C][/ROW]
[ROW][C]45[/C][C]-0.003532[/C][C]-0.0367[/C][C]0.485394[/C][/ROW]
[ROW][C]46[/C][C]0.01467[/C][C]0.1525[/C][C]0.439557[/C][/ROW]
[ROW][C]47[/C][C]0.010001[/C][C]0.1039[/C][C]0.458706[/C][/ROW]
[ROW][C]48[/C][C]-0.07009[/C][C]-0.7284[/C][C]0.233973[/C][/ROW]
[/TABLE]
Source: https://freestatistics.org/blog/index.php?pk=169242&T=2

Globally Unique Identifier (entire table): ba.freestatistics.org/blog/index.php?pk=169242&T=2

As an alternative you can also use a QR Code:  

The GUIDs for individual cells are displayed in the table below:

Partial Autocorrelation Function
Time lag kPACF(k)T-STATP-value
1-0.183922-1.91140.029303
2-0.10214-1.06150.145422
30.0982471.0210.154766
4-0.041508-0.43140.333532
5-0.008548-0.08880.46469
6-0.231635-2.40720.008885
7-0.049688-0.51640.303324
8-0.199967-2.07810.020034
90.169391.76040.04059
10-0.065179-0.67740.249812
11-0.131418-1.36570.087429
120.7297247.58350
130.0298270.310.37859
140.0165020.17150.432077
15-0.033446-0.34760.364417
16-0.007117-0.0740.470591
17-0.012843-0.13350.447035
180.0706810.73450.232107
190.012510.130.448403
20-0.096727-1.00520.158519
21-0.103631-1.0770.141949
22-0.102318-1.06330.145004
23-0.046199-0.48010.316058
240.0776960.80740.210595
25-0.070663-0.73440.232162
26-0.013418-0.13940.444678
270.0081740.08490.466231
28-0.094248-0.97950.164773
290.0958830.99640.16063
300.0279310.29030.386084
31-0.039917-0.41480.339543
32-0.041356-0.42980.334106
33-0.082468-0.8570.196663
34-0.000578-0.0060.497609
350.0800320.83170.203703
36-0.011349-0.11790.453168
370.0618380.64260.26091
38-0.032728-0.34010.367213
390.0692520.71970.236635
400.0404170.420.33765
41-0.019037-0.19780.421771
42-0.09325-0.96910.167334
430.0343220.35670.361012
440.0533990.55490.290041
45-0.003532-0.03670.485394
460.014670.15250.439557
470.0100010.10390.458706
48-0.07009-0.72840.233973


Parameters (Session):
par1 = 48 ; par2 = 1 ; par3 = 0 ; par4 = 0 ; par5 = 12 ; par6 = White Noise ; par7 = 0.95 ;
Parameters (R input):
par1 = 48 ; par2 = 1 ; par3 = 0 ; par4 = 0 ; par5 = 12 ; par6 = White Noise ; par7 = 0.95 ; par8 = ;
R code (references can be found in the software module):
if (par1 == 'Default') {
par1 = 10*log10(length(x))
} else {
par1 <- as.numeric(par1)
}
par2 <- as.numeric(par2)
par3 <- as.numeric(par3)
par4 <- as.numeric(par4)
par5 <- as.numeric(par5)
if (par6 == 'White Noise') par6 <- 'white' else par6 <- 'ma'
par7 <- as.numeric(par7)
if (par8 != '') par8 <- as.numeric(par8)
ox <- x
if (par8 == '') {
if (par2 == 0) {
x <- log(x)
} else {
x <- (x ^ par2 - 1) / par2
}
} else {
x <- log(x,base=par8)
}
if (par3 > 0) x <- diff(x,lag=1,difference=par3)
if (par4 > 0) x <- diff(x,lag=par5,difference=par4)
bitmap(file='picts.png')
op <- par(mfrow=c(2,1))
plot(ox,type='l',main='Original Time Series',xlab='time',ylab='value')
if (par8=='') {
mytitle <- paste('Working Time Series (lambda=',par2,', d=',par3,', D=',par4,')',sep='')
mysub <- paste('(lambda=',par2,', d=',par3,', D=',par4,', CI=', par7, ', CI type=',par6,')',sep='')
} else {
mytitle <- paste('Working Time Series (base=',par8,', d=',par3,', D=',par4,')',sep='')
mysub <- paste('(base=',par8,', d=',par3,', D=',par4,', CI=', par7, ', CI type=',par6,')',sep='')
}
plot(x,type='l', main=mytitle,xlab='time',ylab='value')
par(op)
dev.off()
bitmap(file='pic1.png')
racf <- acf(x, par1, main='Autocorrelation', xlab='time lag', ylab='ACF', ci.type=par6, ci=par7, sub=mysub)
dev.off()
bitmap(file='pic2.png')
rpacf <- pacf(x,par1,main='Partial Autocorrelation',xlab='lags',ylab='PACF',sub=mysub)
dev.off()
(myacf <- c(racf$acf))
(mypacf <- c(rpacf$acf))
lengthx <- length(x)
sqrtn <- sqrt(lengthx)
load(file='createtable')
a<-table.start()
a<-table.row.start(a)
a<-table.element(a,'Autocorrelation Function',4,TRUE)
a<-table.row.end(a)
a<-table.row.start(a)
a<-table.element(a,'Time lag k',header=TRUE)
a<-table.element(a,hyperlink('basics.htm','ACF(k)','click here for more information about the Autocorrelation Function'),header=TRUE)
a<-table.element(a,'T-STAT',header=TRUE)
a<-table.element(a,'P-value',header=TRUE)
a<-table.row.end(a)
for (i in 2:(par1+1)) {
a<-table.row.start(a)
a<-table.element(a,i-1,header=TRUE)
a<-table.element(a,round(myacf[i],6))
mytstat <- myacf[i]*sqrtn
a<-table.element(a,round(mytstat,4))
a<-table.element(a,round(1-pt(abs(mytstat),lengthx),6))
a<-table.row.end(a)
}
a<-table.end(a)
table.save(a,file='mytable.tab')
a<-table.start()
a<-table.row.start(a)
a<-table.element(a,'Partial Autocorrelation Function',4,TRUE)
a<-table.row.end(a)
a<-table.row.start(a)
a<-table.element(a,'Time lag k',header=TRUE)
a<-table.element(a,hyperlink('basics.htm','PACF(k)','click here for more information about the Partial Autocorrelation Function'),header=TRUE)
a<-table.element(a,'T-STAT',header=TRUE)
a<-table.element(a,'P-value',header=TRUE)
a<-table.row.end(a)
for (i in 1:par1) {
a<-table.row.start(a)
a<-table.element(a,i,header=TRUE)
a<-table.element(a,round(mypacf[i],6))
mytstat <- mypacf[i]*sqrtn
a<-table.element(a,round(mytstat,4))
a<-table.element(a,round(1-pt(abs(mytstat),lengthx),6))
a<-table.row.end(a)
}
a<-table.end(a)
table.save(a,file='mytable1.tab')