Free Statistics

of Irreproducible Research!

Author's title

Author*Unverified author*
R Software Modulerwasp_autocorrelation.wasp
Title produced by software(Partial) Autocorrelation Function
Date of computationSun, 12 Aug 2012 09:23:14 -0400
Cite this page as followsStatistical Computations at FreeStatistics.org, Office for Research Development and Education, URL https://freestatistics.org/blog/index.php?v=date/2012/Aug/12/t1344777824ehi9ahd5nn8i1qb.htm/, Retrieved Sun, 28 Apr 2024 15:35:48 +0000
Statistical Computations at FreeStatistics.org, Office for Research Development and Education, URL https://freestatistics.org/blog/index.php?pk=169240, Retrieved Sun, 28 Apr 2024 15:35:48 +0000
QR Codes:

Original text written by user:
IsPrivate?No (this computation is public)
User-defined keywordsBlij Arnaud
Estimated Impact122
Family? (F = Feedback message, R = changed R code, M = changed R Module, P = changed Parameters, D = changed Data)
-       [(Partial) Autocorrelation Function] [Tijdreeks A - Sta...] [2012-08-12 13:23:14] [50083fea611f0183deb36cab794727ad] [Current]
Feedback Forum

Post a new message
Dataseries X:
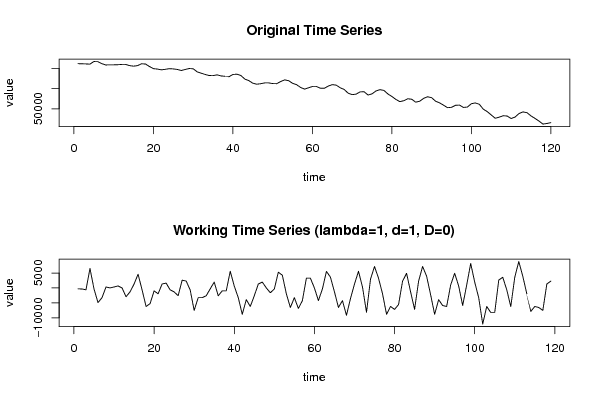
161949
161634
161287
160652
167176
166856
161949
158687
159007
159007
159323
159990
159990
157043
155745
157043
161634
160967
154763
149510
148527
146563
147892
149510
148874
147545
144950
147545
149856
149190
141656
138394
135132
132505
132190
134150
131523
130541
129559
135132
135768
132505
123670
119745
113541
110910
112208
114172
114172
112559
112208
117465
121710
119745
113190
109932
103061
98817
102079
105341
105341
101097
100781
106319
109932
108630
102079
97835
88652
85075
86372
91946
92261
84092
87039
94226
97488
95523
86692
80484
73297
67724
70004
74910
73613
66426
68706
75893
79821
77541
68706
64782
58893
52684
53666
58573
59208
53319
54302
62502
64462
61173
49075
42871
34671
26502
29129
32706
32075
25835
29444
38280
42204
40244
32391
26186
19631
12093
13427
15707


Summary of computational transaction
Raw Inputview raw input (R code)
Raw Outputview raw output of R engine
Computing time2 seconds
R Server'Gwilym Jenkins' @ jenkins.wessa.net

\begin{tabular}{lllllllll}
\hline
Summary of computational transaction \tabularnewline
Raw Input & view raw input (R code)  \tabularnewline
Raw Output & view raw output of R engine  \tabularnewline
Computing time & 2 seconds \tabularnewline
R Server & 'Gwilym Jenkins' @ jenkins.wessa.net \tabularnewline
\hline
\end{tabular}
%Source: https://freestatistics.org/blog/index.php?pk=169240&T=0

[TABLE]
[ROW][C]Summary of computational transaction[/C][/ROW]
[ROW][C]Raw Input[/C][C]view raw input (R code) [/C][/ROW]
[ROW][C]Raw Output[/C][C]view raw output of R engine [/C][/ROW]
[ROW][C]Computing time[/C][C]2 seconds[/C][/ROW]
[ROW][C]R Server[/C][C]'Gwilym Jenkins' @ jenkins.wessa.net[/C][/ROW]
[/TABLE]
Source: https://freestatistics.org/blog/index.php?pk=169240&T=0

Globally Unique Identifier (entire table): ba.freestatistics.org/blog/index.php?pk=169240&T=0

As an alternative you can also use a QR Code:  

The GUIDs for individual cells are displayed in the table below:

Summary of computational transaction
Raw Inputview raw input (R code)
Raw Outputview raw output of R engine
Computing time2 seconds
R Server'Gwilym Jenkins' @ jenkins.wessa.net


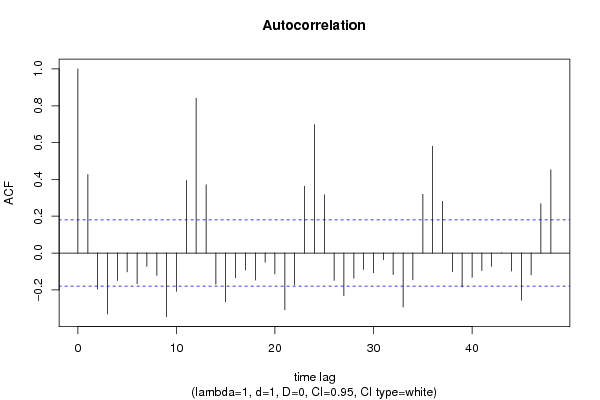
Autocorrelation Function
Time lag kACF(k)T-STATP-value
10.426074.64794e-06
2-0.195506-2.13270.017501
3-0.330459-3.60490.000229
4-0.149183-1.62740.05315
5-0.102223-1.11510.133522
6-0.166221-1.81330.036156
7-0.071815-0.78340.217471
8-0.121605-1.32660.093598
9-0.345616-3.77020.000128
10-0.207872-2.26760.012578
110.393574.29331.8e-05
120.8408279.17230
130.3706124.04294.7e-05
14-0.169606-1.85020.033384
15-0.265161-2.89260.002272
16-0.134742-1.46990.072119
17-0.091708-1.00040.15957
18-0.146358-1.59660.056506
19-0.050404-0.54980.29173
20-0.114018-1.24380.108012
21-0.307542-3.35490.000533
22-0.172873-1.88580.030878
230.3632493.96266.3e-05
240.6970537.6040
250.3169633.45770.000378
26-0.148583-1.62090.053848
27-0.231374-2.5240.00646
28-0.137049-1.4950.068777
29-0.089291-0.9740.166004
30-0.106973-1.16690.122785
31-0.035681-0.38920.348898
32-0.11683-1.27450.10249
33-0.293048-3.19680.00089
34-0.144943-1.58110.05825
350.3191273.48130.000349
360.5798526.32540
370.2807883.0630.001355
38-0.101997-1.11270.134049
39-0.184733-2.01520.023069
40-0.132138-1.44150.076041
41-0.094652-1.03250.151959
42-0.072658-0.79260.214791
430.0005220.00570.497734
44-0.097941-1.06840.143748
45-0.256523-2.79830.002997
46-0.117861-1.28570.10052
470.2680672.92430.002067
480.4522744.93371e-06

\begin{tabular}{lllllllll}
\hline
Autocorrelation Function \tabularnewline
Time lag k & ACF(k) & T-STAT & P-value \tabularnewline
1 & 0.42607 & 4.6479 & 4e-06 \tabularnewline
2 & -0.195506 & -2.1327 & 0.017501 \tabularnewline
3 & -0.330459 & -3.6049 & 0.000229 \tabularnewline
4 & -0.149183 & -1.6274 & 0.05315 \tabularnewline
5 & -0.102223 & -1.1151 & 0.133522 \tabularnewline
6 & -0.166221 & -1.8133 & 0.036156 \tabularnewline
7 & -0.071815 & -0.7834 & 0.217471 \tabularnewline
8 & -0.121605 & -1.3266 & 0.093598 \tabularnewline
9 & -0.345616 & -3.7702 & 0.000128 \tabularnewline
10 & -0.207872 & -2.2676 & 0.012578 \tabularnewline
11 & 0.39357 & 4.2933 & 1.8e-05 \tabularnewline
12 & 0.840827 & 9.1723 & 0 \tabularnewline
13 & 0.370612 & 4.0429 & 4.7e-05 \tabularnewline
14 & -0.169606 & -1.8502 & 0.033384 \tabularnewline
15 & -0.265161 & -2.8926 & 0.002272 \tabularnewline
16 & -0.134742 & -1.4699 & 0.072119 \tabularnewline
17 & -0.091708 & -1.0004 & 0.15957 \tabularnewline
18 & -0.146358 & -1.5966 & 0.056506 \tabularnewline
19 & -0.050404 & -0.5498 & 0.29173 \tabularnewline
20 & -0.114018 & -1.2438 & 0.108012 \tabularnewline
21 & -0.307542 & -3.3549 & 0.000533 \tabularnewline
22 & -0.172873 & -1.8858 & 0.030878 \tabularnewline
23 & 0.363249 & 3.9626 & 6.3e-05 \tabularnewline
24 & 0.697053 & 7.604 & 0 \tabularnewline
25 & 0.316963 & 3.4577 & 0.000378 \tabularnewline
26 & -0.148583 & -1.6209 & 0.053848 \tabularnewline
27 & -0.231374 & -2.524 & 0.00646 \tabularnewline
28 & -0.137049 & -1.495 & 0.068777 \tabularnewline
29 & -0.089291 & -0.974 & 0.166004 \tabularnewline
30 & -0.106973 & -1.1669 & 0.122785 \tabularnewline
31 & -0.035681 & -0.3892 & 0.348898 \tabularnewline
32 & -0.11683 & -1.2745 & 0.10249 \tabularnewline
33 & -0.293048 & -3.1968 & 0.00089 \tabularnewline
34 & -0.144943 & -1.5811 & 0.05825 \tabularnewline
35 & 0.319127 & 3.4813 & 0.000349 \tabularnewline
36 & 0.579852 & 6.3254 & 0 \tabularnewline
37 & 0.280788 & 3.063 & 0.001355 \tabularnewline
38 & -0.101997 & -1.1127 & 0.134049 \tabularnewline
39 & -0.184733 & -2.0152 & 0.023069 \tabularnewline
40 & -0.132138 & -1.4415 & 0.076041 \tabularnewline
41 & -0.094652 & -1.0325 & 0.151959 \tabularnewline
42 & -0.072658 & -0.7926 & 0.214791 \tabularnewline
43 & 0.000522 & 0.0057 & 0.497734 \tabularnewline
44 & -0.097941 & -1.0684 & 0.143748 \tabularnewline
45 & -0.256523 & -2.7983 & 0.002997 \tabularnewline
46 & -0.117861 & -1.2857 & 0.10052 \tabularnewline
47 & 0.268067 & 2.9243 & 0.002067 \tabularnewline
48 & 0.452274 & 4.9337 & 1e-06 \tabularnewline
\hline
\end{tabular}
%Source: https://freestatistics.org/blog/index.php?pk=169240&T=1

[TABLE]
[ROW][C]Autocorrelation Function[/C][/ROW]
[ROW][C]Time lag k[/C][C]ACF(k)[/C][C]T-STAT[/C][C]P-value[/C][/ROW]
[ROW][C]1[/C][C]0.42607[/C][C]4.6479[/C][C]4e-06[/C][/ROW]
[ROW][C]2[/C][C]-0.195506[/C][C]-2.1327[/C][C]0.017501[/C][/ROW]
[ROW][C]3[/C][C]-0.330459[/C][C]-3.6049[/C][C]0.000229[/C][/ROW]
[ROW][C]4[/C][C]-0.149183[/C][C]-1.6274[/C][C]0.05315[/C][/ROW]
[ROW][C]5[/C][C]-0.102223[/C][C]-1.1151[/C][C]0.133522[/C][/ROW]
[ROW][C]6[/C][C]-0.166221[/C][C]-1.8133[/C][C]0.036156[/C][/ROW]
[ROW][C]7[/C][C]-0.071815[/C][C]-0.7834[/C][C]0.217471[/C][/ROW]
[ROW][C]8[/C][C]-0.121605[/C][C]-1.3266[/C][C]0.093598[/C][/ROW]
[ROW][C]9[/C][C]-0.345616[/C][C]-3.7702[/C][C]0.000128[/C][/ROW]
[ROW][C]10[/C][C]-0.207872[/C][C]-2.2676[/C][C]0.012578[/C][/ROW]
[ROW][C]11[/C][C]0.39357[/C][C]4.2933[/C][C]1.8e-05[/C][/ROW]
[ROW][C]12[/C][C]0.840827[/C][C]9.1723[/C][C]0[/C][/ROW]
[ROW][C]13[/C][C]0.370612[/C][C]4.0429[/C][C]4.7e-05[/C][/ROW]
[ROW][C]14[/C][C]-0.169606[/C][C]-1.8502[/C][C]0.033384[/C][/ROW]
[ROW][C]15[/C][C]-0.265161[/C][C]-2.8926[/C][C]0.002272[/C][/ROW]
[ROW][C]16[/C][C]-0.134742[/C][C]-1.4699[/C][C]0.072119[/C][/ROW]
[ROW][C]17[/C][C]-0.091708[/C][C]-1.0004[/C][C]0.15957[/C][/ROW]
[ROW][C]18[/C][C]-0.146358[/C][C]-1.5966[/C][C]0.056506[/C][/ROW]
[ROW][C]19[/C][C]-0.050404[/C][C]-0.5498[/C][C]0.29173[/C][/ROW]
[ROW][C]20[/C][C]-0.114018[/C][C]-1.2438[/C][C]0.108012[/C][/ROW]
[ROW][C]21[/C][C]-0.307542[/C][C]-3.3549[/C][C]0.000533[/C][/ROW]
[ROW][C]22[/C][C]-0.172873[/C][C]-1.8858[/C][C]0.030878[/C][/ROW]
[ROW][C]23[/C][C]0.363249[/C][C]3.9626[/C][C]6.3e-05[/C][/ROW]
[ROW][C]24[/C][C]0.697053[/C][C]7.604[/C][C]0[/C][/ROW]
[ROW][C]25[/C][C]0.316963[/C][C]3.4577[/C][C]0.000378[/C][/ROW]
[ROW][C]26[/C][C]-0.148583[/C][C]-1.6209[/C][C]0.053848[/C][/ROW]
[ROW][C]27[/C][C]-0.231374[/C][C]-2.524[/C][C]0.00646[/C][/ROW]
[ROW][C]28[/C][C]-0.137049[/C][C]-1.495[/C][C]0.068777[/C][/ROW]
[ROW][C]29[/C][C]-0.089291[/C][C]-0.974[/C][C]0.166004[/C][/ROW]
[ROW][C]30[/C][C]-0.106973[/C][C]-1.1669[/C][C]0.122785[/C][/ROW]
[ROW][C]31[/C][C]-0.035681[/C][C]-0.3892[/C][C]0.348898[/C][/ROW]
[ROW][C]32[/C][C]-0.11683[/C][C]-1.2745[/C][C]0.10249[/C][/ROW]
[ROW][C]33[/C][C]-0.293048[/C][C]-3.1968[/C][C]0.00089[/C][/ROW]
[ROW][C]34[/C][C]-0.144943[/C][C]-1.5811[/C][C]0.05825[/C][/ROW]
[ROW][C]35[/C][C]0.319127[/C][C]3.4813[/C][C]0.000349[/C][/ROW]
[ROW][C]36[/C][C]0.579852[/C][C]6.3254[/C][C]0[/C][/ROW]
[ROW][C]37[/C][C]0.280788[/C][C]3.063[/C][C]0.001355[/C][/ROW]
[ROW][C]38[/C][C]-0.101997[/C][C]-1.1127[/C][C]0.134049[/C][/ROW]
[ROW][C]39[/C][C]-0.184733[/C][C]-2.0152[/C][C]0.023069[/C][/ROW]
[ROW][C]40[/C][C]-0.132138[/C][C]-1.4415[/C][C]0.076041[/C][/ROW]
[ROW][C]41[/C][C]-0.094652[/C][C]-1.0325[/C][C]0.151959[/C][/ROW]
[ROW][C]42[/C][C]-0.072658[/C][C]-0.7926[/C][C]0.214791[/C][/ROW]
[ROW][C]43[/C][C]0.000522[/C][C]0.0057[/C][C]0.497734[/C][/ROW]
[ROW][C]44[/C][C]-0.097941[/C][C]-1.0684[/C][C]0.143748[/C][/ROW]
[ROW][C]45[/C][C]-0.256523[/C][C]-2.7983[/C][C]0.002997[/C][/ROW]
[ROW][C]46[/C][C]-0.117861[/C][C]-1.2857[/C][C]0.10052[/C][/ROW]
[ROW][C]47[/C][C]0.268067[/C][C]2.9243[/C][C]0.002067[/C][/ROW]
[ROW][C]48[/C][C]0.452274[/C][C]4.9337[/C][C]1e-06[/C][/ROW]
[/TABLE]
Source: https://freestatistics.org/blog/index.php?pk=169240&T=1

Globally Unique Identifier (entire table): ba.freestatistics.org/blog/index.php?pk=169240&T=1

As an alternative you can also use a QR Code:  

The GUIDs for individual cells are displayed in the table below:

Autocorrelation Function
Time lag kACF(k)T-STATP-value
10.426074.64794e-06
2-0.195506-2.13270.017501
3-0.330459-3.60490.000229
4-0.149183-1.62740.05315
5-0.102223-1.11510.133522
6-0.166221-1.81330.036156
7-0.071815-0.78340.217471
8-0.121605-1.32660.093598
9-0.345616-3.77020.000128
10-0.207872-2.26760.012578
110.393574.29331.8e-05
120.8408279.17230
130.3706124.04294.7e-05
14-0.169606-1.85020.033384
15-0.265161-2.89260.002272
16-0.134742-1.46990.072119
17-0.091708-1.00040.15957
18-0.146358-1.59660.056506
19-0.050404-0.54980.29173
20-0.114018-1.24380.108012
21-0.307542-3.35490.000533
22-0.172873-1.88580.030878
230.3632493.96266.3e-05
240.6970537.6040
250.3169633.45770.000378
26-0.148583-1.62090.053848
27-0.231374-2.5240.00646
28-0.137049-1.4950.068777
29-0.089291-0.9740.166004
30-0.106973-1.16690.122785
31-0.035681-0.38920.348898
32-0.11683-1.27450.10249
33-0.293048-3.19680.00089
34-0.144943-1.58110.05825
350.3191273.48130.000349
360.5798526.32540
370.2807883.0630.001355
38-0.101997-1.11270.134049
39-0.184733-2.01520.023069
40-0.132138-1.44150.076041
41-0.094652-1.03250.151959
42-0.072658-0.79260.214791
430.0005220.00570.497734
44-0.097941-1.06840.143748
45-0.256523-2.79830.002997
46-0.117861-1.28570.10052
470.2680672.92430.002067
480.4522744.93371e-06


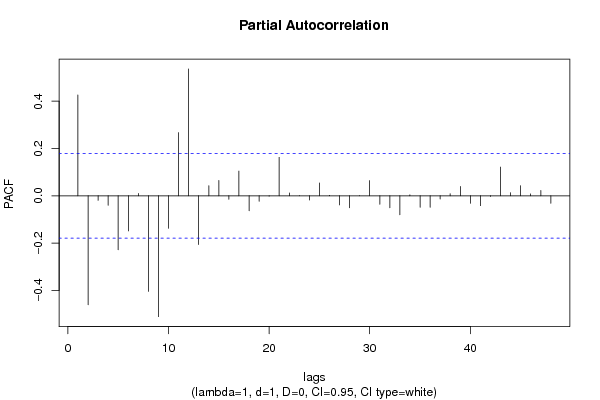
Partial Autocorrelation Function
Time lag kPACF(k)T-STATP-value
10.426074.64794e-06
2-0.460668-5.02531e-06
3-0.019403-0.21170.416368
4-0.040202-0.43860.330889
5-0.228247-2.48990.00708
6-0.148697-1.62210.053716
70.0096630.10540.458115
8-0.404232-4.40971.1e-05
9-0.511248-5.57710
10-0.137255-1.49730.068484
110.2669642.91220.002143
120.5362765.85010
13-0.206385-2.25140.013098
140.0424510.46310.322075
150.0645590.70430.241324
16-0.015047-0.16410.434949
170.1042311.1370.128907
18-0.063433-0.6920.245151
19-0.02337-0.25490.399607
20-0.001753-0.01910.492389
210.162371.77130.039539
220.0120360.13130.447883
238.8e-050.0010.499618
24-0.018075-0.19720.422013
250.0539670.58870.278587
260.0016970.01850.492629
27-0.038531-0.42030.337503
28-0.050618-0.55220.290933
292.8e-053e-040.499878
300.064070.69890.242982
31-0.035994-0.39270.34764
32-0.051019-0.55660.289439
33-0.08071-0.88040.190198
340.0036960.04030.483954
35-0.048951-0.5340.297172
36-0.04833-0.52720.299511
37-0.013389-0.14610.44206
380.0087950.09590.461865
390.039250.42820.334654
40-0.032054-0.34970.363602
41-0.041643-0.45430.325231
42-0.003121-0.0340.48645
430.1212961.32320.094155
440.0128610.14030.444333
450.0421860.46020.323107
460.0078620.08580.465898
470.0223760.24410.40379
48-0.031581-0.34450.365538

\begin{tabular}{lllllllll}
\hline
Partial Autocorrelation Function \tabularnewline
Time lag k & PACF(k) & T-STAT & P-value \tabularnewline
1 & 0.42607 & 4.6479 & 4e-06 \tabularnewline
2 & -0.460668 & -5.0253 & 1e-06 \tabularnewline
3 & -0.019403 & -0.2117 & 0.416368 \tabularnewline
4 & -0.040202 & -0.4386 & 0.330889 \tabularnewline
5 & -0.228247 & -2.4899 & 0.00708 \tabularnewline
6 & -0.148697 & -1.6221 & 0.053716 \tabularnewline
7 & 0.009663 & 0.1054 & 0.458115 \tabularnewline
8 & -0.404232 & -4.4097 & 1.1e-05 \tabularnewline
9 & -0.511248 & -5.5771 & 0 \tabularnewline
10 & -0.137255 & -1.4973 & 0.068484 \tabularnewline
11 & 0.266964 & 2.9122 & 0.002143 \tabularnewline
12 & 0.536276 & 5.8501 & 0 \tabularnewline
13 & -0.206385 & -2.2514 & 0.013098 \tabularnewline
14 & 0.042451 & 0.4631 & 0.322075 \tabularnewline
15 & 0.064559 & 0.7043 & 0.241324 \tabularnewline
16 & -0.015047 & -0.1641 & 0.434949 \tabularnewline
17 & 0.104231 & 1.137 & 0.128907 \tabularnewline
18 & -0.063433 & -0.692 & 0.245151 \tabularnewline
19 & -0.02337 & -0.2549 & 0.399607 \tabularnewline
20 & -0.001753 & -0.0191 & 0.492389 \tabularnewline
21 & 0.16237 & 1.7713 & 0.039539 \tabularnewline
22 & 0.012036 & 0.1313 & 0.447883 \tabularnewline
23 & 8.8e-05 & 0.001 & 0.499618 \tabularnewline
24 & -0.018075 & -0.1972 & 0.422013 \tabularnewline
25 & 0.053967 & 0.5887 & 0.278587 \tabularnewline
26 & 0.001697 & 0.0185 & 0.492629 \tabularnewline
27 & -0.038531 & -0.4203 & 0.337503 \tabularnewline
28 & -0.050618 & -0.5522 & 0.290933 \tabularnewline
29 & 2.8e-05 & 3e-04 & 0.499878 \tabularnewline
30 & 0.06407 & 0.6989 & 0.242982 \tabularnewline
31 & -0.035994 & -0.3927 & 0.34764 \tabularnewline
32 & -0.051019 & -0.5566 & 0.289439 \tabularnewline
33 & -0.08071 & -0.8804 & 0.190198 \tabularnewline
34 & 0.003696 & 0.0403 & 0.483954 \tabularnewline
35 & -0.048951 & -0.534 & 0.297172 \tabularnewline
36 & -0.04833 & -0.5272 & 0.299511 \tabularnewline
37 & -0.013389 & -0.1461 & 0.44206 \tabularnewline
38 & 0.008795 & 0.0959 & 0.461865 \tabularnewline
39 & 0.03925 & 0.4282 & 0.334654 \tabularnewline
40 & -0.032054 & -0.3497 & 0.363602 \tabularnewline
41 & -0.041643 & -0.4543 & 0.325231 \tabularnewline
42 & -0.003121 & -0.034 & 0.48645 \tabularnewline
43 & 0.121296 & 1.3232 & 0.094155 \tabularnewline
44 & 0.012861 & 0.1403 & 0.444333 \tabularnewline
45 & 0.042186 & 0.4602 & 0.323107 \tabularnewline
46 & 0.007862 & 0.0858 & 0.465898 \tabularnewline
47 & 0.022376 & 0.2441 & 0.40379 \tabularnewline
48 & -0.031581 & -0.3445 & 0.365538 \tabularnewline
\hline
\end{tabular}
%Source: https://freestatistics.org/blog/index.php?pk=169240&T=2

[TABLE]
[ROW][C]Partial Autocorrelation Function[/C][/ROW]
[ROW][C]Time lag k[/C][C]PACF(k)[/C][C]T-STAT[/C][C]P-value[/C][/ROW]
[ROW][C]1[/C][C]0.42607[/C][C]4.6479[/C][C]4e-06[/C][/ROW]
[ROW][C]2[/C][C]-0.460668[/C][C]-5.0253[/C][C]1e-06[/C][/ROW]
[ROW][C]3[/C][C]-0.019403[/C][C]-0.2117[/C][C]0.416368[/C][/ROW]
[ROW][C]4[/C][C]-0.040202[/C][C]-0.4386[/C][C]0.330889[/C][/ROW]
[ROW][C]5[/C][C]-0.228247[/C][C]-2.4899[/C][C]0.00708[/C][/ROW]
[ROW][C]6[/C][C]-0.148697[/C][C]-1.6221[/C][C]0.053716[/C][/ROW]
[ROW][C]7[/C][C]0.009663[/C][C]0.1054[/C][C]0.458115[/C][/ROW]
[ROW][C]8[/C][C]-0.404232[/C][C]-4.4097[/C][C]1.1e-05[/C][/ROW]
[ROW][C]9[/C][C]-0.511248[/C][C]-5.5771[/C][C]0[/C][/ROW]
[ROW][C]10[/C][C]-0.137255[/C][C]-1.4973[/C][C]0.068484[/C][/ROW]
[ROW][C]11[/C][C]0.266964[/C][C]2.9122[/C][C]0.002143[/C][/ROW]
[ROW][C]12[/C][C]0.536276[/C][C]5.8501[/C][C]0[/C][/ROW]
[ROW][C]13[/C][C]-0.206385[/C][C]-2.2514[/C][C]0.013098[/C][/ROW]
[ROW][C]14[/C][C]0.042451[/C][C]0.4631[/C][C]0.322075[/C][/ROW]
[ROW][C]15[/C][C]0.064559[/C][C]0.7043[/C][C]0.241324[/C][/ROW]
[ROW][C]16[/C][C]-0.015047[/C][C]-0.1641[/C][C]0.434949[/C][/ROW]
[ROW][C]17[/C][C]0.104231[/C][C]1.137[/C][C]0.128907[/C][/ROW]
[ROW][C]18[/C][C]-0.063433[/C][C]-0.692[/C][C]0.245151[/C][/ROW]
[ROW][C]19[/C][C]-0.02337[/C][C]-0.2549[/C][C]0.399607[/C][/ROW]
[ROW][C]20[/C][C]-0.001753[/C][C]-0.0191[/C][C]0.492389[/C][/ROW]
[ROW][C]21[/C][C]0.16237[/C][C]1.7713[/C][C]0.039539[/C][/ROW]
[ROW][C]22[/C][C]0.012036[/C][C]0.1313[/C][C]0.447883[/C][/ROW]
[ROW][C]23[/C][C]8.8e-05[/C][C]0.001[/C][C]0.499618[/C][/ROW]
[ROW][C]24[/C][C]-0.018075[/C][C]-0.1972[/C][C]0.422013[/C][/ROW]
[ROW][C]25[/C][C]0.053967[/C][C]0.5887[/C][C]0.278587[/C][/ROW]
[ROW][C]26[/C][C]0.001697[/C][C]0.0185[/C][C]0.492629[/C][/ROW]
[ROW][C]27[/C][C]-0.038531[/C][C]-0.4203[/C][C]0.337503[/C][/ROW]
[ROW][C]28[/C][C]-0.050618[/C][C]-0.5522[/C][C]0.290933[/C][/ROW]
[ROW][C]29[/C][C]2.8e-05[/C][C]3e-04[/C][C]0.499878[/C][/ROW]
[ROW][C]30[/C][C]0.06407[/C][C]0.6989[/C][C]0.242982[/C][/ROW]
[ROW][C]31[/C][C]-0.035994[/C][C]-0.3927[/C][C]0.34764[/C][/ROW]
[ROW][C]32[/C][C]-0.051019[/C][C]-0.5566[/C][C]0.289439[/C][/ROW]
[ROW][C]33[/C][C]-0.08071[/C][C]-0.8804[/C][C]0.190198[/C][/ROW]
[ROW][C]34[/C][C]0.003696[/C][C]0.0403[/C][C]0.483954[/C][/ROW]
[ROW][C]35[/C][C]-0.048951[/C][C]-0.534[/C][C]0.297172[/C][/ROW]
[ROW][C]36[/C][C]-0.04833[/C][C]-0.5272[/C][C]0.299511[/C][/ROW]
[ROW][C]37[/C][C]-0.013389[/C][C]-0.1461[/C][C]0.44206[/C][/ROW]
[ROW][C]38[/C][C]0.008795[/C][C]0.0959[/C][C]0.461865[/C][/ROW]
[ROW][C]39[/C][C]0.03925[/C][C]0.4282[/C][C]0.334654[/C][/ROW]
[ROW][C]40[/C][C]-0.032054[/C][C]-0.3497[/C][C]0.363602[/C][/ROW]
[ROW][C]41[/C][C]-0.041643[/C][C]-0.4543[/C][C]0.325231[/C][/ROW]
[ROW][C]42[/C][C]-0.003121[/C][C]-0.034[/C][C]0.48645[/C][/ROW]
[ROW][C]43[/C][C]0.121296[/C][C]1.3232[/C][C]0.094155[/C][/ROW]
[ROW][C]44[/C][C]0.012861[/C][C]0.1403[/C][C]0.444333[/C][/ROW]
[ROW][C]45[/C][C]0.042186[/C][C]0.4602[/C][C]0.323107[/C][/ROW]
[ROW][C]46[/C][C]0.007862[/C][C]0.0858[/C][C]0.465898[/C][/ROW]
[ROW][C]47[/C][C]0.022376[/C][C]0.2441[/C][C]0.40379[/C][/ROW]
[ROW][C]48[/C][C]-0.031581[/C][C]-0.3445[/C][C]0.365538[/C][/ROW]
[/TABLE]
Source: https://freestatistics.org/blog/index.php?pk=169240&T=2

Globally Unique Identifier (entire table): ba.freestatistics.org/blog/index.php?pk=169240&T=2

As an alternative you can also use a QR Code:  

The GUIDs for individual cells are displayed in the table below:

Partial Autocorrelation Function
Time lag kPACF(k)T-STATP-value
10.426074.64794e-06
2-0.460668-5.02531e-06
3-0.019403-0.21170.416368
4-0.040202-0.43860.330889
5-0.228247-2.48990.00708
6-0.148697-1.62210.053716
70.0096630.10540.458115
8-0.404232-4.40971.1e-05
9-0.511248-5.57710
10-0.137255-1.49730.068484
110.2669642.91220.002143
120.5362765.85010
13-0.206385-2.25140.013098
140.0424510.46310.322075
150.0645590.70430.241324
16-0.015047-0.16410.434949
170.1042311.1370.128907
18-0.063433-0.6920.245151
19-0.02337-0.25490.399607
20-0.001753-0.01910.492389
210.162371.77130.039539
220.0120360.13130.447883
238.8e-050.0010.499618
24-0.018075-0.19720.422013
250.0539670.58870.278587
260.0016970.01850.492629
27-0.038531-0.42030.337503
28-0.050618-0.55220.290933
292.8e-053e-040.499878
300.064070.69890.242982
31-0.035994-0.39270.34764
32-0.051019-0.55660.289439
33-0.08071-0.88040.190198
340.0036960.04030.483954
35-0.048951-0.5340.297172
36-0.04833-0.52720.299511
37-0.013389-0.14610.44206
380.0087950.09590.461865
390.039250.42820.334654
40-0.032054-0.34970.363602
41-0.041643-0.45430.325231
42-0.003121-0.0340.48645
430.1212961.32320.094155
440.0128610.14030.444333
450.0421860.46020.323107
460.0078620.08580.465898
470.0223760.24410.40379
48-0.031581-0.34450.365538


Parameters (Session):
par1 = 48 ; par2 = 1 ; par3 = 1 ; par4 = 0 ; par5 = 12 ; par6 = White Noise ; par7 = 0.95 ;
Parameters (R input):
par1 = 48 ; par2 = 1 ; par3 = 1 ; par4 = 0 ; par5 = 12 ; par6 = White Noise ; par7 = 0.95 ; par8 = ;
R code (references can be found in the software module):
if (par1 == 'Default') {
par1 = 10*log10(length(x))
} else {
par1 <- as.numeric(par1)
}
par2 <- as.numeric(par2)
par3 <- as.numeric(par3)
par4 <- as.numeric(par4)
par5 <- as.numeric(par5)
if (par6 == 'White Noise') par6 <- 'white' else par6 <- 'ma'
par7 <- as.numeric(par7)
if (par8 != '') par8 <- as.numeric(par8)
ox <- x
if (par8 == '') {
if (par2 == 0) {
x <- log(x)
} else {
x <- (x ^ par2 - 1) / par2
}
} else {
x <- log(x,base=par8)
}
if (par3 > 0) x <- diff(x,lag=1,difference=par3)
if (par4 > 0) x <- diff(x,lag=par5,difference=par4)
bitmap(file='picts.png')
op <- par(mfrow=c(2,1))
plot(ox,type='l',main='Original Time Series',xlab='time',ylab='value')
if (par8=='') {
mytitle <- paste('Working Time Series (lambda=',par2,', d=',par3,', D=',par4,')',sep='')
mysub <- paste('(lambda=',par2,', d=',par3,', D=',par4,', CI=', par7, ', CI type=',par6,')',sep='')
} else {
mytitle <- paste('Working Time Series (base=',par8,', d=',par3,', D=',par4,')',sep='')
mysub <- paste('(base=',par8,', d=',par3,', D=',par4,', CI=', par7, ', CI type=',par6,')',sep='')
}
plot(x,type='l', main=mytitle,xlab='time',ylab='value')
par(op)
dev.off()
bitmap(file='pic1.png')
racf <- acf(x, par1, main='Autocorrelation', xlab='time lag', ylab='ACF', ci.type=par6, ci=par7, sub=mysub)
dev.off()
bitmap(file='pic2.png')
rpacf <- pacf(x,par1,main='Partial Autocorrelation',xlab='lags',ylab='PACF',sub=mysub)
dev.off()
(myacf <- c(racf$acf))
(mypacf <- c(rpacf$acf))
lengthx <- length(x)
sqrtn <- sqrt(lengthx)
load(file='createtable')
a<-table.start()
a<-table.row.start(a)
a<-table.element(a,'Autocorrelation Function',4,TRUE)
a<-table.row.end(a)
a<-table.row.start(a)
a<-table.element(a,'Time lag k',header=TRUE)
a<-table.element(a,hyperlink('basics.htm','ACF(k)','click here for more information about the Autocorrelation Function'),header=TRUE)
a<-table.element(a,'T-STAT',header=TRUE)
a<-table.element(a,'P-value',header=TRUE)
a<-table.row.end(a)
for (i in 2:(par1+1)) {
a<-table.row.start(a)
a<-table.element(a,i-1,header=TRUE)
a<-table.element(a,round(myacf[i],6))
mytstat <- myacf[i]*sqrtn
a<-table.element(a,round(mytstat,4))
a<-table.element(a,round(1-pt(abs(mytstat),lengthx),6))
a<-table.row.end(a)
}
a<-table.end(a)
table.save(a,file='mytable.tab')
a<-table.start()
a<-table.row.start(a)
a<-table.element(a,'Partial Autocorrelation Function',4,TRUE)
a<-table.row.end(a)
a<-table.row.start(a)
a<-table.element(a,'Time lag k',header=TRUE)
a<-table.element(a,hyperlink('basics.htm','PACF(k)','click here for more information about the Partial Autocorrelation Function'),header=TRUE)
a<-table.element(a,'T-STAT',header=TRUE)
a<-table.element(a,'P-value',header=TRUE)
a<-table.row.end(a)
for (i in 1:par1) {
a<-table.row.start(a)
a<-table.element(a,i,header=TRUE)
a<-table.element(a,round(mypacf[i],6))
mytstat <- mypacf[i]*sqrtn
a<-table.element(a,round(mytstat,4))
a<-table.element(a,round(1-pt(abs(mytstat),lengthx),6))
a<-table.row.end(a)
}
a<-table.end(a)
table.save(a,file='mytable1.tab')