Free Statistics

of Irreproducible Research!

Author's title

Author*Unverified author*
R Software Modulerwasp_autocorrelation.wasp
Title produced by software(Partial) Autocorrelation Function
Date of computationSun, 12 Aug 2012 09:20:13 -0400
Cite this page as followsStatistical Computations at FreeStatistics.org, Office for Research Development and Education, URL https://freestatistics.org/blog/index.php?v=date/2012/Aug/12/t134477765071dbiu08xb7ej14.htm/, Retrieved Sat, 27 Apr 2024 13:19:46 +0000
Statistical Computations at FreeStatistics.org, Office for Research Development and Education, URL https://freestatistics.org/blog/index.php?pk=169239, Retrieved Sat, 27 Apr 2024 13:19:46 +0000
QR Codes:

Original text written by user:
IsPrivate?No (this computation is public)
User-defined keywordsVan der Smissen Britt
Estimated Impact117
Family? (F = Feedback message, R = changed R code, M = changed R Module, P = changed Parameters, D = changed Data)
-       [(Partial) Autocorrelation Function] [tijdreeks A-Stap 21] [2012-08-12 13:20:13] [b3616d670e39c9c081ac68ec1f5d1a32] [Current]
Feedback Forum

Post a new message
Dataseries X:
95870
95523
95208
94541
101097
100781
95870
92581
92928
92928
93244
93910
93559
96190
97172
96190
99799
97488
92261
90964
90964
91599
89004
90964
89319
90964
93559
94541
96852
95870
89981
87670
86692
87670
86057
86692
84728
88021
89635
89981
96190
96190
88021
86057
86057
87039
82764
80799
78524
79186
82133
79821
86057
87039
80799
78524
77221
78524
74910
73613
68390
69688
70004
70355
76559
75893
68390
65097
63799
65444
59208
54964
47115
47777
47777
47115
52684
53004
46448
45151
42524
46133
39577
35653
28146
29764
27800
28462
33373
34355
31093
30742
30742
35017
27484
22573
14058
20929
19946
20293
28146
27164
23555
25204
25204
31093
24222
20293
14058
22258
21595
21911
28782
28146
25835
26186
27800
31409
25835
21275


Summary of computational transaction
Raw Inputview raw input (R code)
Raw Outputview raw output of R engine
Computing time3 seconds
R Server'Herman Ole Andreas Wold' @ wold.wessa.net

\begin{tabular}{lllllllll}
\hline
Summary of computational transaction \tabularnewline
Raw Input & view raw input (R code)  \tabularnewline
Raw Output & view raw output of R engine  \tabularnewline
Computing time & 3 seconds \tabularnewline
R Server & 'Herman Ole Andreas Wold' @ wold.wessa.net \tabularnewline
\hline
\end{tabular}
%Source: https://freestatistics.org/blog/index.php?pk=169239&T=0

[TABLE]
[ROW][C]Summary of computational transaction[/C][/ROW]
[ROW][C]Raw Input[/C][C]view raw input (R code) [/C][/ROW]
[ROW][C]Raw Output[/C][C]view raw output of R engine [/C][/ROW]
[ROW][C]Computing time[/C][C]3 seconds[/C][/ROW]
[ROW][C]R Server[/C][C]'Herman Ole Andreas Wold' @ wold.wessa.net[/C][/ROW]
[/TABLE]
Source: https://freestatistics.org/blog/index.php?pk=169239&T=0

Globally Unique Identifier (entire table): ba.freestatistics.org/blog/index.php?pk=169239&T=0

As an alternative you can also use a QR Code:  

The GUIDs for individual cells are displayed in the table below:

Summary of computational transaction
Raw Inputview raw input (R code)
Raw Outputview raw output of R engine
Computing time3 seconds
R Server'Herman Ole Andreas Wold' @ wold.wessa.net


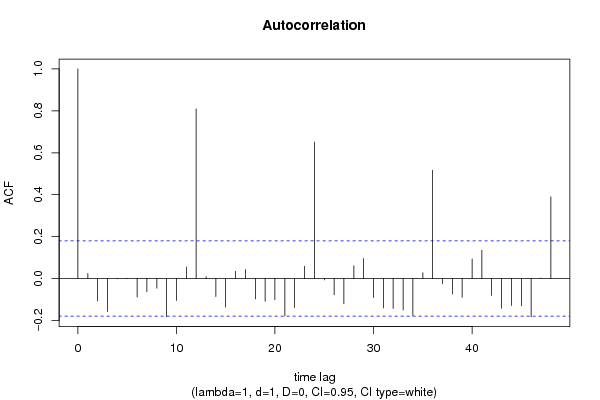
Autocorrelation Function
Time lag kACF(k)T-STATP-value
10.0242040.2640.396104
2-0.106802-1.16510.123161
3-0.157459-1.71770.044228
4-0.001113-0.01210.495164
5-0.000764-0.00830.496683
6-0.08838-0.96410.168472
7-0.063443-0.69210.245119
8-0.045694-0.49850.30954
9-0.181703-1.98210.024884
10-0.10522-1.14780.126674
110.055450.60490.273203
120.8093268.82870
130.0086370.09420.462545
14-0.086148-0.93980.174621
15-0.136296-1.48680.069854
160.0342920.37410.354505
170.0424680.46330.322008
18-0.09718-1.06010.145621
19-0.108473-1.18330.119524
20-0.101546-1.10770.135106
21-0.178554-1.94780.026898
22-0.138415-1.50990.066856
230.0585510.63870.262118
240.6507767.09910
25-0.006397-0.06980.472244
26-0.077644-0.8470.19935
27-0.120515-1.31470.095575
280.0613890.66970.252183
290.0959231.04640.148751
30-0.090925-0.99190.161634
31-0.14015-1.52890.064478
32-0.142963-1.55950.060762
33-0.149837-1.63450.052395
34-0.176595-1.92640.028218
350.0276110.30120.381892
360.5166625.63610
37-0.025188-0.27480.391987
38-0.073699-0.8040.211513
39-0.089168-0.97270.166335
400.093471.01960.154984
410.135351.47650.071226
42-0.079583-0.86810.19353
43-0.141536-1.5440.062625
44-0.128481-1.40160.081824
45-0.129912-1.41720.079523
46-0.181874-1.9840.024779
470.0009420.01030.495908
480.3897034.25122.1e-05

\begin{tabular}{lllllllll}
\hline
Autocorrelation Function \tabularnewline
Time lag k & ACF(k) & T-STAT & P-value \tabularnewline
1 & 0.024204 & 0.264 & 0.396104 \tabularnewline
2 & -0.106802 & -1.1651 & 0.123161 \tabularnewline
3 & -0.157459 & -1.7177 & 0.044228 \tabularnewline
4 & -0.001113 & -0.0121 & 0.495164 \tabularnewline
5 & -0.000764 & -0.0083 & 0.496683 \tabularnewline
6 & -0.08838 & -0.9641 & 0.168472 \tabularnewline
7 & -0.063443 & -0.6921 & 0.245119 \tabularnewline
8 & -0.045694 & -0.4985 & 0.30954 \tabularnewline
9 & -0.181703 & -1.9821 & 0.024884 \tabularnewline
10 & -0.10522 & -1.1478 & 0.126674 \tabularnewline
11 & 0.05545 & 0.6049 & 0.273203 \tabularnewline
12 & 0.809326 & 8.8287 & 0 \tabularnewline
13 & 0.008637 & 0.0942 & 0.462545 \tabularnewline
14 & -0.086148 & -0.9398 & 0.174621 \tabularnewline
15 & -0.136296 & -1.4868 & 0.069854 \tabularnewline
16 & 0.034292 & 0.3741 & 0.354505 \tabularnewline
17 & 0.042468 & 0.4633 & 0.322008 \tabularnewline
18 & -0.09718 & -1.0601 & 0.145621 \tabularnewline
19 & -0.108473 & -1.1833 & 0.119524 \tabularnewline
20 & -0.101546 & -1.1077 & 0.135106 \tabularnewline
21 & -0.178554 & -1.9478 & 0.026898 \tabularnewline
22 & -0.138415 & -1.5099 & 0.066856 \tabularnewline
23 & 0.058551 & 0.6387 & 0.262118 \tabularnewline
24 & 0.650776 & 7.0991 & 0 \tabularnewline
25 & -0.006397 & -0.0698 & 0.472244 \tabularnewline
26 & -0.077644 & -0.847 & 0.19935 \tabularnewline
27 & -0.120515 & -1.3147 & 0.095575 \tabularnewline
28 & 0.061389 & 0.6697 & 0.252183 \tabularnewline
29 & 0.095923 & 1.0464 & 0.148751 \tabularnewline
30 & -0.090925 & -0.9919 & 0.161634 \tabularnewline
31 & -0.14015 & -1.5289 & 0.064478 \tabularnewline
32 & -0.142963 & -1.5595 & 0.060762 \tabularnewline
33 & -0.149837 & -1.6345 & 0.052395 \tabularnewline
34 & -0.176595 & -1.9264 & 0.028218 \tabularnewline
35 & 0.027611 & 0.3012 & 0.381892 \tabularnewline
36 & 0.516662 & 5.6361 & 0 \tabularnewline
37 & -0.025188 & -0.2748 & 0.391987 \tabularnewline
38 & -0.073699 & -0.804 & 0.211513 \tabularnewline
39 & -0.089168 & -0.9727 & 0.166335 \tabularnewline
40 & 0.09347 & 1.0196 & 0.154984 \tabularnewline
41 & 0.13535 & 1.4765 & 0.071226 \tabularnewline
42 & -0.079583 & -0.8681 & 0.19353 \tabularnewline
43 & -0.141536 & -1.544 & 0.062625 \tabularnewline
44 & -0.128481 & -1.4016 & 0.081824 \tabularnewline
45 & -0.129912 & -1.4172 & 0.079523 \tabularnewline
46 & -0.181874 & -1.984 & 0.024779 \tabularnewline
47 & 0.000942 & 0.0103 & 0.495908 \tabularnewline
48 & 0.389703 & 4.2512 & 2.1e-05 \tabularnewline
\hline
\end{tabular}
%Source: https://freestatistics.org/blog/index.php?pk=169239&T=1

[TABLE]
[ROW][C]Autocorrelation Function[/C][/ROW]
[ROW][C]Time lag k[/C][C]ACF(k)[/C][C]T-STAT[/C][C]P-value[/C][/ROW]
[ROW][C]1[/C][C]0.024204[/C][C]0.264[/C][C]0.396104[/C][/ROW]
[ROW][C]2[/C][C]-0.106802[/C][C]-1.1651[/C][C]0.123161[/C][/ROW]
[ROW][C]3[/C][C]-0.157459[/C][C]-1.7177[/C][C]0.044228[/C][/ROW]
[ROW][C]4[/C][C]-0.001113[/C][C]-0.0121[/C][C]0.495164[/C][/ROW]
[ROW][C]5[/C][C]-0.000764[/C][C]-0.0083[/C][C]0.496683[/C][/ROW]
[ROW][C]6[/C][C]-0.08838[/C][C]-0.9641[/C][C]0.168472[/C][/ROW]
[ROW][C]7[/C][C]-0.063443[/C][C]-0.6921[/C][C]0.245119[/C][/ROW]
[ROW][C]8[/C][C]-0.045694[/C][C]-0.4985[/C][C]0.30954[/C][/ROW]
[ROW][C]9[/C][C]-0.181703[/C][C]-1.9821[/C][C]0.024884[/C][/ROW]
[ROW][C]10[/C][C]-0.10522[/C][C]-1.1478[/C][C]0.126674[/C][/ROW]
[ROW][C]11[/C][C]0.05545[/C][C]0.6049[/C][C]0.273203[/C][/ROW]
[ROW][C]12[/C][C]0.809326[/C][C]8.8287[/C][C]0[/C][/ROW]
[ROW][C]13[/C][C]0.008637[/C][C]0.0942[/C][C]0.462545[/C][/ROW]
[ROW][C]14[/C][C]-0.086148[/C][C]-0.9398[/C][C]0.174621[/C][/ROW]
[ROW][C]15[/C][C]-0.136296[/C][C]-1.4868[/C][C]0.069854[/C][/ROW]
[ROW][C]16[/C][C]0.034292[/C][C]0.3741[/C][C]0.354505[/C][/ROW]
[ROW][C]17[/C][C]0.042468[/C][C]0.4633[/C][C]0.322008[/C][/ROW]
[ROW][C]18[/C][C]-0.09718[/C][C]-1.0601[/C][C]0.145621[/C][/ROW]
[ROW][C]19[/C][C]-0.108473[/C][C]-1.1833[/C][C]0.119524[/C][/ROW]
[ROW][C]20[/C][C]-0.101546[/C][C]-1.1077[/C][C]0.135106[/C][/ROW]
[ROW][C]21[/C][C]-0.178554[/C][C]-1.9478[/C][C]0.026898[/C][/ROW]
[ROW][C]22[/C][C]-0.138415[/C][C]-1.5099[/C][C]0.066856[/C][/ROW]
[ROW][C]23[/C][C]0.058551[/C][C]0.6387[/C][C]0.262118[/C][/ROW]
[ROW][C]24[/C][C]0.650776[/C][C]7.0991[/C][C]0[/C][/ROW]
[ROW][C]25[/C][C]-0.006397[/C][C]-0.0698[/C][C]0.472244[/C][/ROW]
[ROW][C]26[/C][C]-0.077644[/C][C]-0.847[/C][C]0.19935[/C][/ROW]
[ROW][C]27[/C][C]-0.120515[/C][C]-1.3147[/C][C]0.095575[/C][/ROW]
[ROW][C]28[/C][C]0.061389[/C][C]0.6697[/C][C]0.252183[/C][/ROW]
[ROW][C]29[/C][C]0.095923[/C][C]1.0464[/C][C]0.148751[/C][/ROW]
[ROW][C]30[/C][C]-0.090925[/C][C]-0.9919[/C][C]0.161634[/C][/ROW]
[ROW][C]31[/C][C]-0.14015[/C][C]-1.5289[/C][C]0.064478[/C][/ROW]
[ROW][C]32[/C][C]-0.142963[/C][C]-1.5595[/C][C]0.060762[/C][/ROW]
[ROW][C]33[/C][C]-0.149837[/C][C]-1.6345[/C][C]0.052395[/C][/ROW]
[ROW][C]34[/C][C]-0.176595[/C][C]-1.9264[/C][C]0.028218[/C][/ROW]
[ROW][C]35[/C][C]0.027611[/C][C]0.3012[/C][C]0.381892[/C][/ROW]
[ROW][C]36[/C][C]0.516662[/C][C]5.6361[/C][C]0[/C][/ROW]
[ROW][C]37[/C][C]-0.025188[/C][C]-0.2748[/C][C]0.391987[/C][/ROW]
[ROW][C]38[/C][C]-0.073699[/C][C]-0.804[/C][C]0.211513[/C][/ROW]
[ROW][C]39[/C][C]-0.089168[/C][C]-0.9727[/C][C]0.166335[/C][/ROW]
[ROW][C]40[/C][C]0.09347[/C][C]1.0196[/C][C]0.154984[/C][/ROW]
[ROW][C]41[/C][C]0.13535[/C][C]1.4765[/C][C]0.071226[/C][/ROW]
[ROW][C]42[/C][C]-0.079583[/C][C]-0.8681[/C][C]0.19353[/C][/ROW]
[ROW][C]43[/C][C]-0.141536[/C][C]-1.544[/C][C]0.062625[/C][/ROW]
[ROW][C]44[/C][C]-0.128481[/C][C]-1.4016[/C][C]0.081824[/C][/ROW]
[ROW][C]45[/C][C]-0.129912[/C][C]-1.4172[/C][C]0.079523[/C][/ROW]
[ROW][C]46[/C][C]-0.181874[/C][C]-1.984[/C][C]0.024779[/C][/ROW]
[ROW][C]47[/C][C]0.000942[/C][C]0.0103[/C][C]0.495908[/C][/ROW]
[ROW][C]48[/C][C]0.389703[/C][C]4.2512[/C][C]2.1e-05[/C][/ROW]
[/TABLE]
Source: https://freestatistics.org/blog/index.php?pk=169239&T=1

Globally Unique Identifier (entire table): ba.freestatistics.org/blog/index.php?pk=169239&T=1

As an alternative you can also use a QR Code:  

The GUIDs for individual cells are displayed in the table below:

Autocorrelation Function
Time lag kACF(k)T-STATP-value
10.0242040.2640.396104
2-0.106802-1.16510.123161
3-0.157459-1.71770.044228
4-0.001113-0.01210.495164
5-0.000764-0.00830.496683
6-0.08838-0.96410.168472
7-0.063443-0.69210.245119
8-0.045694-0.49850.30954
9-0.181703-1.98210.024884
10-0.10522-1.14780.126674
110.055450.60490.273203
120.8093268.82870
130.0086370.09420.462545
14-0.086148-0.93980.174621
15-0.136296-1.48680.069854
160.0342920.37410.354505
170.0424680.46330.322008
18-0.09718-1.06010.145621
19-0.108473-1.18330.119524
20-0.101546-1.10770.135106
21-0.178554-1.94780.026898
22-0.138415-1.50990.066856
230.0585510.63870.262118
240.6507767.09910
25-0.006397-0.06980.472244
26-0.077644-0.8470.19935
27-0.120515-1.31470.095575
280.0613890.66970.252183
290.0959231.04640.148751
30-0.090925-0.99190.161634
31-0.14015-1.52890.064478
32-0.142963-1.55950.060762
33-0.149837-1.63450.052395
34-0.176595-1.92640.028218
350.0276110.30120.381892
360.5166625.63610
37-0.025188-0.27480.391987
38-0.073699-0.8040.211513
39-0.089168-0.97270.166335
400.093471.01960.154984
410.135351.47650.071226
42-0.079583-0.86810.19353
43-0.141536-1.5440.062625
44-0.128481-1.40160.081824
45-0.129912-1.41720.079523
46-0.181874-1.9840.024779
470.0009420.01030.495908
480.3897034.25122.1e-05


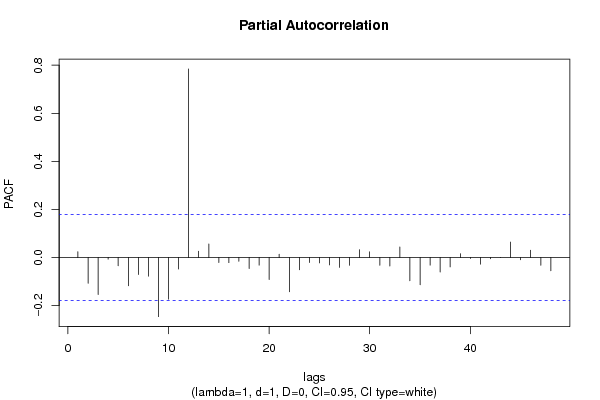
Partial Autocorrelation Function
Time lag kPACF(k)T-STATP-value
10.0242040.2640.396104
2-0.10745-1.17210.12174
3-0.153861-1.67840.047944
4-0.007058-0.0770.469379
5-0.034623-0.37770.353165
6-0.117473-1.28150.101259
7-0.070652-0.77070.221201
8-0.077588-0.84640.199519
9-0.246263-2.68640.004128
10-0.173369-1.89120.030512
11-0.04793-0.52290.301022
120.7844238.5570
130.025570.27890.390391
140.055850.60920.27176
15-0.021177-0.2310.40885
16-0.021604-0.23570.407047
17-0.0157-0.17130.43215
18-0.045831-0.50.309016
19-0.03199-0.3490.363863
20-0.091587-0.99910.159887
210.0132670.14470.442586
22-0.143041-1.56040.060661
23-0.051383-0.56050.288089
24-0.021106-0.23020.409149
25-0.022551-0.2460.403052
26-0.030769-0.33570.368861
27-0.041304-0.45060.326557
28-0.032145-0.35070.363232
290.0318280.34720.364526
300.0232260.25340.400212
31-0.032197-0.35120.363017
32-0.035307-0.38520.350406
330.0436590.47630.31738
34-0.096793-1.05590.146578
35-0.113236-1.23530.109584
36-0.031825-0.34720.364538
37-0.060803-0.66330.254215
38-0.039178-0.42740.334939
390.0154280.16830.433318
40-0.004032-0.0440.482497
41-0.027817-0.30340.381039
42-0.005664-0.06180.475417
43-0.000297-0.00320.498709
440.0637770.69570.243979
45-0.009775-0.10660.45763
460.0299020.32620.372425
47-0.032697-0.35670.360981
48-0.055272-0.60290.273845

\begin{tabular}{lllllllll}
\hline
Partial Autocorrelation Function \tabularnewline
Time lag k & PACF(k) & T-STAT & P-value \tabularnewline
1 & 0.024204 & 0.264 & 0.396104 \tabularnewline
2 & -0.10745 & -1.1721 & 0.12174 \tabularnewline
3 & -0.153861 & -1.6784 & 0.047944 \tabularnewline
4 & -0.007058 & -0.077 & 0.469379 \tabularnewline
5 & -0.034623 & -0.3777 & 0.353165 \tabularnewline
6 & -0.117473 & -1.2815 & 0.101259 \tabularnewline
7 & -0.070652 & -0.7707 & 0.221201 \tabularnewline
8 & -0.077588 & -0.8464 & 0.199519 \tabularnewline
9 & -0.246263 & -2.6864 & 0.004128 \tabularnewline
10 & -0.173369 & -1.8912 & 0.030512 \tabularnewline
11 & -0.04793 & -0.5229 & 0.301022 \tabularnewline
12 & 0.784423 & 8.557 & 0 \tabularnewline
13 & 0.02557 & 0.2789 & 0.390391 \tabularnewline
14 & 0.05585 & 0.6092 & 0.27176 \tabularnewline
15 & -0.021177 & -0.231 & 0.40885 \tabularnewline
16 & -0.021604 & -0.2357 & 0.407047 \tabularnewline
17 & -0.0157 & -0.1713 & 0.43215 \tabularnewline
18 & -0.045831 & -0.5 & 0.309016 \tabularnewline
19 & -0.03199 & -0.349 & 0.363863 \tabularnewline
20 & -0.091587 & -0.9991 & 0.159887 \tabularnewline
21 & 0.013267 & 0.1447 & 0.442586 \tabularnewline
22 & -0.143041 & -1.5604 & 0.060661 \tabularnewline
23 & -0.051383 & -0.5605 & 0.288089 \tabularnewline
24 & -0.021106 & -0.2302 & 0.409149 \tabularnewline
25 & -0.022551 & -0.246 & 0.403052 \tabularnewline
26 & -0.030769 & -0.3357 & 0.368861 \tabularnewline
27 & -0.041304 & -0.4506 & 0.326557 \tabularnewline
28 & -0.032145 & -0.3507 & 0.363232 \tabularnewline
29 & 0.031828 & 0.3472 & 0.364526 \tabularnewline
30 & 0.023226 & 0.2534 & 0.400212 \tabularnewline
31 & -0.032197 & -0.3512 & 0.363017 \tabularnewline
32 & -0.035307 & -0.3852 & 0.350406 \tabularnewline
33 & 0.043659 & 0.4763 & 0.31738 \tabularnewline
34 & -0.096793 & -1.0559 & 0.146578 \tabularnewline
35 & -0.113236 & -1.2353 & 0.109584 \tabularnewline
36 & -0.031825 & -0.3472 & 0.364538 \tabularnewline
37 & -0.060803 & -0.6633 & 0.254215 \tabularnewline
38 & -0.039178 & -0.4274 & 0.334939 \tabularnewline
39 & 0.015428 & 0.1683 & 0.433318 \tabularnewline
40 & -0.004032 & -0.044 & 0.482497 \tabularnewline
41 & -0.027817 & -0.3034 & 0.381039 \tabularnewline
42 & -0.005664 & -0.0618 & 0.475417 \tabularnewline
43 & -0.000297 & -0.0032 & 0.498709 \tabularnewline
44 & 0.063777 & 0.6957 & 0.243979 \tabularnewline
45 & -0.009775 & -0.1066 & 0.45763 \tabularnewline
46 & 0.029902 & 0.3262 & 0.372425 \tabularnewline
47 & -0.032697 & -0.3567 & 0.360981 \tabularnewline
48 & -0.055272 & -0.6029 & 0.273845 \tabularnewline
\hline
\end{tabular}
%Source: https://freestatistics.org/blog/index.php?pk=169239&T=2

[TABLE]
[ROW][C]Partial Autocorrelation Function[/C][/ROW]
[ROW][C]Time lag k[/C][C]PACF(k)[/C][C]T-STAT[/C][C]P-value[/C][/ROW]
[ROW][C]1[/C][C]0.024204[/C][C]0.264[/C][C]0.396104[/C][/ROW]
[ROW][C]2[/C][C]-0.10745[/C][C]-1.1721[/C][C]0.12174[/C][/ROW]
[ROW][C]3[/C][C]-0.153861[/C][C]-1.6784[/C][C]0.047944[/C][/ROW]
[ROW][C]4[/C][C]-0.007058[/C][C]-0.077[/C][C]0.469379[/C][/ROW]
[ROW][C]5[/C][C]-0.034623[/C][C]-0.3777[/C][C]0.353165[/C][/ROW]
[ROW][C]6[/C][C]-0.117473[/C][C]-1.2815[/C][C]0.101259[/C][/ROW]
[ROW][C]7[/C][C]-0.070652[/C][C]-0.7707[/C][C]0.221201[/C][/ROW]
[ROW][C]8[/C][C]-0.077588[/C][C]-0.8464[/C][C]0.199519[/C][/ROW]
[ROW][C]9[/C][C]-0.246263[/C][C]-2.6864[/C][C]0.004128[/C][/ROW]
[ROW][C]10[/C][C]-0.173369[/C][C]-1.8912[/C][C]0.030512[/C][/ROW]
[ROW][C]11[/C][C]-0.04793[/C][C]-0.5229[/C][C]0.301022[/C][/ROW]
[ROW][C]12[/C][C]0.784423[/C][C]8.557[/C][C]0[/C][/ROW]
[ROW][C]13[/C][C]0.02557[/C][C]0.2789[/C][C]0.390391[/C][/ROW]
[ROW][C]14[/C][C]0.05585[/C][C]0.6092[/C][C]0.27176[/C][/ROW]
[ROW][C]15[/C][C]-0.021177[/C][C]-0.231[/C][C]0.40885[/C][/ROW]
[ROW][C]16[/C][C]-0.021604[/C][C]-0.2357[/C][C]0.407047[/C][/ROW]
[ROW][C]17[/C][C]-0.0157[/C][C]-0.1713[/C][C]0.43215[/C][/ROW]
[ROW][C]18[/C][C]-0.045831[/C][C]-0.5[/C][C]0.309016[/C][/ROW]
[ROW][C]19[/C][C]-0.03199[/C][C]-0.349[/C][C]0.363863[/C][/ROW]
[ROW][C]20[/C][C]-0.091587[/C][C]-0.9991[/C][C]0.159887[/C][/ROW]
[ROW][C]21[/C][C]0.013267[/C][C]0.1447[/C][C]0.442586[/C][/ROW]
[ROW][C]22[/C][C]-0.143041[/C][C]-1.5604[/C][C]0.060661[/C][/ROW]
[ROW][C]23[/C][C]-0.051383[/C][C]-0.5605[/C][C]0.288089[/C][/ROW]
[ROW][C]24[/C][C]-0.021106[/C][C]-0.2302[/C][C]0.409149[/C][/ROW]
[ROW][C]25[/C][C]-0.022551[/C][C]-0.246[/C][C]0.403052[/C][/ROW]
[ROW][C]26[/C][C]-0.030769[/C][C]-0.3357[/C][C]0.368861[/C][/ROW]
[ROW][C]27[/C][C]-0.041304[/C][C]-0.4506[/C][C]0.326557[/C][/ROW]
[ROW][C]28[/C][C]-0.032145[/C][C]-0.3507[/C][C]0.363232[/C][/ROW]
[ROW][C]29[/C][C]0.031828[/C][C]0.3472[/C][C]0.364526[/C][/ROW]
[ROW][C]30[/C][C]0.023226[/C][C]0.2534[/C][C]0.400212[/C][/ROW]
[ROW][C]31[/C][C]-0.032197[/C][C]-0.3512[/C][C]0.363017[/C][/ROW]
[ROW][C]32[/C][C]-0.035307[/C][C]-0.3852[/C][C]0.350406[/C][/ROW]
[ROW][C]33[/C][C]0.043659[/C][C]0.4763[/C][C]0.31738[/C][/ROW]
[ROW][C]34[/C][C]-0.096793[/C][C]-1.0559[/C][C]0.146578[/C][/ROW]
[ROW][C]35[/C][C]-0.113236[/C][C]-1.2353[/C][C]0.109584[/C][/ROW]
[ROW][C]36[/C][C]-0.031825[/C][C]-0.3472[/C][C]0.364538[/C][/ROW]
[ROW][C]37[/C][C]-0.060803[/C][C]-0.6633[/C][C]0.254215[/C][/ROW]
[ROW][C]38[/C][C]-0.039178[/C][C]-0.4274[/C][C]0.334939[/C][/ROW]
[ROW][C]39[/C][C]0.015428[/C][C]0.1683[/C][C]0.433318[/C][/ROW]
[ROW][C]40[/C][C]-0.004032[/C][C]-0.044[/C][C]0.482497[/C][/ROW]
[ROW][C]41[/C][C]-0.027817[/C][C]-0.3034[/C][C]0.381039[/C][/ROW]
[ROW][C]42[/C][C]-0.005664[/C][C]-0.0618[/C][C]0.475417[/C][/ROW]
[ROW][C]43[/C][C]-0.000297[/C][C]-0.0032[/C][C]0.498709[/C][/ROW]
[ROW][C]44[/C][C]0.063777[/C][C]0.6957[/C][C]0.243979[/C][/ROW]
[ROW][C]45[/C][C]-0.009775[/C][C]-0.1066[/C][C]0.45763[/C][/ROW]
[ROW][C]46[/C][C]0.029902[/C][C]0.3262[/C][C]0.372425[/C][/ROW]
[ROW][C]47[/C][C]-0.032697[/C][C]-0.3567[/C][C]0.360981[/C][/ROW]
[ROW][C]48[/C][C]-0.055272[/C][C]-0.6029[/C][C]0.273845[/C][/ROW]
[/TABLE]
Source: https://freestatistics.org/blog/index.php?pk=169239&T=2

Globally Unique Identifier (entire table): ba.freestatistics.org/blog/index.php?pk=169239&T=2

As an alternative you can also use a QR Code:  

The GUIDs for individual cells are displayed in the table below:

Partial Autocorrelation Function
Time lag kPACF(k)T-STATP-value
10.0242040.2640.396104
2-0.10745-1.17210.12174
3-0.153861-1.67840.047944
4-0.007058-0.0770.469379
5-0.034623-0.37770.353165
6-0.117473-1.28150.101259
7-0.070652-0.77070.221201
8-0.077588-0.84640.199519
9-0.246263-2.68640.004128
10-0.173369-1.89120.030512
11-0.04793-0.52290.301022
120.7844238.5570
130.025570.27890.390391
140.055850.60920.27176
15-0.021177-0.2310.40885
16-0.021604-0.23570.407047
17-0.0157-0.17130.43215
18-0.045831-0.50.309016
19-0.03199-0.3490.363863
20-0.091587-0.99910.159887
210.0132670.14470.442586
22-0.143041-1.56040.060661
23-0.051383-0.56050.288089
24-0.021106-0.23020.409149
25-0.022551-0.2460.403052
26-0.030769-0.33570.368861
27-0.041304-0.45060.326557
28-0.032145-0.35070.363232
290.0318280.34720.364526
300.0232260.25340.400212
31-0.032197-0.35120.363017
32-0.035307-0.38520.350406
330.0436590.47630.31738
34-0.096793-1.05590.146578
35-0.113236-1.23530.109584
36-0.031825-0.34720.364538
37-0.060803-0.66330.254215
38-0.039178-0.42740.334939
390.0154280.16830.433318
40-0.004032-0.0440.482497
41-0.027817-0.30340.381039
42-0.005664-0.06180.475417
43-0.000297-0.00320.498709
440.0637770.69570.243979
45-0.009775-0.10660.45763
460.0299020.32620.372425
47-0.032697-0.35670.360981
48-0.055272-0.60290.273845


Parameters (Session):
par1 = 48 ; par2 = 1 ; par3 = 1 ; par4 = 0 ; par5 = 12 ; par6 = White Noise ; par7 = 0.95 ;
Parameters (R input):
par1 = 48 ; par2 = 1 ; par3 = 1 ; par4 = 0 ; par5 = 12 ; par6 = White Noise ; par7 = 0.95 ; par8 = ;
R code (references can be found in the software module):
par8 <- ''
par7 <- '0.95'
par6 <- 'White Noise'
par5 <- '12'
par4 <- '0'
par3 <- '0'
par2 <- '1'
par1 <- '48'
if (par1 == 'Default') {
par1 = 10*log10(length(x))
} else {
par1 <- as.numeric(par1)
}
par2 <- as.numeric(par2)
par3 <- as.numeric(par3)
par4 <- as.numeric(par4)
par5 <- as.numeric(par5)
if (par6 == 'White Noise') par6 <- 'white' else par6 <- 'ma'
par7 <- as.numeric(par7)
if (par8 != '') par8 <- as.numeric(par8)
ox <- x
if (par8 == '') {
if (par2 == 0) {
x <- log(x)
} else {
x <- (x ^ par2 - 1) / par2
}
} else {
x <- log(x,base=par8)
}
if (par3 > 0) x <- diff(x,lag=1,difference=par3)
if (par4 > 0) x <- diff(x,lag=par5,difference=par4)
bitmap(file='picts.png')
op <- par(mfrow=c(2,1))
plot(ox,type='l',main='Original Time Series',xlab='time',ylab='value')
if (par8=='') {
mytitle <- paste('Working Time Series (lambda=',par2,', d=',par3,', D=',par4,')',sep='')
mysub <- paste('(lambda=',par2,', d=',par3,', D=',par4,', CI=', par7, ', CI type=',par6,')',sep='')
} else {
mytitle <- paste('Working Time Series (base=',par8,', d=',par3,', D=',par4,')',sep='')
mysub <- paste('(base=',par8,', d=',par3,', D=',par4,', CI=', par7, ', CI type=',par6,')',sep='')
}
plot(x,type='l', main=mytitle,xlab='time',ylab='value')
par(op)
dev.off()
bitmap(file='pic1.png')
racf <- acf(x, par1, main='Autocorrelation', xlab='time lag', ylab='ACF', ci.type=par6, ci=par7, sub=mysub)
dev.off()
bitmap(file='pic2.png')
rpacf <- pacf(x,par1,main='Partial Autocorrelation',xlab='lags',ylab='PACF',sub=mysub)
dev.off()
(myacf <- c(racf$acf))
(mypacf <- c(rpacf$acf))
lengthx <- length(x)
sqrtn <- sqrt(lengthx)
load(file='createtable')
a<-table.start()
a<-table.row.start(a)
a<-table.element(a,'Autocorrelation Function',4,TRUE)
a<-table.row.end(a)
a<-table.row.start(a)
a<-table.element(a,'Time lag k',header=TRUE)
a<-table.element(a,hyperlink('basics.htm','ACF(k)','click here for more information about the Autocorrelation Function'),header=TRUE)
a<-table.element(a,'T-STAT',header=TRUE)
a<-table.element(a,'P-value',header=TRUE)
a<-table.row.end(a)
for (i in 2:(par1+1)) {
a<-table.row.start(a)
a<-table.element(a,i-1,header=TRUE)
a<-table.element(a,round(myacf[i],6))
mytstat <- myacf[i]*sqrtn
a<-table.element(a,round(mytstat,4))
a<-table.element(a,round(1-pt(abs(mytstat),lengthx),6))
a<-table.row.end(a)
}
a<-table.end(a)
table.save(a,file='mytable.tab')
a<-table.start()
a<-table.row.start(a)
a<-table.element(a,'Partial Autocorrelation Function',4,TRUE)
a<-table.row.end(a)
a<-table.row.start(a)
a<-table.element(a,'Time lag k',header=TRUE)
a<-table.element(a,hyperlink('basics.htm','PACF(k)','click here for more information about the Partial Autocorrelation Function'),header=TRUE)
a<-table.element(a,'T-STAT',header=TRUE)
a<-table.element(a,'P-value',header=TRUE)
a<-table.row.end(a)
for (i in 1:par1) {
a<-table.row.start(a)
a<-table.element(a,i,header=TRUE)
a<-table.element(a,round(mypacf[i],6))
mytstat <- mypacf[i]*sqrtn
a<-table.element(a,round(mytstat,4))
a<-table.element(a,round(1-pt(abs(mytstat),lengthx),6))
a<-table.row.end(a)
}
a<-table.end(a)
table.save(a,file='mytable1.tab')