Free Statistics

of Irreproducible Research!

Author's title

Author*Unverified author*
R Software Modulerwasp_autocorrelation.wasp
Title produced by software(Partial) Autocorrelation Function
Date of computationSun, 12 Aug 2012 09:09:52 -0400
Cite this page as followsStatistical Computations at FreeStatistics.org, Office for Research Development and Education, URL https://freestatistics.org/blog/index.php?v=date/2012/Aug/12/t1344777030qz418x2a9bue8g7.htm/, Retrieved Sat, 27 Apr 2024 20:25:22 +0000
Statistical Computations at FreeStatistics.org, Office for Research Development and Education, URL https://freestatistics.org/blog/index.php?pk=169235, Retrieved Sat, 27 Apr 2024 20:25:22 +0000
QR Codes:

Original text written by user:
IsPrivate?No (this computation is public)
User-defined keywordsVan der Smissen Britt
Estimated Impact144
Family? (F = Feedback message, R = changed R code, M = changed R Module, P = changed Parameters, D = changed Data)
-       [(Partial) Autocorrelation Function] [Tijdreeks A-Stap 20] [2012-08-12 13:09:52] [b3616d670e39c9c081ac68ec1f5d1a32] [Current]
Feedback Forum

Post a new message
Dataseries X:
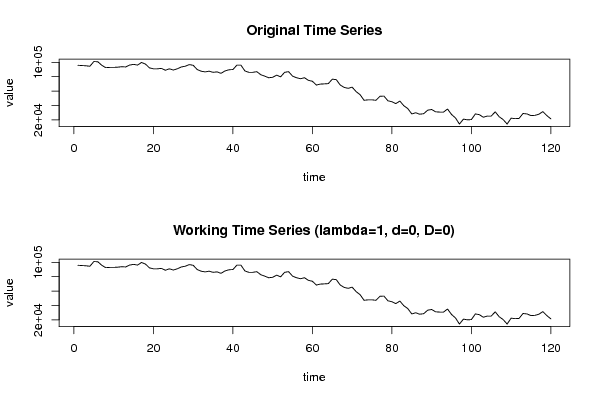
95870
95523
95208
94541
101097
100781
95870
92581
92928
92928
93244
93910
93559
96190
97172
96190
99799
97488
92261
90964
90964
91599
89004
90964
89319
90964
93559
94541
96852
95870
89981
87670
86692
87670
86057
86692
84728
88021
89635
89981
96190
96190
88021
86057
86057
87039
82764
80799
78524
79186
82133
79821
86057
87039
80799
78524
77221
78524
74910
73613
68390
69688
70004
70355
76559
75893
68390
65097
63799
65444
59208
54964
47115
47777
47777
47115
52684
53004
46448
45151
42524
46133
39577
35653
28146
29764
27800
28462
33373
34355
31093
30742
30742
35017
27484
22573
14058
20929
19946
20293
28146
27164
23555
25204
25204
31093
24222
20293
14058
22258
21595
21911
28782
28146
25835
26186
27800
31409
25835
21275


Summary of computational transaction
Raw Inputview raw input (R code)
Raw Outputview raw output of R engine
Computing time1 seconds
R Server'Herman Ole Andreas Wold' @ wold.wessa.net

\begin{tabular}{lllllllll}
\hline
Summary of computational transaction \tabularnewline
Raw Input & view raw input (R code)  \tabularnewline
Raw Output & view raw output of R engine  \tabularnewline
Computing time & 1 seconds \tabularnewline
R Server & 'Herman Ole Andreas Wold' @ wold.wessa.net \tabularnewline
\hline
\end{tabular}
%Source: https://freestatistics.org/blog/index.php?pk=169235&T=0

[TABLE]
[ROW][C]Summary of computational transaction[/C][/ROW]
[ROW][C]Raw Input[/C][C]view raw input (R code) [/C][/ROW]
[ROW][C]Raw Output[/C][C]view raw output of R engine [/C][/ROW]
[ROW][C]Computing time[/C][C]1 seconds[/C][/ROW]
[ROW][C]R Server[/C][C]'Herman Ole Andreas Wold' @ wold.wessa.net[/C][/ROW]
[/TABLE]
Source: https://freestatistics.org/blog/index.php?pk=169235&T=0

Globally Unique Identifier (entire table): ba.freestatistics.org/blog/index.php?pk=169235&T=0

As an alternative you can also use a QR Code:  

The GUIDs for individual cells are displayed in the table below:

Summary of computational transaction
Raw Inputview raw input (R code)
Raw Outputview raw output of R engine
Computing time1 seconds
R Server'Herman Ole Andreas Wold' @ wold.wessa.net


Autocorrelation Function
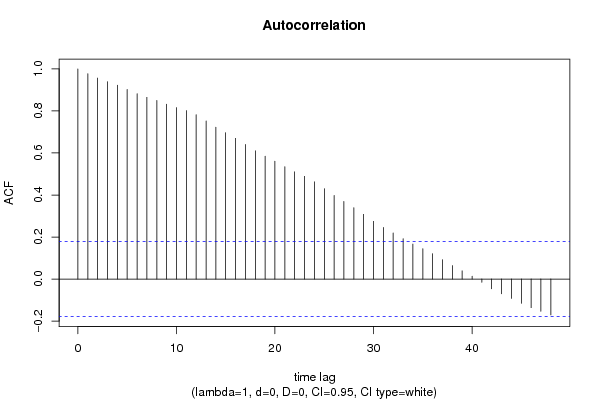
Time lag kACF(k)T-STATP-value
10.97755810.70860
20.95635610.47640
30.93892610.28540
40.92222210.10240
50.9022399.88350
60.8817279.65880
70.8647379.47270
80.8496549.30750
90.8317559.11140
100.816118.940
110.8018258.78360
120.7823838.57060
130.752418.24220
140.7226327.9160
150.6963747.62840
160.6695577.33460
170.6404987.01630
180.6102716.68520
190.5843346.40110
200.5604816.13980
210.5343415.85340
220.5101375.58830
230.4888665.35530
240.4625125.06661e-06
250.4295264.70523e-06
260.3977174.35681.4e-05
270.3690584.04284.7e-05
280.3396463.72060.000152
290.3079893.37390.000499
300.2747573.00980.001593
310.2457932.69250.004053
320.2189062.3980.009013
330.1919952.10320.018769
340.1663471.82220.035454
350.1443671.58150.058203
360.1205421.32050.094595
370.0919431.00720.157937
380.063910.70010.242609
390.038910.42620.33535
400.0132070.14470.442605
41-0.015332-0.1680.433452
42-0.045933-0.50320.307884
43-0.070215-0.76920.221654
44-0.092141-1.00940.157417
45-0.114844-1.2580.105408
46-0.135949-1.48920.069523
47-0.153201-1.67820.047953
48-0.170516-1.86790.032107

\begin{tabular}{lllllllll}
\hline
Autocorrelation Function \tabularnewline
Time lag k & ACF(k) & T-STAT & P-value \tabularnewline
1 & 0.977558 & 10.7086 & 0 \tabularnewline
2 & 0.956356 & 10.4764 & 0 \tabularnewline
3 & 0.938926 & 10.2854 & 0 \tabularnewline
4 & 0.922222 & 10.1024 & 0 \tabularnewline
5 & 0.902239 & 9.8835 & 0 \tabularnewline
6 & 0.881727 & 9.6588 & 0 \tabularnewline
7 & 0.864737 & 9.4727 & 0 \tabularnewline
8 & 0.849654 & 9.3075 & 0 \tabularnewline
9 & 0.831755 & 9.1114 & 0 \tabularnewline
10 & 0.81611 & 8.94 & 0 \tabularnewline
11 & 0.801825 & 8.7836 & 0 \tabularnewline
12 & 0.782383 & 8.5706 & 0 \tabularnewline
13 & 0.75241 & 8.2422 & 0 \tabularnewline
14 & 0.722632 & 7.916 & 0 \tabularnewline
15 & 0.696374 & 7.6284 & 0 \tabularnewline
16 & 0.669557 & 7.3346 & 0 \tabularnewline
17 & 0.640498 & 7.0163 & 0 \tabularnewline
18 & 0.610271 & 6.6852 & 0 \tabularnewline
19 & 0.584334 & 6.4011 & 0 \tabularnewline
20 & 0.560481 & 6.1398 & 0 \tabularnewline
21 & 0.534341 & 5.8534 & 0 \tabularnewline
22 & 0.510137 & 5.5883 & 0 \tabularnewline
23 & 0.488866 & 5.3553 & 0 \tabularnewline
24 & 0.462512 & 5.0666 & 1e-06 \tabularnewline
25 & 0.429526 & 4.7052 & 3e-06 \tabularnewline
26 & 0.397717 & 4.3568 & 1.4e-05 \tabularnewline
27 & 0.369058 & 4.0428 & 4.7e-05 \tabularnewline
28 & 0.339646 & 3.7206 & 0.000152 \tabularnewline
29 & 0.307989 & 3.3739 & 0.000499 \tabularnewline
30 & 0.274757 & 3.0098 & 0.001593 \tabularnewline
31 & 0.245793 & 2.6925 & 0.004053 \tabularnewline
32 & 0.218906 & 2.398 & 0.009013 \tabularnewline
33 & 0.191995 & 2.1032 & 0.018769 \tabularnewline
34 & 0.166347 & 1.8222 & 0.035454 \tabularnewline
35 & 0.144367 & 1.5815 & 0.058203 \tabularnewline
36 & 0.120542 & 1.3205 & 0.094595 \tabularnewline
37 & 0.091943 & 1.0072 & 0.157937 \tabularnewline
38 & 0.06391 & 0.7001 & 0.242609 \tabularnewline
39 & 0.03891 & 0.4262 & 0.33535 \tabularnewline
40 & 0.013207 & 0.1447 & 0.442605 \tabularnewline
41 & -0.015332 & -0.168 & 0.433452 \tabularnewline
42 & -0.045933 & -0.5032 & 0.307884 \tabularnewline
43 & -0.070215 & -0.7692 & 0.221654 \tabularnewline
44 & -0.092141 & -1.0094 & 0.157417 \tabularnewline
45 & -0.114844 & -1.258 & 0.105408 \tabularnewline
46 & -0.135949 & -1.4892 & 0.069523 \tabularnewline
47 & -0.153201 & -1.6782 & 0.047953 \tabularnewline
48 & -0.170516 & -1.8679 & 0.032107 \tabularnewline
\hline
\end{tabular}
%Source: https://freestatistics.org/blog/index.php?pk=169235&T=1

[TABLE]
[ROW][C]Autocorrelation Function[/C][/ROW]
[ROW][C]Time lag k[/C][C]ACF(k)[/C][C]T-STAT[/C][C]P-value[/C][/ROW]
[ROW][C]1[/C][C]0.977558[/C][C]10.7086[/C][C]0[/C][/ROW]
[ROW][C]2[/C][C]0.956356[/C][C]10.4764[/C][C]0[/C][/ROW]
[ROW][C]3[/C][C]0.938926[/C][C]10.2854[/C][C]0[/C][/ROW]
[ROW][C]4[/C][C]0.922222[/C][C]10.1024[/C][C]0[/C][/ROW]
[ROW][C]5[/C][C]0.902239[/C][C]9.8835[/C][C]0[/C][/ROW]
[ROW][C]6[/C][C]0.881727[/C][C]9.6588[/C][C]0[/C][/ROW]
[ROW][C]7[/C][C]0.864737[/C][C]9.4727[/C][C]0[/C][/ROW]
[ROW][C]8[/C][C]0.849654[/C][C]9.3075[/C][C]0[/C][/ROW]
[ROW][C]9[/C][C]0.831755[/C][C]9.1114[/C][C]0[/C][/ROW]
[ROW][C]10[/C][C]0.81611[/C][C]8.94[/C][C]0[/C][/ROW]
[ROW][C]11[/C][C]0.801825[/C][C]8.7836[/C][C]0[/C][/ROW]
[ROW][C]12[/C][C]0.782383[/C][C]8.5706[/C][C]0[/C][/ROW]
[ROW][C]13[/C][C]0.75241[/C][C]8.2422[/C][C]0[/C][/ROW]
[ROW][C]14[/C][C]0.722632[/C][C]7.916[/C][C]0[/C][/ROW]
[ROW][C]15[/C][C]0.696374[/C][C]7.6284[/C][C]0[/C][/ROW]
[ROW][C]16[/C][C]0.669557[/C][C]7.3346[/C][C]0[/C][/ROW]
[ROW][C]17[/C][C]0.640498[/C][C]7.0163[/C][C]0[/C][/ROW]
[ROW][C]18[/C][C]0.610271[/C][C]6.6852[/C][C]0[/C][/ROW]
[ROW][C]19[/C][C]0.584334[/C][C]6.4011[/C][C]0[/C][/ROW]
[ROW][C]20[/C][C]0.560481[/C][C]6.1398[/C][C]0[/C][/ROW]
[ROW][C]21[/C][C]0.534341[/C][C]5.8534[/C][C]0[/C][/ROW]
[ROW][C]22[/C][C]0.510137[/C][C]5.5883[/C][C]0[/C][/ROW]
[ROW][C]23[/C][C]0.488866[/C][C]5.3553[/C][C]0[/C][/ROW]
[ROW][C]24[/C][C]0.462512[/C][C]5.0666[/C][C]1e-06[/C][/ROW]
[ROW][C]25[/C][C]0.429526[/C][C]4.7052[/C][C]3e-06[/C][/ROW]
[ROW][C]26[/C][C]0.397717[/C][C]4.3568[/C][C]1.4e-05[/C][/ROW]
[ROW][C]27[/C][C]0.369058[/C][C]4.0428[/C][C]4.7e-05[/C][/ROW]
[ROW][C]28[/C][C]0.339646[/C][C]3.7206[/C][C]0.000152[/C][/ROW]
[ROW][C]29[/C][C]0.307989[/C][C]3.3739[/C][C]0.000499[/C][/ROW]
[ROW][C]30[/C][C]0.274757[/C][C]3.0098[/C][C]0.001593[/C][/ROW]
[ROW][C]31[/C][C]0.245793[/C][C]2.6925[/C][C]0.004053[/C][/ROW]
[ROW][C]32[/C][C]0.218906[/C][C]2.398[/C][C]0.009013[/C][/ROW]
[ROW][C]33[/C][C]0.191995[/C][C]2.1032[/C][C]0.018769[/C][/ROW]
[ROW][C]34[/C][C]0.166347[/C][C]1.8222[/C][C]0.035454[/C][/ROW]
[ROW][C]35[/C][C]0.144367[/C][C]1.5815[/C][C]0.058203[/C][/ROW]
[ROW][C]36[/C][C]0.120542[/C][C]1.3205[/C][C]0.094595[/C][/ROW]
[ROW][C]37[/C][C]0.091943[/C][C]1.0072[/C][C]0.157937[/C][/ROW]
[ROW][C]38[/C][C]0.06391[/C][C]0.7001[/C][C]0.242609[/C][/ROW]
[ROW][C]39[/C][C]0.03891[/C][C]0.4262[/C][C]0.33535[/C][/ROW]
[ROW][C]40[/C][C]0.013207[/C][C]0.1447[/C][C]0.442605[/C][/ROW]
[ROW][C]41[/C][C]-0.015332[/C][C]-0.168[/C][C]0.433452[/C][/ROW]
[ROW][C]42[/C][C]-0.045933[/C][C]-0.5032[/C][C]0.307884[/C][/ROW]
[ROW][C]43[/C][C]-0.070215[/C][C]-0.7692[/C][C]0.221654[/C][/ROW]
[ROW][C]44[/C][C]-0.092141[/C][C]-1.0094[/C][C]0.157417[/C][/ROW]
[ROW][C]45[/C][C]-0.114844[/C][C]-1.258[/C][C]0.105408[/C][/ROW]
[ROW][C]46[/C][C]-0.135949[/C][C]-1.4892[/C][C]0.069523[/C][/ROW]
[ROW][C]47[/C][C]-0.153201[/C][C]-1.6782[/C][C]0.047953[/C][/ROW]
[ROW][C]48[/C][C]-0.170516[/C][C]-1.8679[/C][C]0.032107[/C][/ROW]
[/TABLE]
Source: https://freestatistics.org/blog/index.php?pk=169235&T=1

Globally Unique Identifier (entire table): ba.freestatistics.org/blog/index.php?pk=169235&T=1

As an alternative you can also use a QR Code:  

The GUIDs for individual cells are displayed in the table below:

Autocorrelation Function
Time lag kACF(k)T-STATP-value
10.97755810.70860
20.95635610.47640
30.93892610.28540
40.92222210.10240
50.9022399.88350
60.8817279.65880
70.8647379.47270
80.8496549.30750
90.8317559.11140
100.816118.940
110.8018258.78360
120.7823838.57060
130.752418.24220
140.7226327.9160
150.6963747.62840
160.6695577.33460
170.6404987.01630
180.6102716.68520
190.5843346.40110
200.5604816.13980
210.5343415.85340
220.5101375.58830
230.4888665.35530
240.4625125.06661e-06
250.4295264.70523e-06
260.3977174.35681.4e-05
270.3690584.04284.7e-05
280.3396463.72060.000152
290.3079893.37390.000499
300.2747573.00980.001593
310.2457932.69250.004053
320.2189062.3980.009013
330.1919952.10320.018769
340.1663471.82220.035454
350.1443671.58150.058203
360.1205421.32050.094595
370.0919431.00720.157937
380.063910.70010.242609
390.038910.42620.33535
400.0132070.14470.442605
41-0.015332-0.1680.433452
42-0.045933-0.50320.307884
43-0.070215-0.76920.221654
44-0.092141-1.00940.157417
45-0.114844-1.2580.105408
46-0.135949-1.48920.069523
47-0.153201-1.67820.047953
48-0.170516-1.86790.032107


Partial Autocorrelation Function
Time lag kPACF(k)T-STATP-value
10.97755810.70860
20.0166060.18190.427981
30.0749220.82070.206713
40.0121550.13320.447147
5-0.074826-0.81970.207012
6-0.023516-0.25760.398577
70.0576130.63110.264583
80.034290.37560.353929
9-0.054417-0.59610.276112
100.0494080.54120.294673
110.0094220.10320.458984
12-0.126689-1.38780.083884
13-0.246925-2.70490.003913
14-0.050051-0.54830.292258
150.0167690.18370.42728
16-0.017791-0.19490.422905
17-0.020276-0.22210.412304
18-0.05805-0.63590.263026
190.026760.29310.384958
200.0205630.22530.411084
21-0.041024-0.44940.32698
220.0154080.16880.433124
230.0489240.53590.296499
24-0.078667-0.86170.195272
25-0.11658-1.27710.102021
26-0.017616-0.1930.423653
27-0.001903-0.02080.491702
28-0.018085-0.19810.421648
29-0.015035-0.16470.434728
30-0.074601-0.81720.207713
31-0.00441-0.04830.480774
320.0117340.12850.448969
330.0090370.0990.460653
34-0.013163-0.14420.442796
350.0569950.62440.266791
360.0062380.06830.472817
37-0.076345-0.83630.202321
38-0.030972-0.33930.367496
39-0.002749-0.03010.488014
40-0.020643-0.22610.41074
41-0.024779-0.27140.39326
42-0.071781-0.78630.216615
430.0366260.40120.344485
440.0119820.13130.447896
45-0.014055-0.1540.438949
46-0.015049-0.16490.434668
470.0320070.35060.363246
480.0186820.20470.419095

\begin{tabular}{lllllllll}
\hline
Partial Autocorrelation Function \tabularnewline
Time lag k & PACF(k) & T-STAT & P-value \tabularnewline
1 & 0.977558 & 10.7086 & 0 \tabularnewline
2 & 0.016606 & 0.1819 & 0.427981 \tabularnewline
3 & 0.074922 & 0.8207 & 0.206713 \tabularnewline
4 & 0.012155 & 0.1332 & 0.447147 \tabularnewline
5 & -0.074826 & -0.8197 & 0.207012 \tabularnewline
6 & -0.023516 & -0.2576 & 0.398577 \tabularnewline
7 & 0.057613 & 0.6311 & 0.264583 \tabularnewline
8 & 0.03429 & 0.3756 & 0.353929 \tabularnewline
9 & -0.054417 & -0.5961 & 0.276112 \tabularnewline
10 & 0.049408 & 0.5412 & 0.294673 \tabularnewline
11 & 0.009422 & 0.1032 & 0.458984 \tabularnewline
12 & -0.126689 & -1.3878 & 0.083884 \tabularnewline
13 & -0.246925 & -2.7049 & 0.003913 \tabularnewline
14 & -0.050051 & -0.5483 & 0.292258 \tabularnewline
15 & 0.016769 & 0.1837 & 0.42728 \tabularnewline
16 & -0.017791 & -0.1949 & 0.422905 \tabularnewline
17 & -0.020276 & -0.2221 & 0.412304 \tabularnewline
18 & -0.05805 & -0.6359 & 0.263026 \tabularnewline
19 & 0.02676 & 0.2931 & 0.384958 \tabularnewline
20 & 0.020563 & 0.2253 & 0.411084 \tabularnewline
21 & -0.041024 & -0.4494 & 0.32698 \tabularnewline
22 & 0.015408 & 0.1688 & 0.433124 \tabularnewline
23 & 0.048924 & 0.5359 & 0.296499 \tabularnewline
24 & -0.078667 & -0.8617 & 0.195272 \tabularnewline
25 & -0.11658 & -1.2771 & 0.102021 \tabularnewline
26 & -0.017616 & -0.193 & 0.423653 \tabularnewline
27 & -0.001903 & -0.0208 & 0.491702 \tabularnewline
28 & -0.018085 & -0.1981 & 0.421648 \tabularnewline
29 & -0.015035 & -0.1647 & 0.434728 \tabularnewline
30 & -0.074601 & -0.8172 & 0.207713 \tabularnewline
31 & -0.00441 & -0.0483 & 0.480774 \tabularnewline
32 & 0.011734 & 0.1285 & 0.448969 \tabularnewline
33 & 0.009037 & 0.099 & 0.460653 \tabularnewline
34 & -0.013163 & -0.1442 & 0.442796 \tabularnewline
35 & 0.056995 & 0.6244 & 0.266791 \tabularnewline
36 & 0.006238 & 0.0683 & 0.472817 \tabularnewline
37 & -0.076345 & -0.8363 & 0.202321 \tabularnewline
38 & -0.030972 & -0.3393 & 0.367496 \tabularnewline
39 & -0.002749 & -0.0301 & 0.488014 \tabularnewline
40 & -0.020643 & -0.2261 & 0.41074 \tabularnewline
41 & -0.024779 & -0.2714 & 0.39326 \tabularnewline
42 & -0.071781 & -0.7863 & 0.216615 \tabularnewline
43 & 0.036626 & 0.4012 & 0.344485 \tabularnewline
44 & 0.011982 & 0.1313 & 0.447896 \tabularnewline
45 & -0.014055 & -0.154 & 0.438949 \tabularnewline
46 & -0.015049 & -0.1649 & 0.434668 \tabularnewline
47 & 0.032007 & 0.3506 & 0.363246 \tabularnewline
48 & 0.018682 & 0.2047 & 0.419095 \tabularnewline
\hline
\end{tabular}
%Source: https://freestatistics.org/blog/index.php?pk=169235&T=2

[TABLE]
[ROW][C]Partial Autocorrelation Function[/C][/ROW]
[ROW][C]Time lag k[/C][C]PACF(k)[/C][C]T-STAT[/C][C]P-value[/C][/ROW]
[ROW][C]1[/C][C]0.977558[/C][C]10.7086[/C][C]0[/C][/ROW]
[ROW][C]2[/C][C]0.016606[/C][C]0.1819[/C][C]0.427981[/C][/ROW]
[ROW][C]3[/C][C]0.074922[/C][C]0.8207[/C][C]0.206713[/C][/ROW]
[ROW][C]4[/C][C]0.012155[/C][C]0.1332[/C][C]0.447147[/C][/ROW]
[ROW][C]5[/C][C]-0.074826[/C][C]-0.8197[/C][C]0.207012[/C][/ROW]
[ROW][C]6[/C][C]-0.023516[/C][C]-0.2576[/C][C]0.398577[/C][/ROW]
[ROW][C]7[/C][C]0.057613[/C][C]0.6311[/C][C]0.264583[/C][/ROW]
[ROW][C]8[/C][C]0.03429[/C][C]0.3756[/C][C]0.353929[/C][/ROW]
[ROW][C]9[/C][C]-0.054417[/C][C]-0.5961[/C][C]0.276112[/C][/ROW]
[ROW][C]10[/C][C]0.049408[/C][C]0.5412[/C][C]0.294673[/C][/ROW]
[ROW][C]11[/C][C]0.009422[/C][C]0.1032[/C][C]0.458984[/C][/ROW]
[ROW][C]12[/C][C]-0.126689[/C][C]-1.3878[/C][C]0.083884[/C][/ROW]
[ROW][C]13[/C][C]-0.246925[/C][C]-2.7049[/C][C]0.003913[/C][/ROW]
[ROW][C]14[/C][C]-0.050051[/C][C]-0.5483[/C][C]0.292258[/C][/ROW]
[ROW][C]15[/C][C]0.016769[/C][C]0.1837[/C][C]0.42728[/C][/ROW]
[ROW][C]16[/C][C]-0.017791[/C][C]-0.1949[/C][C]0.422905[/C][/ROW]
[ROW][C]17[/C][C]-0.020276[/C][C]-0.2221[/C][C]0.412304[/C][/ROW]
[ROW][C]18[/C][C]-0.05805[/C][C]-0.6359[/C][C]0.263026[/C][/ROW]
[ROW][C]19[/C][C]0.02676[/C][C]0.2931[/C][C]0.384958[/C][/ROW]
[ROW][C]20[/C][C]0.020563[/C][C]0.2253[/C][C]0.411084[/C][/ROW]
[ROW][C]21[/C][C]-0.041024[/C][C]-0.4494[/C][C]0.32698[/C][/ROW]
[ROW][C]22[/C][C]0.015408[/C][C]0.1688[/C][C]0.433124[/C][/ROW]
[ROW][C]23[/C][C]0.048924[/C][C]0.5359[/C][C]0.296499[/C][/ROW]
[ROW][C]24[/C][C]-0.078667[/C][C]-0.8617[/C][C]0.195272[/C][/ROW]
[ROW][C]25[/C][C]-0.11658[/C][C]-1.2771[/C][C]0.102021[/C][/ROW]
[ROW][C]26[/C][C]-0.017616[/C][C]-0.193[/C][C]0.423653[/C][/ROW]
[ROW][C]27[/C][C]-0.001903[/C][C]-0.0208[/C][C]0.491702[/C][/ROW]
[ROW][C]28[/C][C]-0.018085[/C][C]-0.1981[/C][C]0.421648[/C][/ROW]
[ROW][C]29[/C][C]-0.015035[/C][C]-0.1647[/C][C]0.434728[/C][/ROW]
[ROW][C]30[/C][C]-0.074601[/C][C]-0.8172[/C][C]0.207713[/C][/ROW]
[ROW][C]31[/C][C]-0.00441[/C][C]-0.0483[/C][C]0.480774[/C][/ROW]
[ROW][C]32[/C][C]0.011734[/C][C]0.1285[/C][C]0.448969[/C][/ROW]
[ROW][C]33[/C][C]0.009037[/C][C]0.099[/C][C]0.460653[/C][/ROW]
[ROW][C]34[/C][C]-0.013163[/C][C]-0.1442[/C][C]0.442796[/C][/ROW]
[ROW][C]35[/C][C]0.056995[/C][C]0.6244[/C][C]0.266791[/C][/ROW]
[ROW][C]36[/C][C]0.006238[/C][C]0.0683[/C][C]0.472817[/C][/ROW]
[ROW][C]37[/C][C]-0.076345[/C][C]-0.8363[/C][C]0.202321[/C][/ROW]
[ROW][C]38[/C][C]-0.030972[/C][C]-0.3393[/C][C]0.367496[/C][/ROW]
[ROW][C]39[/C][C]-0.002749[/C][C]-0.0301[/C][C]0.488014[/C][/ROW]
[ROW][C]40[/C][C]-0.020643[/C][C]-0.2261[/C][C]0.41074[/C][/ROW]
[ROW][C]41[/C][C]-0.024779[/C][C]-0.2714[/C][C]0.39326[/C][/ROW]
[ROW][C]42[/C][C]-0.071781[/C][C]-0.7863[/C][C]0.216615[/C][/ROW]
[ROW][C]43[/C][C]0.036626[/C][C]0.4012[/C][C]0.344485[/C][/ROW]
[ROW][C]44[/C][C]0.011982[/C][C]0.1313[/C][C]0.447896[/C][/ROW]
[ROW][C]45[/C][C]-0.014055[/C][C]-0.154[/C][C]0.438949[/C][/ROW]
[ROW][C]46[/C][C]-0.015049[/C][C]-0.1649[/C][C]0.434668[/C][/ROW]
[ROW][C]47[/C][C]0.032007[/C][C]0.3506[/C][C]0.363246[/C][/ROW]
[ROW][C]48[/C][C]0.018682[/C][C]0.2047[/C][C]0.419095[/C][/ROW]
[/TABLE]
Source: https://freestatistics.org/blog/index.php?pk=169235&T=2

Globally Unique Identifier (entire table): ba.freestatistics.org/blog/index.php?pk=169235&T=2

As an alternative you can also use a QR Code:  

The GUIDs for individual cells are displayed in the table below:

Partial Autocorrelation Function
Time lag kPACF(k)T-STATP-value
10.97755810.70860
20.0166060.18190.427981
30.0749220.82070.206713
40.0121550.13320.447147
5-0.074826-0.81970.207012
6-0.023516-0.25760.398577
70.0576130.63110.264583
80.034290.37560.353929
9-0.054417-0.59610.276112
100.0494080.54120.294673
110.0094220.10320.458984
12-0.126689-1.38780.083884
13-0.246925-2.70490.003913
14-0.050051-0.54830.292258
150.0167690.18370.42728
16-0.017791-0.19490.422905
17-0.020276-0.22210.412304
18-0.05805-0.63590.263026
190.026760.29310.384958
200.0205630.22530.411084
21-0.041024-0.44940.32698
220.0154080.16880.433124
230.0489240.53590.296499
24-0.078667-0.86170.195272
25-0.11658-1.27710.102021
26-0.017616-0.1930.423653
27-0.001903-0.02080.491702
28-0.018085-0.19810.421648
29-0.015035-0.16470.434728
30-0.074601-0.81720.207713
31-0.00441-0.04830.480774
320.0117340.12850.448969
330.0090370.0990.460653
34-0.013163-0.14420.442796
350.0569950.62440.266791
360.0062380.06830.472817
37-0.076345-0.83630.202321
38-0.030972-0.33930.367496
39-0.002749-0.03010.488014
40-0.020643-0.22610.41074
41-0.024779-0.27140.39326
42-0.071781-0.78630.216615
430.0366260.40120.344485
440.0119820.13130.447896
45-0.014055-0.1540.438949
46-0.015049-0.16490.434668
470.0320070.35060.363246
480.0186820.20470.419095


Parameters (Session):
par1 = 48 ; par2 = 1 ; par3 = 0 ; par4 = 0 ; par5 = 12 ; par6 = White Noise ; par7 = 0.95 ;
Parameters (R input):
par1 = 48 ; par2 = 1 ; par3 = 0 ; par4 = 0 ; par5 = 12 ; par6 = White Noise ; par7 = 0.95 ; par8 = ;
R code (references can be found in the software module):
if (par1 == 'Default') {
par1 = 10*log10(length(x))
} else {
par1 <- as.numeric(par1)
}
par2 <- as.numeric(par2)
par3 <- as.numeric(par3)
par4 <- as.numeric(par4)
par5 <- as.numeric(par5)
if (par6 == 'White Noise') par6 <- 'white' else par6 <- 'ma'
par7 <- as.numeric(par7)
if (par8 != '') par8 <- as.numeric(par8)
ox <- x
if (par8 == '') {
if (par2 == 0) {
x <- log(x)
} else {
x <- (x ^ par2 - 1) / par2
}
} else {
x <- log(x,base=par8)
}
if (par3 > 0) x <- diff(x,lag=1,difference=par3)
if (par4 > 0) x <- diff(x,lag=par5,difference=par4)
bitmap(file='picts.png')
op <- par(mfrow=c(2,1))
plot(ox,type='l',main='Original Time Series',xlab='time',ylab='value')
if (par8=='') {
mytitle <- paste('Working Time Series (lambda=',par2,', d=',par3,', D=',par4,')',sep='')
mysub <- paste('(lambda=',par2,', d=',par3,', D=',par4,', CI=', par7, ', CI type=',par6,')',sep='')
} else {
mytitle <- paste('Working Time Series (base=',par8,', d=',par3,', D=',par4,')',sep='')
mysub <- paste('(base=',par8,', d=',par3,', D=',par4,', CI=', par7, ', CI type=',par6,')',sep='')
}
plot(x,type='l', main=mytitle,xlab='time',ylab='value')
par(op)
dev.off()
bitmap(file='pic1.png')
racf <- acf(x, par1, main='Autocorrelation', xlab='time lag', ylab='ACF', ci.type=par6, ci=par7, sub=mysub)
dev.off()
bitmap(file='pic2.png')
rpacf <- pacf(x,par1,main='Partial Autocorrelation',xlab='lags',ylab='PACF',sub=mysub)
dev.off()
(myacf <- c(racf$acf))
(mypacf <- c(rpacf$acf))
lengthx <- length(x)
sqrtn <- sqrt(lengthx)
load(file='createtable')
a<-table.start()
a<-table.row.start(a)
a<-table.element(a,'Autocorrelation Function',4,TRUE)
a<-table.row.end(a)
a<-table.row.start(a)
a<-table.element(a,'Time lag k',header=TRUE)
a<-table.element(a,hyperlink('basics.htm','ACF(k)','click here for more information about the Autocorrelation Function'),header=TRUE)
a<-table.element(a,'T-STAT',header=TRUE)
a<-table.element(a,'P-value',header=TRUE)
a<-table.row.end(a)
for (i in 2:(par1+1)) {
a<-table.row.start(a)
a<-table.element(a,i-1,header=TRUE)
a<-table.element(a,round(myacf[i],6))
mytstat <- myacf[i]*sqrtn
a<-table.element(a,round(mytstat,4))
a<-table.element(a,round(1-pt(abs(mytstat),lengthx),6))
a<-table.row.end(a)
}
a<-table.end(a)
table.save(a,file='mytable.tab')
a<-table.start()
a<-table.row.start(a)
a<-table.element(a,'Partial Autocorrelation Function',4,TRUE)
a<-table.row.end(a)
a<-table.row.start(a)
a<-table.element(a,'Time lag k',header=TRUE)
a<-table.element(a,hyperlink('basics.htm','PACF(k)','click here for more information about the Partial Autocorrelation Function'),header=TRUE)
a<-table.element(a,'T-STAT',header=TRUE)
a<-table.element(a,'P-value',header=TRUE)
a<-table.row.end(a)
for (i in 1:par1) {
a<-table.row.start(a)
a<-table.element(a,i,header=TRUE)
a<-table.element(a,round(mypacf[i],6))
mytstat <- mypacf[i]*sqrtn
a<-table.element(a,round(mytstat,4))
a<-table.element(a,round(1-pt(abs(mytstat),lengthx),6))
a<-table.row.end(a)
}
a<-table.end(a)
table.save(a,file='mytable1.tab')