Free Statistics

of Irreproducible Research!

Author's title

Author*Unverified author*
R Software Modulerwasp_smp.wasp
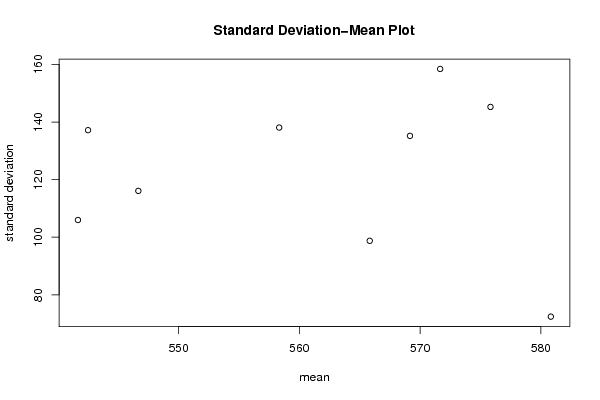
Title produced by softwareStandard Deviation-Mean Plot
Date of computationFri, 03 Aug 2012 12:53:13 -0400
Cite this page as followsStatistical Computations at FreeStatistics.org, Office for Research Development and Education, URL https://freestatistics.org/blog/index.php?v=date/2012/Aug/03/t13440129457jovj28iu441pmh.htm/, Retrieved Mon, 29 Apr 2024 19:24:06 +0000
Statistical Computations at FreeStatistics.org, Office for Research Development and Education, URL https://freestatistics.org/blog/index.php?pk=169010, Retrieved Mon, 29 Apr 2024 19:24:06 +0000
QR Codes:

Original text written by user:
IsPrivate?No (this computation is public)
User-defined keywordsyasmien naciri
Estimated Impact103
Family? (F = Feedback message, R = changed R code, M = changed R Module, P = changed Parameters, D = changed Data)
-       [Standard Deviation-Mean Plot] [] [2012-08-03 16:53:13] [d06e8713ea83045a022ab0926c74dd0b] [Current]
Feedback Forum

Post a new message
Dataseries X:
540
520
550
440
570
560
600
620
690
600
570
710
600
450
530
400
560
460
610
550
580
650
640
760
550
460
510
370
530
410
580
550
490
700
630
720
540
500
450
370
490
440
600
580
500
670
620
800
640
390
390
390
460
460
620
570
510
640
590
850
670
390
410
340
470
540
680
670
540
630
560
800
610
490
440
330
490
590
690
650
480
690
540
830
690
500
460
310
490
470
710
710
540
700
520
810
690
510
390
270
530
510
670
770
570
640
480
830


Summary of computational transaction
Raw Inputview raw input (R code)
Raw Outputview raw output of R engine
Computing time1 seconds
R Server'Gertrude Mary Cox' @ cox.wessa.net

\begin{tabular}{lllllllll}
\hline
Summary of computational transaction \tabularnewline
Raw Input & view raw input (R code)  \tabularnewline
Raw Output & view raw output of R engine  \tabularnewline
Computing time & 1 seconds \tabularnewline
R Server & 'Gertrude Mary Cox' @ cox.wessa.net \tabularnewline
\hline
\end{tabular}
%Source: https://freestatistics.org/blog/index.php?pk=169010&T=0

[TABLE]
[ROW][C]Summary of computational transaction[/C][/ROW]
[ROW][C]Raw Input[/C][C]view raw input (R code) [/C][/ROW]
[ROW][C]Raw Output[/C][C]view raw output of R engine [/C][/ROW]
[ROW][C]Computing time[/C][C]1 seconds[/C][/ROW]
[ROW][C]R Server[/C][C]'Gertrude Mary Cox' @ cox.wessa.net[/C][/ROW]
[/TABLE]
Source: https://freestatistics.org/blog/index.php?pk=169010&T=0

Globally Unique Identifier (entire table): ba.freestatistics.org/blog/index.php?pk=169010&T=0

As an alternative you can also use a QR Code:  

The GUIDs for individual cells are displayed in the table below:

Summary of computational transaction
Raw Inputview raw input (R code)
Raw Outputview raw output of R engine
Computing time1 seconds
R Server'Gertrude Mary Cox' @ cox.wessa.net


Standard Deviation-Mean Plot
SectionMeanStandard DeviationRange
1580.83333333333372.4202800995479270
2565.83333333333398.761267097926360
3541.666666666667105.987420637231350
4546.666666666667116.098182064957430
5542.5137.187661782882460
6558.333333333333138.09307357611460
7569.166666666667135.20747244905500
8575.833333333333145.255782756634500
9571.666666666667158.448921126212560

\begin{tabular}{lllllllll}
\hline
Standard Deviation-Mean Plot \tabularnewline
Section & Mean & Standard Deviation & Range \tabularnewline
1 & 580.833333333333 & 72.4202800995479 & 270 \tabularnewline
2 & 565.833333333333 & 98.761267097926 & 360 \tabularnewline
3 & 541.666666666667 & 105.987420637231 & 350 \tabularnewline
4 & 546.666666666667 & 116.098182064957 & 430 \tabularnewline
5 & 542.5 & 137.187661782882 & 460 \tabularnewline
6 & 558.333333333333 & 138.09307357611 & 460 \tabularnewline
7 & 569.166666666667 & 135.20747244905 & 500 \tabularnewline
8 & 575.833333333333 & 145.255782756634 & 500 \tabularnewline
9 & 571.666666666667 & 158.448921126212 & 560 \tabularnewline
\hline
\end{tabular}
%Source: https://freestatistics.org/blog/index.php?pk=169010&T=1

[TABLE]
[ROW][C]Standard Deviation-Mean Plot[/C][/ROW]
[ROW][C]Section[/C][C]Mean[/C][C]Standard Deviation[/C][C]Range[/C][/ROW]
[ROW][C]1[/C][C]580.833333333333[/C][C]72.4202800995479[/C][C]270[/C][/ROW]
[ROW][C]2[/C][C]565.833333333333[/C][C]98.761267097926[/C][C]360[/C][/ROW]
[ROW][C]3[/C][C]541.666666666667[/C][C]105.987420637231[/C][C]350[/C][/ROW]
[ROW][C]4[/C][C]546.666666666667[/C][C]116.098182064957[/C][C]430[/C][/ROW]
[ROW][C]5[/C][C]542.5[/C][C]137.187661782882[/C][C]460[/C][/ROW]
[ROW][C]6[/C][C]558.333333333333[/C][C]138.09307357611[/C][C]460[/C][/ROW]
[ROW][C]7[/C][C]569.166666666667[/C][C]135.20747244905[/C][C]500[/C][/ROW]
[ROW][C]8[/C][C]575.833333333333[/C][C]145.255782756634[/C][C]500[/C][/ROW]
[ROW][C]9[/C][C]571.666666666667[/C][C]158.448921126212[/C][C]560[/C][/ROW]
[/TABLE]
Source: https://freestatistics.org/blog/index.php?pk=169010&T=1

Globally Unique Identifier (entire table): ba.freestatistics.org/blog/index.php?pk=169010&T=1

As an alternative you can also use a QR Code:  

The GUIDs for individual cells are displayed in the table below:

Standard Deviation-Mean Plot
SectionMeanStandard DeviationRange
1580.83333333333372.4202800995479270
2565.83333333333398.761267097926360
3541.666666666667105.987420637231350
4546.666666666667116.098182064957430
5542.5137.187661782882460
6558.333333333333138.09307357611460
7569.166666666667135.20747244905500
8575.833333333333145.255782756634500
9571.666666666667158.448921126212560


Regression: S.E.(k) = alpha + beta * Mean(k)
alpha183.371409281723
beta-0.107448317059862
S.D.0.68875700161761
T-STAT-0.156003230177712
p-value0.880434120508983

\begin{tabular}{lllllllll}
\hline
Regression: S.E.(k) = alpha + beta * Mean(k) \tabularnewline
alpha & 183.371409281723 \tabularnewline
beta & -0.107448317059862 \tabularnewline
S.D. & 0.68875700161761 \tabularnewline
T-STAT & -0.156003230177712 \tabularnewline
p-value & 0.880434120508983 \tabularnewline
\hline
\end{tabular}
%Source: https://freestatistics.org/blog/index.php?pk=169010&T=2

[TABLE]
[ROW][C]Regression: S.E.(k) = alpha + beta * Mean(k)[/C][/ROW]
[ROW][C]alpha[/C][C]183.371409281723[/C][/ROW]
[ROW][C]beta[/C][C]-0.107448317059862[/C][/ROW]
[ROW][C]S.D.[/C][C]0.68875700161761[/C][/ROW]
[ROW][C]T-STAT[/C][C]-0.156003230177712[/C][/ROW]
[ROW][C]p-value[/C][C]0.880434120508983[/C][/ROW]
[/TABLE]
Source: https://freestatistics.org/blog/index.php?pk=169010&T=2

Globally Unique Identifier (entire table): ba.freestatistics.org/blog/index.php?pk=169010&T=2

As an alternative you can also use a QR Code:  

The GUIDs for individual cells are displayed in the table below:

Regression: S.E.(k) = alpha + beta * Mean(k)
alpha183.371409281723
beta-0.107448317059862
S.D.0.68875700161761
T-STAT-0.156003230177712
p-value0.880434120508983


Regression: ln S.E.(k) = alpha + beta * ln Mean(k)
alpha12.9940471607831
beta-1.29633550728107
S.D.3.45582772786274
T-STAT-0.375115778147539
p-value0.718681736243637
Lambda2.29633550728107

\begin{tabular}{lllllllll}
\hline
Regression: ln S.E.(k) = alpha + beta * ln Mean(k) \tabularnewline
alpha & 12.9940471607831 \tabularnewline
beta & -1.29633550728107 \tabularnewline
S.D. & 3.45582772786274 \tabularnewline
T-STAT & -0.375115778147539 \tabularnewline
p-value & 0.718681736243637 \tabularnewline
Lambda & 2.29633550728107 \tabularnewline
\hline
\end{tabular}
%Source: https://freestatistics.org/blog/index.php?pk=169010&T=3

[TABLE]
[ROW][C]Regression: ln S.E.(k) = alpha + beta * ln Mean(k)[/C][/ROW]
[ROW][C]alpha[/C][C]12.9940471607831[/C][/ROW]
[ROW][C]beta[/C][C]-1.29633550728107[/C][/ROW]
[ROW][C]S.D.[/C][C]3.45582772786274[/C][/ROW]
[ROW][C]T-STAT[/C][C]-0.375115778147539[/C][/ROW]
[ROW][C]p-value[/C][C]0.718681736243637[/C][/ROW]
[ROW][C]Lambda[/C][C]2.29633550728107[/C][/ROW]
[/TABLE]
Source: https://freestatistics.org/blog/index.php?pk=169010&T=3

Globally Unique Identifier (entire table): ba.freestatistics.org/blog/index.php?pk=169010&T=3

As an alternative you can also use a QR Code:  

The GUIDs for individual cells are displayed in the table below:

Regression: ln S.E.(k) = alpha + beta * ln Mean(k)
alpha12.9940471607831
beta-1.29633550728107
S.D.3.45582772786274
T-STAT-0.375115778147539
p-value0.718681736243637
Lambda2.29633550728107


Parameters (Session):
par1 = 12 ;
Parameters (R input):
par1 = 12 ;
R code (references can be found in the software module):
par1 <- as.numeric(par1)
(n <- length(x))
(np <- floor(n / par1))
arr <- array(NA,dim=c(par1,np))
j <- 0
k <- 1
for (i in 1:(np*par1))
{
j = j + 1
arr[j,k] <- x[i]
if (j == par1) {
j = 0
k=k+1
}
}
arr
arr.mean <- array(NA,dim=np)
arr.sd <- array(NA,dim=np)
arr.range <- array(NA,dim=np)
for (j in 1:np)
{
arr.mean[j] <- mean(arr[,j],na.rm=TRUE)
arr.sd[j] <- sd(arr[,j],na.rm=TRUE)
arr.range[j] <- max(arr[,j],na.rm=TRUE) - min(arr[,j],na.rm=TRUE)
}
arr.mean
arr.sd
arr.range
(lm1 <- lm(arr.sd~arr.mean))
(lnlm1 <- lm(log(arr.sd)~log(arr.mean)))
(lm2 <- lm(arr.range~arr.mean))
bitmap(file='test1.png')
plot(arr.mean,arr.sd,main='Standard Deviation-Mean Plot',xlab='mean',ylab='standard deviation')
dev.off()
bitmap(file='test2.png')
plot(arr.mean,arr.range,main='Range-Mean Plot',xlab='mean',ylab='range')
dev.off()
load(file='createtable')
a<-table.start()
a<-table.row.start(a)
a<-table.element(a,'Standard Deviation-Mean Plot',4,TRUE)
a<-table.row.end(a)
a<-table.row.start(a)
a<-table.element(a,'Section',header=TRUE)
a<-table.element(a,'Mean',header=TRUE)
a<-table.element(a,'Standard Deviation',header=TRUE)
a<-table.element(a,'Range',header=TRUE)
a<-table.row.end(a)
for (j in 1:np) {
a<-table.row.start(a)
a<-table.element(a,j,header=TRUE)
a<-table.element(a,arr.mean[j])
a<-table.element(a,arr.sd[j] )
a<-table.element(a,arr.range[j] )
a<-table.row.end(a)
}
a<-table.end(a)
table.save(a,file='mytable.tab')
a<-table.start()
a<-table.row.start(a)
a<-table.element(a,'Regression: S.E.(k) = alpha + beta * Mean(k)',2,TRUE)
a<-table.row.end(a)
a<-table.row.start(a)
a<-table.element(a,'alpha',header=TRUE)
a<-table.element(a,lm1$coefficients[[1]])
a<-table.row.end(a)
a<-table.row.start(a)
a<-table.element(a,'beta',header=TRUE)
a<-table.element(a,lm1$coefficients[[2]])
a<-table.row.end(a)
a<-table.row.start(a)
a<-table.element(a,'S.D.',header=TRUE)
a<-table.element(a,summary(lm1)$coefficients[2,2])
a<-table.row.end(a)
a<-table.row.start(a)
a<-table.element(a,'T-STAT',header=TRUE)
a<-table.element(a,summary(lm1)$coefficients[2,3])
a<-table.row.end(a)
a<-table.row.start(a)
a<-table.element(a,'p-value',header=TRUE)
a<-table.element(a,summary(lm1)$coefficients[2,4])
a<-table.row.end(a)
a<-table.end(a)
table.save(a,file='mytable1.tab')
a<-table.start()
a<-table.row.start(a)
a<-table.element(a,'Regression: ln S.E.(k) = alpha + beta * ln Mean(k)',2,TRUE)
a<-table.row.end(a)
a<-table.row.start(a)
a<-table.element(a,'alpha',header=TRUE)
a<-table.element(a,lnlm1$coefficients[[1]])
a<-table.row.end(a)
a<-table.row.start(a)
a<-table.element(a,'beta',header=TRUE)
a<-table.element(a,lnlm1$coefficients[[2]])
a<-table.row.end(a)
a<-table.row.start(a)
a<-table.element(a,'S.D.',header=TRUE)
a<-table.element(a,summary(lnlm1)$coefficients[2,2])
a<-table.row.end(a)
a<-table.row.start(a)
a<-table.element(a,'T-STAT',header=TRUE)
a<-table.element(a,summary(lnlm1)$coefficients[2,3])
a<-table.row.end(a)
a<-table.row.start(a)
a<-table.element(a,'p-value',header=TRUE)
a<-table.element(a,summary(lnlm1)$coefficients[2,4])
a<-table.row.end(a)
a<-table.row.start(a)
a<-table.element(a,'Lambda',header=TRUE)
a<-table.element(a,1-lnlm1$coefficients[[2]])
a<-table.row.end(a)
a<-table.end(a)
table.save(a,file='mytable2.tab')