Free Statistics

of Irreproducible Research!

Author's title

Author*Unverified author*
R Software Modulerwasp_autocorrelation.wasp
Title produced by software(Partial) Autocorrelation Function
Date of computationFri, 03 Aug 2012 07:59:55 -0400
Cite this page as followsStatistical Computations at FreeStatistics.org, Office for Research Development and Education, URL https://freestatistics.org/blog/index.php?v=date/2012/Aug/03/t1343995265kd776wf10jasyv1.htm/, Retrieved Mon, 29 Apr 2024 20:48:04 +0000
Statistical Computations at FreeStatistics.org, Office for Research Development and Education, URL https://freestatistics.org/blog/index.php?pk=168980, Retrieved Mon, 29 Apr 2024 20:48:04 +0000
QR Codes:

Original text written by user:
IsPrivate?No (this computation is public)
User-defined keywordsSelleslaghs Tessa
Estimated Impact116
Family? (F = Feedback message, R = changed R code, M = changed R Module, P = changed Parameters, D = changed Data)
-       [(Partial) Autocorrelation Function] [Tijdreeks A stap 21] [2012-08-03 11:59:55] [5f178b5bce8a01d64692a8a5c649399b] [Current]
Feedback Forum

Post a new message
Dataseries X:
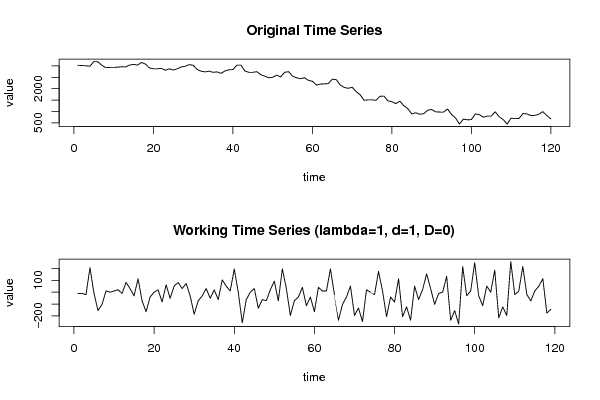
3028
3017
3007
2986
3193
3183
3028
2924
2935
2935
2945
2966
2955
3038
3069
3038
3152
3079
2914
2873
2873
2893
2811
2873
2821
2873
2955
2986
3059
3028
2842
2769
2738
2769
2718
2738
2676
2780
2831
2842
3038
3038
2780
2718
2718
2749
2614
2552
2480
2501
2594
2521
2718
2749
2552
2480
2439
2480
2366
2325
2160
2201
2211
2222
2418
2397
2160
2056
2015
2067
1870
1736
1488
1509
1509
1488
1664
1674
1467
1426
1343
1457
1250
1126
889
940
878
899
1054
1085
982
971
971
1106
868
713
444
661
630
641
889
858
744
796
796
982
765
641
444
703
682
692
909
889
816
827
878
992
816
672


Summary of computational transaction
Raw Inputview raw input (R code)
Raw Outputview raw output of R engine
Computing time2 seconds
R Server'Herman Ole Andreas Wold' @ wold.wessa.net

\begin{tabular}{lllllllll}
\hline
Summary of computational transaction \tabularnewline
Raw Input & view raw input (R code)  \tabularnewline
Raw Output & view raw output of R engine  \tabularnewline
Computing time & 2 seconds \tabularnewline
R Server & 'Herman Ole Andreas Wold' @ wold.wessa.net \tabularnewline
\hline
\end{tabular}
%Source: https://freestatistics.org/blog/index.php?pk=168980&T=0

[TABLE]
[ROW][C]Summary of computational transaction[/C][/ROW]
[ROW][C]Raw Input[/C][C]view raw input (R code) [/C][/ROW]
[ROW][C]Raw Output[/C][C]view raw output of R engine [/C][/ROW]
[ROW][C]Computing time[/C][C]2 seconds[/C][/ROW]
[ROW][C]R Server[/C][C]'Herman Ole Andreas Wold' @ wold.wessa.net[/C][/ROW]
[/TABLE]
Source: https://freestatistics.org/blog/index.php?pk=168980&T=0

Globally Unique Identifier (entire table): ba.freestatistics.org/blog/index.php?pk=168980&T=0

As an alternative you can also use a QR Code:  

The GUIDs for individual cells are displayed in the table below:

Summary of computational transaction
Raw Inputview raw input (R code)
Raw Outputview raw output of R engine
Computing time2 seconds
R Server'Herman Ole Andreas Wold' @ wold.wessa.net


Autocorrelation Function
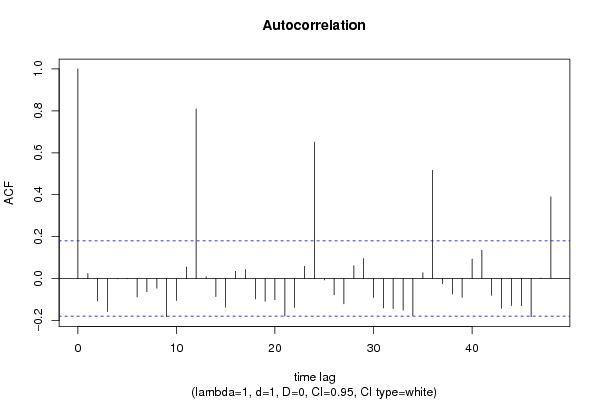
Time lag kACF(k)T-STATP-value
10.0242050.2640.396102
2-0.106728-1.16430.123322
3-0.15752-1.71830.044167
4-0.001142-0.01250.495042
5-0.000767-0.00840.496667
6-0.088356-0.96380.168538
7-0.063431-0.6920.245158
8-0.0457-0.49850.309516
9-0.181767-1.98280.024844
10-0.105148-1.1470.126835
110.0554270.60460.273285
120.8093298.82870
130.0086420.09430.462524
14-0.086076-0.9390.174821
15-0.136328-1.48720.069808
160.0342420.37350.354706
170.042490.46350.321924
18-0.097175-1.06010.145634
19-0.108429-1.18280.119619
20-0.10162-1.10850.13493
21-0.178539-1.94760.026907
22-0.138419-1.510.066851
230.0585680.63890.262059
240.6507667.0990
25-0.006358-0.06940.472413
26-0.077637-0.84690.19937
27-0.120538-1.31490.095534
280.0613280.6690.252394
290.095961.04680.148656
30-0.090926-0.99190.161632
31-0.140116-1.52850.064524
32-0.14301-1.56010.060701
33-0.149846-1.63460.052385
34-0.176593-1.92640.028219
350.0276230.30130.381846
360.5166945.63650
37-0.025238-0.27530.391774
38-0.073671-0.80370.211598
39-0.089146-0.97250.166395
400.0933921.01880.155186
410.1353921.4770.071165
42-0.079592-0.86820.193503
43-0.14152-1.54380.062646
44-0.128486-1.40160.081817
45-0.129964-1.41770.079439
46-0.181859-1.98380.024787
470.0009640.01050.495815
480.3897144.25132.1e-05

\begin{tabular}{lllllllll}
\hline
Autocorrelation Function \tabularnewline
Time lag k & ACF(k) & T-STAT & P-value \tabularnewline
1 & 0.024205 & 0.264 & 0.396102 \tabularnewline
2 & -0.106728 & -1.1643 & 0.123322 \tabularnewline
3 & -0.15752 & -1.7183 & 0.044167 \tabularnewline
4 & -0.001142 & -0.0125 & 0.495042 \tabularnewline
5 & -0.000767 & -0.0084 & 0.496667 \tabularnewline
6 & -0.088356 & -0.9638 & 0.168538 \tabularnewline
7 & -0.063431 & -0.692 & 0.245158 \tabularnewline
8 & -0.0457 & -0.4985 & 0.309516 \tabularnewline
9 & -0.181767 & -1.9828 & 0.024844 \tabularnewline
10 & -0.105148 & -1.147 & 0.126835 \tabularnewline
11 & 0.055427 & 0.6046 & 0.273285 \tabularnewline
12 & 0.809329 & 8.8287 & 0 \tabularnewline
13 & 0.008642 & 0.0943 & 0.462524 \tabularnewline
14 & -0.086076 & -0.939 & 0.174821 \tabularnewline
15 & -0.136328 & -1.4872 & 0.069808 \tabularnewline
16 & 0.034242 & 0.3735 & 0.354706 \tabularnewline
17 & 0.04249 & 0.4635 & 0.321924 \tabularnewline
18 & -0.097175 & -1.0601 & 0.145634 \tabularnewline
19 & -0.108429 & -1.1828 & 0.119619 \tabularnewline
20 & -0.10162 & -1.1085 & 0.13493 \tabularnewline
21 & -0.178539 & -1.9476 & 0.026907 \tabularnewline
22 & -0.138419 & -1.51 & 0.066851 \tabularnewline
23 & 0.058568 & 0.6389 & 0.262059 \tabularnewline
24 & 0.650766 & 7.099 & 0 \tabularnewline
25 & -0.006358 & -0.0694 & 0.472413 \tabularnewline
26 & -0.077637 & -0.8469 & 0.19937 \tabularnewline
27 & -0.120538 & -1.3149 & 0.095534 \tabularnewline
28 & 0.061328 & 0.669 & 0.252394 \tabularnewline
29 & 0.09596 & 1.0468 & 0.148656 \tabularnewline
30 & -0.090926 & -0.9919 & 0.161632 \tabularnewline
31 & -0.140116 & -1.5285 & 0.064524 \tabularnewline
32 & -0.14301 & -1.5601 & 0.060701 \tabularnewline
33 & -0.149846 & -1.6346 & 0.052385 \tabularnewline
34 & -0.176593 & -1.9264 & 0.028219 \tabularnewline
35 & 0.027623 & 0.3013 & 0.381846 \tabularnewline
36 & 0.516694 & 5.6365 & 0 \tabularnewline
37 & -0.025238 & -0.2753 & 0.391774 \tabularnewline
38 & -0.073671 & -0.8037 & 0.211598 \tabularnewline
39 & -0.089146 & -0.9725 & 0.166395 \tabularnewline
40 & 0.093392 & 1.0188 & 0.155186 \tabularnewline
41 & 0.135392 & 1.477 & 0.071165 \tabularnewline
42 & -0.079592 & -0.8682 & 0.193503 \tabularnewline
43 & -0.14152 & -1.5438 & 0.062646 \tabularnewline
44 & -0.128486 & -1.4016 & 0.081817 \tabularnewline
45 & -0.129964 & -1.4177 & 0.079439 \tabularnewline
46 & -0.181859 & -1.9838 & 0.024787 \tabularnewline
47 & 0.000964 & 0.0105 & 0.495815 \tabularnewline
48 & 0.389714 & 4.2513 & 2.1e-05 \tabularnewline
\hline
\end{tabular}
%Source: https://freestatistics.org/blog/index.php?pk=168980&T=1

[TABLE]
[ROW][C]Autocorrelation Function[/C][/ROW]
[ROW][C]Time lag k[/C][C]ACF(k)[/C][C]T-STAT[/C][C]P-value[/C][/ROW]
[ROW][C]1[/C][C]0.024205[/C][C]0.264[/C][C]0.396102[/C][/ROW]
[ROW][C]2[/C][C]-0.106728[/C][C]-1.1643[/C][C]0.123322[/C][/ROW]
[ROW][C]3[/C][C]-0.15752[/C][C]-1.7183[/C][C]0.044167[/C][/ROW]
[ROW][C]4[/C][C]-0.001142[/C][C]-0.0125[/C][C]0.495042[/C][/ROW]
[ROW][C]5[/C][C]-0.000767[/C][C]-0.0084[/C][C]0.496667[/C][/ROW]
[ROW][C]6[/C][C]-0.088356[/C][C]-0.9638[/C][C]0.168538[/C][/ROW]
[ROW][C]7[/C][C]-0.063431[/C][C]-0.692[/C][C]0.245158[/C][/ROW]
[ROW][C]8[/C][C]-0.0457[/C][C]-0.4985[/C][C]0.309516[/C][/ROW]
[ROW][C]9[/C][C]-0.181767[/C][C]-1.9828[/C][C]0.024844[/C][/ROW]
[ROW][C]10[/C][C]-0.105148[/C][C]-1.147[/C][C]0.126835[/C][/ROW]
[ROW][C]11[/C][C]0.055427[/C][C]0.6046[/C][C]0.273285[/C][/ROW]
[ROW][C]12[/C][C]0.809329[/C][C]8.8287[/C][C]0[/C][/ROW]
[ROW][C]13[/C][C]0.008642[/C][C]0.0943[/C][C]0.462524[/C][/ROW]
[ROW][C]14[/C][C]-0.086076[/C][C]-0.939[/C][C]0.174821[/C][/ROW]
[ROW][C]15[/C][C]-0.136328[/C][C]-1.4872[/C][C]0.069808[/C][/ROW]
[ROW][C]16[/C][C]0.034242[/C][C]0.3735[/C][C]0.354706[/C][/ROW]
[ROW][C]17[/C][C]0.04249[/C][C]0.4635[/C][C]0.321924[/C][/ROW]
[ROW][C]18[/C][C]-0.097175[/C][C]-1.0601[/C][C]0.145634[/C][/ROW]
[ROW][C]19[/C][C]-0.108429[/C][C]-1.1828[/C][C]0.119619[/C][/ROW]
[ROW][C]20[/C][C]-0.10162[/C][C]-1.1085[/C][C]0.13493[/C][/ROW]
[ROW][C]21[/C][C]-0.178539[/C][C]-1.9476[/C][C]0.026907[/C][/ROW]
[ROW][C]22[/C][C]-0.138419[/C][C]-1.51[/C][C]0.066851[/C][/ROW]
[ROW][C]23[/C][C]0.058568[/C][C]0.6389[/C][C]0.262059[/C][/ROW]
[ROW][C]24[/C][C]0.650766[/C][C]7.099[/C][C]0[/C][/ROW]
[ROW][C]25[/C][C]-0.006358[/C][C]-0.0694[/C][C]0.472413[/C][/ROW]
[ROW][C]26[/C][C]-0.077637[/C][C]-0.8469[/C][C]0.19937[/C][/ROW]
[ROW][C]27[/C][C]-0.120538[/C][C]-1.3149[/C][C]0.095534[/C][/ROW]
[ROW][C]28[/C][C]0.061328[/C][C]0.669[/C][C]0.252394[/C][/ROW]
[ROW][C]29[/C][C]0.09596[/C][C]1.0468[/C][C]0.148656[/C][/ROW]
[ROW][C]30[/C][C]-0.090926[/C][C]-0.9919[/C][C]0.161632[/C][/ROW]
[ROW][C]31[/C][C]-0.140116[/C][C]-1.5285[/C][C]0.064524[/C][/ROW]
[ROW][C]32[/C][C]-0.14301[/C][C]-1.5601[/C][C]0.060701[/C][/ROW]
[ROW][C]33[/C][C]-0.149846[/C][C]-1.6346[/C][C]0.052385[/C][/ROW]
[ROW][C]34[/C][C]-0.176593[/C][C]-1.9264[/C][C]0.028219[/C][/ROW]
[ROW][C]35[/C][C]0.027623[/C][C]0.3013[/C][C]0.381846[/C][/ROW]
[ROW][C]36[/C][C]0.516694[/C][C]5.6365[/C][C]0[/C][/ROW]
[ROW][C]37[/C][C]-0.025238[/C][C]-0.2753[/C][C]0.391774[/C][/ROW]
[ROW][C]38[/C][C]-0.073671[/C][C]-0.8037[/C][C]0.211598[/C][/ROW]
[ROW][C]39[/C][C]-0.089146[/C][C]-0.9725[/C][C]0.166395[/C][/ROW]
[ROW][C]40[/C][C]0.093392[/C][C]1.0188[/C][C]0.155186[/C][/ROW]
[ROW][C]41[/C][C]0.135392[/C][C]1.477[/C][C]0.071165[/C][/ROW]
[ROW][C]42[/C][C]-0.079592[/C][C]-0.8682[/C][C]0.193503[/C][/ROW]
[ROW][C]43[/C][C]-0.14152[/C][C]-1.5438[/C][C]0.062646[/C][/ROW]
[ROW][C]44[/C][C]-0.128486[/C][C]-1.4016[/C][C]0.081817[/C][/ROW]
[ROW][C]45[/C][C]-0.129964[/C][C]-1.4177[/C][C]0.079439[/C][/ROW]
[ROW][C]46[/C][C]-0.181859[/C][C]-1.9838[/C][C]0.024787[/C][/ROW]
[ROW][C]47[/C][C]0.000964[/C][C]0.0105[/C][C]0.495815[/C][/ROW]
[ROW][C]48[/C][C]0.389714[/C][C]4.2513[/C][C]2.1e-05[/C][/ROW]
[/TABLE]
Source: https://freestatistics.org/blog/index.php?pk=168980&T=1

Globally Unique Identifier (entire table): ba.freestatistics.org/blog/index.php?pk=168980&T=1

As an alternative you can also use a QR Code:  

The GUIDs for individual cells are displayed in the table below:

Autocorrelation Function
Time lag kACF(k)T-STATP-value
10.0242050.2640.396102
2-0.106728-1.16430.123322
3-0.15752-1.71830.044167
4-0.001142-0.01250.495042
5-0.000767-0.00840.496667
6-0.088356-0.96380.168538
7-0.063431-0.6920.245158
8-0.0457-0.49850.309516
9-0.181767-1.98280.024844
10-0.105148-1.1470.126835
110.0554270.60460.273285
120.8093298.82870
130.0086420.09430.462524
14-0.086076-0.9390.174821
15-0.136328-1.48720.069808
160.0342420.37350.354706
170.042490.46350.321924
18-0.097175-1.06010.145634
19-0.108429-1.18280.119619
20-0.10162-1.10850.13493
21-0.178539-1.94760.026907
22-0.138419-1.510.066851
230.0585680.63890.262059
240.6507667.0990
25-0.006358-0.06940.472413
26-0.077637-0.84690.19937
27-0.120538-1.31490.095534
280.0613280.6690.252394
290.095961.04680.148656
30-0.090926-0.99190.161632
31-0.140116-1.52850.064524
32-0.14301-1.56010.060701
33-0.149846-1.63460.052385
34-0.176593-1.92640.028219
350.0276230.30130.381846
360.5166945.63650
37-0.025238-0.27530.391774
38-0.073671-0.80370.211598
39-0.089146-0.97250.166395
400.0933921.01880.155186
410.1353921.4770.071165
42-0.079592-0.86820.193503
43-0.14152-1.54380.062646
44-0.128486-1.40160.081817
45-0.129964-1.41770.079439
46-0.181859-1.98380.024787
470.0009640.01050.495815
480.3897144.25132.1e-05


Partial Autocorrelation Function
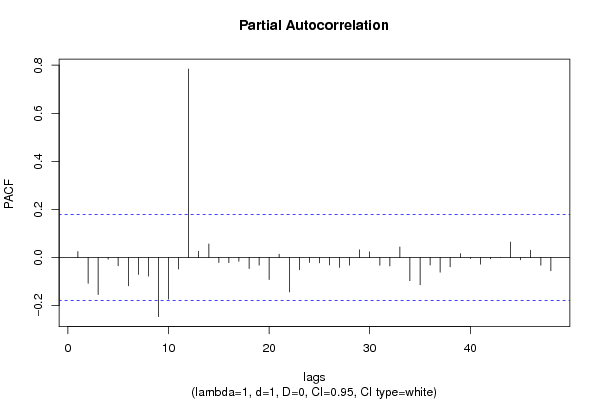
Time lag kPACF(k)T-STATP-value
10.0242050.2640.396102
2-0.107377-1.17130.1219
3-0.153924-1.67910.047877
4-0.007068-0.07710.469335
5-0.034616-0.37760.353192
6-0.117471-1.28150.101262
7-0.070643-0.77060.221227
8-0.077578-0.84630.199549
9-0.246329-2.68710.004119
10-0.173294-1.89040.030567
11-0.04794-0.5230.300984
120.7844198.5570
130.025520.27840.390598
140.0558510.60930.271758
15-0.021098-0.23020.409183
16-0.021605-0.23570.407044
17-0.015574-0.16990.432691
18-0.045884-0.50050.308812
19-0.031923-0.34820.36414
20-0.091835-1.00180.159236
210.0134960.14720.441603
22-0.143272-1.56290.060365
23-0.051203-0.55860.288756
24-0.021145-0.23070.408986
25-0.022465-0.24510.403416
26-0.030945-0.33760.368142
27-0.041376-0.45140.326275
28-0.032122-0.35040.363326
290.0317450.34630.364867
300.0233290.25450.399778
31-0.032361-0.3530.362349
32-0.035038-0.38220.351492
330.0434270.47370.31828
34-0.096599-1.05380.147061
35-0.113362-1.23660.109329
36-0.03162-0.34490.365379
37-0.061146-0.6670.253024
38-0.039024-0.42570.335545
390.0155440.16960.432821
40-0.004123-0.0450.4821
41-0.027758-0.30280.381285
42-0.005691-0.06210.475299
43-0.000294-0.00320.498723
440.0637590.69550.244039
45-0.009791-0.10680.457563
460.0298250.32540.372743
47-0.032643-0.35610.361199
48-0.055395-0.60430.273401

\begin{tabular}{lllllllll}
\hline
Partial Autocorrelation Function \tabularnewline
Time lag k & PACF(k) & T-STAT & P-value \tabularnewline
1 & 0.024205 & 0.264 & 0.396102 \tabularnewline
2 & -0.107377 & -1.1713 & 0.1219 \tabularnewline
3 & -0.153924 & -1.6791 & 0.047877 \tabularnewline
4 & -0.007068 & -0.0771 & 0.469335 \tabularnewline
5 & -0.034616 & -0.3776 & 0.353192 \tabularnewline
6 & -0.117471 & -1.2815 & 0.101262 \tabularnewline
7 & -0.070643 & -0.7706 & 0.221227 \tabularnewline
8 & -0.077578 & -0.8463 & 0.199549 \tabularnewline
9 & -0.246329 & -2.6871 & 0.004119 \tabularnewline
10 & -0.173294 & -1.8904 & 0.030567 \tabularnewline
11 & -0.04794 & -0.523 & 0.300984 \tabularnewline
12 & 0.784419 & 8.557 & 0 \tabularnewline
13 & 0.02552 & 0.2784 & 0.390598 \tabularnewline
14 & 0.055851 & 0.6093 & 0.271758 \tabularnewline
15 & -0.021098 & -0.2302 & 0.409183 \tabularnewline
16 & -0.021605 & -0.2357 & 0.407044 \tabularnewline
17 & -0.015574 & -0.1699 & 0.432691 \tabularnewline
18 & -0.045884 & -0.5005 & 0.308812 \tabularnewline
19 & -0.031923 & -0.3482 & 0.36414 \tabularnewline
20 & -0.091835 & -1.0018 & 0.159236 \tabularnewline
21 & 0.013496 & 0.1472 & 0.441603 \tabularnewline
22 & -0.143272 & -1.5629 & 0.060365 \tabularnewline
23 & -0.051203 & -0.5586 & 0.288756 \tabularnewline
24 & -0.021145 & -0.2307 & 0.408986 \tabularnewline
25 & -0.022465 & -0.2451 & 0.403416 \tabularnewline
26 & -0.030945 & -0.3376 & 0.368142 \tabularnewline
27 & -0.041376 & -0.4514 & 0.326275 \tabularnewline
28 & -0.032122 & -0.3504 & 0.363326 \tabularnewline
29 & 0.031745 & 0.3463 & 0.364867 \tabularnewline
30 & 0.023329 & 0.2545 & 0.399778 \tabularnewline
31 & -0.032361 & -0.353 & 0.362349 \tabularnewline
32 & -0.035038 & -0.3822 & 0.351492 \tabularnewline
33 & 0.043427 & 0.4737 & 0.31828 \tabularnewline
34 & -0.096599 & -1.0538 & 0.147061 \tabularnewline
35 & -0.113362 & -1.2366 & 0.109329 \tabularnewline
36 & -0.03162 & -0.3449 & 0.365379 \tabularnewline
37 & -0.061146 & -0.667 & 0.253024 \tabularnewline
38 & -0.039024 & -0.4257 & 0.335545 \tabularnewline
39 & 0.015544 & 0.1696 & 0.432821 \tabularnewline
40 & -0.004123 & -0.045 & 0.4821 \tabularnewline
41 & -0.027758 & -0.3028 & 0.381285 \tabularnewline
42 & -0.005691 & -0.0621 & 0.475299 \tabularnewline
43 & -0.000294 & -0.0032 & 0.498723 \tabularnewline
44 & 0.063759 & 0.6955 & 0.244039 \tabularnewline
45 & -0.009791 & -0.1068 & 0.457563 \tabularnewline
46 & 0.029825 & 0.3254 & 0.372743 \tabularnewline
47 & -0.032643 & -0.3561 & 0.361199 \tabularnewline
48 & -0.055395 & -0.6043 & 0.273401 \tabularnewline
\hline
\end{tabular}
%Source: https://freestatistics.org/blog/index.php?pk=168980&T=2

[TABLE]
[ROW][C]Partial Autocorrelation Function[/C][/ROW]
[ROW][C]Time lag k[/C][C]PACF(k)[/C][C]T-STAT[/C][C]P-value[/C][/ROW]
[ROW][C]1[/C][C]0.024205[/C][C]0.264[/C][C]0.396102[/C][/ROW]
[ROW][C]2[/C][C]-0.107377[/C][C]-1.1713[/C][C]0.1219[/C][/ROW]
[ROW][C]3[/C][C]-0.153924[/C][C]-1.6791[/C][C]0.047877[/C][/ROW]
[ROW][C]4[/C][C]-0.007068[/C][C]-0.0771[/C][C]0.469335[/C][/ROW]
[ROW][C]5[/C][C]-0.034616[/C][C]-0.3776[/C][C]0.353192[/C][/ROW]
[ROW][C]6[/C][C]-0.117471[/C][C]-1.2815[/C][C]0.101262[/C][/ROW]
[ROW][C]7[/C][C]-0.070643[/C][C]-0.7706[/C][C]0.221227[/C][/ROW]
[ROW][C]8[/C][C]-0.077578[/C][C]-0.8463[/C][C]0.199549[/C][/ROW]
[ROW][C]9[/C][C]-0.246329[/C][C]-2.6871[/C][C]0.004119[/C][/ROW]
[ROW][C]10[/C][C]-0.173294[/C][C]-1.8904[/C][C]0.030567[/C][/ROW]
[ROW][C]11[/C][C]-0.04794[/C][C]-0.523[/C][C]0.300984[/C][/ROW]
[ROW][C]12[/C][C]0.784419[/C][C]8.557[/C][C]0[/C][/ROW]
[ROW][C]13[/C][C]0.02552[/C][C]0.2784[/C][C]0.390598[/C][/ROW]
[ROW][C]14[/C][C]0.055851[/C][C]0.6093[/C][C]0.271758[/C][/ROW]
[ROW][C]15[/C][C]-0.021098[/C][C]-0.2302[/C][C]0.409183[/C][/ROW]
[ROW][C]16[/C][C]-0.021605[/C][C]-0.2357[/C][C]0.407044[/C][/ROW]
[ROW][C]17[/C][C]-0.015574[/C][C]-0.1699[/C][C]0.432691[/C][/ROW]
[ROW][C]18[/C][C]-0.045884[/C][C]-0.5005[/C][C]0.308812[/C][/ROW]
[ROW][C]19[/C][C]-0.031923[/C][C]-0.3482[/C][C]0.36414[/C][/ROW]
[ROW][C]20[/C][C]-0.091835[/C][C]-1.0018[/C][C]0.159236[/C][/ROW]
[ROW][C]21[/C][C]0.013496[/C][C]0.1472[/C][C]0.441603[/C][/ROW]
[ROW][C]22[/C][C]-0.143272[/C][C]-1.5629[/C][C]0.060365[/C][/ROW]
[ROW][C]23[/C][C]-0.051203[/C][C]-0.5586[/C][C]0.288756[/C][/ROW]
[ROW][C]24[/C][C]-0.021145[/C][C]-0.2307[/C][C]0.408986[/C][/ROW]
[ROW][C]25[/C][C]-0.022465[/C][C]-0.2451[/C][C]0.403416[/C][/ROW]
[ROW][C]26[/C][C]-0.030945[/C][C]-0.3376[/C][C]0.368142[/C][/ROW]
[ROW][C]27[/C][C]-0.041376[/C][C]-0.4514[/C][C]0.326275[/C][/ROW]
[ROW][C]28[/C][C]-0.032122[/C][C]-0.3504[/C][C]0.363326[/C][/ROW]
[ROW][C]29[/C][C]0.031745[/C][C]0.3463[/C][C]0.364867[/C][/ROW]
[ROW][C]30[/C][C]0.023329[/C][C]0.2545[/C][C]0.399778[/C][/ROW]
[ROW][C]31[/C][C]-0.032361[/C][C]-0.353[/C][C]0.362349[/C][/ROW]
[ROW][C]32[/C][C]-0.035038[/C][C]-0.3822[/C][C]0.351492[/C][/ROW]
[ROW][C]33[/C][C]0.043427[/C][C]0.4737[/C][C]0.31828[/C][/ROW]
[ROW][C]34[/C][C]-0.096599[/C][C]-1.0538[/C][C]0.147061[/C][/ROW]
[ROW][C]35[/C][C]-0.113362[/C][C]-1.2366[/C][C]0.109329[/C][/ROW]
[ROW][C]36[/C][C]-0.03162[/C][C]-0.3449[/C][C]0.365379[/C][/ROW]
[ROW][C]37[/C][C]-0.061146[/C][C]-0.667[/C][C]0.253024[/C][/ROW]
[ROW][C]38[/C][C]-0.039024[/C][C]-0.4257[/C][C]0.335545[/C][/ROW]
[ROW][C]39[/C][C]0.015544[/C][C]0.1696[/C][C]0.432821[/C][/ROW]
[ROW][C]40[/C][C]-0.004123[/C][C]-0.045[/C][C]0.4821[/C][/ROW]
[ROW][C]41[/C][C]-0.027758[/C][C]-0.3028[/C][C]0.381285[/C][/ROW]
[ROW][C]42[/C][C]-0.005691[/C][C]-0.0621[/C][C]0.475299[/C][/ROW]
[ROW][C]43[/C][C]-0.000294[/C][C]-0.0032[/C][C]0.498723[/C][/ROW]
[ROW][C]44[/C][C]0.063759[/C][C]0.6955[/C][C]0.244039[/C][/ROW]
[ROW][C]45[/C][C]-0.009791[/C][C]-0.1068[/C][C]0.457563[/C][/ROW]
[ROW][C]46[/C][C]0.029825[/C][C]0.3254[/C][C]0.372743[/C][/ROW]
[ROW][C]47[/C][C]-0.032643[/C][C]-0.3561[/C][C]0.361199[/C][/ROW]
[ROW][C]48[/C][C]-0.055395[/C][C]-0.6043[/C][C]0.273401[/C][/ROW]
[/TABLE]
Source: https://freestatistics.org/blog/index.php?pk=168980&T=2

Globally Unique Identifier (entire table): ba.freestatistics.org/blog/index.php?pk=168980&T=2

As an alternative you can also use a QR Code:  

The GUIDs for individual cells are displayed in the table below:

Partial Autocorrelation Function
Time lag kPACF(k)T-STATP-value
10.0242050.2640.396102
2-0.107377-1.17130.1219
3-0.153924-1.67910.047877
4-0.007068-0.07710.469335
5-0.034616-0.37760.353192
6-0.117471-1.28150.101262
7-0.070643-0.77060.221227
8-0.077578-0.84630.199549
9-0.246329-2.68710.004119
10-0.173294-1.89040.030567
11-0.04794-0.5230.300984
120.7844198.5570
130.025520.27840.390598
140.0558510.60930.271758
15-0.021098-0.23020.409183
16-0.021605-0.23570.407044
17-0.015574-0.16990.432691
18-0.045884-0.50050.308812
19-0.031923-0.34820.36414
20-0.091835-1.00180.159236
210.0134960.14720.441603
22-0.143272-1.56290.060365
23-0.051203-0.55860.288756
24-0.021145-0.23070.408986
25-0.022465-0.24510.403416
26-0.030945-0.33760.368142
27-0.041376-0.45140.326275
28-0.032122-0.35040.363326
290.0317450.34630.364867
300.0233290.25450.399778
31-0.032361-0.3530.362349
32-0.035038-0.38220.351492
330.0434270.47370.31828
34-0.096599-1.05380.147061
35-0.113362-1.23660.109329
36-0.03162-0.34490.365379
37-0.061146-0.6670.253024
38-0.039024-0.42570.335545
390.0155440.16960.432821
40-0.004123-0.0450.4821
41-0.027758-0.30280.381285
42-0.005691-0.06210.475299
43-0.000294-0.00320.498723
440.0637590.69550.244039
45-0.009791-0.10680.457563
460.0298250.32540.372743
47-0.032643-0.35610.361199
48-0.055395-0.60430.273401


Parameters (Session):
par1 = 48 ; par2 = 1 ; par3 = 0 ; par4 = 0 ; par5 = 12 ; par6 = White Noise ; par7 = 0.95 ;
Parameters (R input):
par1 = 48 ; par2 = 1 ; par3 = 1 ; par4 = 0 ; par5 = 12 ; par6 = White Noise ; par7 = 0.95 ; par8 = ;
R code (references can be found in the software module):
if (par1 == 'Default') {
par1 = 10*log10(length(x))
} else {
par1 <- as.numeric(par1)
}
par2 <- as.numeric(par2)
par3 <- as.numeric(par3)
par4 <- as.numeric(par4)
par5 <- as.numeric(par5)
if (par6 == 'White Noise') par6 <- 'white' else par6 <- 'ma'
par7 <- as.numeric(par7)
if (par8 != '') par8 <- as.numeric(par8)
ox <- x
if (par8 == '') {
if (par2 == 0) {
x <- log(x)
} else {
x <- (x ^ par2 - 1) / par2
}
} else {
x <- log(x,base=par8)
}
if (par3 > 0) x <- diff(x,lag=1,difference=par3)
if (par4 > 0) x <- diff(x,lag=par5,difference=par4)
bitmap(file='picts.png')
op <- par(mfrow=c(2,1))
plot(ox,type='l',main='Original Time Series',xlab='time',ylab='value')
if (par8=='') {
mytitle <- paste('Working Time Series (lambda=',par2,', d=',par3,', D=',par4,')',sep='')
mysub <- paste('(lambda=',par2,', d=',par3,', D=',par4,', CI=', par7, ', CI type=',par6,')',sep='')
} else {
mytitle <- paste('Working Time Series (base=',par8,', d=',par3,', D=',par4,')',sep='')
mysub <- paste('(base=',par8,', d=',par3,', D=',par4,', CI=', par7, ', CI type=',par6,')',sep='')
}
plot(x,type='l', main=mytitle,xlab='time',ylab='value')
par(op)
dev.off()
bitmap(file='pic1.png')
racf <- acf(x, par1, main='Autocorrelation', xlab='time lag', ylab='ACF', ci.type=par6, ci=par7, sub=mysub)
dev.off()
bitmap(file='pic2.png')
rpacf <- pacf(x,par1,main='Partial Autocorrelation',xlab='lags',ylab='PACF',sub=mysub)
dev.off()
(myacf <- c(racf$acf))
(mypacf <- c(rpacf$acf))
lengthx <- length(x)
sqrtn <- sqrt(lengthx)
load(file='createtable')
a<-table.start()
a<-table.row.start(a)
a<-table.element(a,'Autocorrelation Function',4,TRUE)
a<-table.row.end(a)
a<-table.row.start(a)
a<-table.element(a,'Time lag k',header=TRUE)
a<-table.element(a,hyperlink('basics.htm','ACF(k)','click here for more information about the Autocorrelation Function'),header=TRUE)
a<-table.element(a,'T-STAT',header=TRUE)
a<-table.element(a,'P-value',header=TRUE)
a<-table.row.end(a)
for (i in 2:(par1+1)) {
a<-table.row.start(a)
a<-table.element(a,i-1,header=TRUE)
a<-table.element(a,round(myacf[i],6))
mytstat <- myacf[i]*sqrtn
a<-table.element(a,round(mytstat,4))
a<-table.element(a,round(1-pt(abs(mytstat),lengthx),6))
a<-table.row.end(a)
}
a<-table.end(a)
table.save(a,file='mytable.tab')
a<-table.start()
a<-table.row.start(a)
a<-table.element(a,'Partial Autocorrelation Function',4,TRUE)
a<-table.row.end(a)
a<-table.row.start(a)
a<-table.element(a,'Time lag k',header=TRUE)
a<-table.element(a,hyperlink('basics.htm','PACF(k)','click here for more information about the Partial Autocorrelation Function'),header=TRUE)
a<-table.element(a,'T-STAT',header=TRUE)
a<-table.element(a,'P-value',header=TRUE)
a<-table.row.end(a)
for (i in 1:par1) {
a<-table.row.start(a)
a<-table.element(a,i,header=TRUE)
a<-table.element(a,round(mypacf[i],6))
mytstat <- mypacf[i]*sqrtn
a<-table.element(a,round(mytstat,4))
a<-table.element(a,round(1-pt(abs(mytstat),lengthx),6))
a<-table.row.end(a)
}
a<-table.end(a)
table.save(a,file='mytable1.tab')