Free Statistics

of Irreproducible Research!

Author's title

Author*Unverified author*
R Software Modulerwasp_autocorrelation.wasp
Title produced by software(Partial) Autocorrelation Function
Date of computationFri, 03 Aug 2012 07:52:22 -0400
Cite this page as followsStatistical Computations at FreeStatistics.org, Office for Research Development and Education, URL https://freestatistics.org/blog/index.php?v=date/2012/Aug/03/t13439949650q3hymf87a0860b.htm/, Retrieved Mon, 29 Apr 2024 23:32:32 +0000
Statistical Computations at FreeStatistics.org, Office for Research Development and Education, URL https://freestatistics.org/blog/index.php?pk=168979, Retrieved Mon, 29 Apr 2024 23:32:32 +0000
QR Codes:

Original text written by user:
IsPrivate?No (this computation is public)
User-defined keywordsSelleslaghs Tessa
Estimated Impact107
Family? (F = Feedback message, R = changed R code, M = changed R Module, P = changed Parameters, D = changed Data)
-       [(Partial) Autocorrelation Function] [Tijdreeks A stap 20] [2012-08-03 11:52:22] [5f178b5bce8a01d64692a8a5c649399b] [Current]
Feedback Forum

Post a new message
Dataseries X:
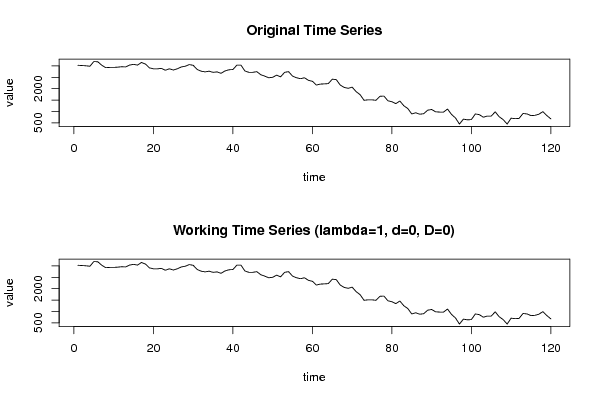
3028
3017
3007
2986
3193
3183
3028
2924
2935
2935
2945
2966
2955
3038
3069
3038
3152
3079
2914
2873
2873
2893
2811
2873
2821
2873
2955
2986
3059
3028
2842
2769
2738
2769
2718
2738
2676
2780
2831
2842
3038
3038
2780
2718
2718
2749
2614
2552
2480
2501
2594
2521
2718
2749
2552
2480
2439
2480
2366
2325
2160
2201
2211
2222
2418
2397
2160
2056
2015
2067
1870
1736
1488
1509
1509
1488
1664
1674
1467
1426
1343
1457
1250
1126
889
940
878
899
1054
1085
982
971
971
1106
868
713
444
661
630
641
889
858
744
796
796
982
765
641
444
703
682
692
909
889
816
827
878
992
816
672


Summary of computational transaction
Raw Inputview raw input (R code)
Raw Outputview raw output of R engine
Computing time2 seconds
R Server'AstonUniversity' @ aston.wessa.net

\begin{tabular}{lllllllll}
\hline
Summary of computational transaction \tabularnewline
Raw Input & view raw input (R code)  \tabularnewline
Raw Output & view raw output of R engine  \tabularnewline
Computing time & 2 seconds \tabularnewline
R Server & 'AstonUniversity' @ aston.wessa.net \tabularnewline
\hline
\end{tabular}
%Source: https://freestatistics.org/blog/index.php?pk=168979&T=0

[TABLE]
[ROW][C]Summary of computational transaction[/C][/ROW]
[ROW][C]Raw Input[/C][C]view raw input (R code) [/C][/ROW]
[ROW][C]Raw Output[/C][C]view raw output of R engine [/C][/ROW]
[ROW][C]Computing time[/C][C]2 seconds[/C][/ROW]
[ROW][C]R Server[/C][C]'AstonUniversity' @ aston.wessa.net[/C][/ROW]
[/TABLE]
Source: https://freestatistics.org/blog/index.php?pk=168979&T=0

Globally Unique Identifier (entire table): ba.freestatistics.org/blog/index.php?pk=168979&T=0

As an alternative you can also use a QR Code:  

The GUIDs for individual cells are displayed in the table below:

Summary of computational transaction
Raw Inputview raw input (R code)
Raw Outputview raw output of R engine
Computing time2 seconds
R Server'AstonUniversity' @ aston.wessa.net


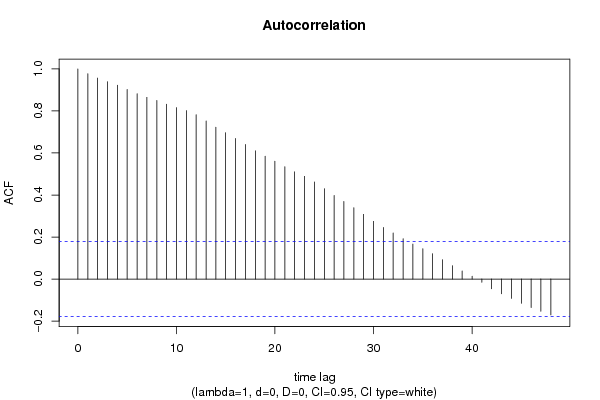
Autocorrelation Function
Time lag kACF(k)T-STATP-value
10.97755810.70860
20.95635810.47640
30.93892710.28540
40.92222110.10240
50.9022389.88350
60.8817279.65880
70.8647379.47270
80.8496549.30750
90.8317559.11140
100.816118.940
110.8018248.78350
120.7823828.57060
130.7524118.24230
140.7226337.91610
150.6963757.62840
160.6695577.33460
170.6404987.01630
180.6102726.68520
190.5843356.40110
200.5604826.13980
210.5343445.85340
220.5101415.58830
230.488875.35530
240.4625155.06661e-06
250.4295314.70533e-06
260.3977224.35681.4e-05
270.3690624.04294.7e-05
280.339653.72070.000152
290.3079943.37390.000499
300.2747613.00990.001593
310.2457962.69260.004052
320.2189062.3980.009013
330.1919972.10320.018767
340.1663491.82230.035453
350.1443681.58150.058202
360.1205441.32050.094591
370.0919441.00720.157933
380.0639120.70010.242602
390.0389110.42620.335345
400.0132060.14470.442609
41-0.015332-0.1680.433449
42-0.045933-0.50320.307883
43-0.070215-0.76920.221652
44-0.092142-1.00940.157416
45-0.114845-1.25810.105405
46-0.13595-1.48930.069522
47-0.153201-1.67820.047952
48-0.170518-1.86790.032105

\begin{tabular}{lllllllll}
\hline
Autocorrelation Function \tabularnewline
Time lag k & ACF(k) & T-STAT & P-value \tabularnewline
1 & 0.977558 & 10.7086 & 0 \tabularnewline
2 & 0.956358 & 10.4764 & 0 \tabularnewline
3 & 0.938927 & 10.2854 & 0 \tabularnewline
4 & 0.922221 & 10.1024 & 0 \tabularnewline
5 & 0.902238 & 9.8835 & 0 \tabularnewline
6 & 0.881727 & 9.6588 & 0 \tabularnewline
7 & 0.864737 & 9.4727 & 0 \tabularnewline
8 & 0.849654 & 9.3075 & 0 \tabularnewline
9 & 0.831755 & 9.1114 & 0 \tabularnewline
10 & 0.81611 & 8.94 & 0 \tabularnewline
11 & 0.801824 & 8.7835 & 0 \tabularnewline
12 & 0.782382 & 8.5706 & 0 \tabularnewline
13 & 0.752411 & 8.2423 & 0 \tabularnewline
14 & 0.722633 & 7.9161 & 0 \tabularnewline
15 & 0.696375 & 7.6284 & 0 \tabularnewline
16 & 0.669557 & 7.3346 & 0 \tabularnewline
17 & 0.640498 & 7.0163 & 0 \tabularnewline
18 & 0.610272 & 6.6852 & 0 \tabularnewline
19 & 0.584335 & 6.4011 & 0 \tabularnewline
20 & 0.560482 & 6.1398 & 0 \tabularnewline
21 & 0.534344 & 5.8534 & 0 \tabularnewline
22 & 0.510141 & 5.5883 & 0 \tabularnewline
23 & 0.48887 & 5.3553 & 0 \tabularnewline
24 & 0.462515 & 5.0666 & 1e-06 \tabularnewline
25 & 0.429531 & 4.7053 & 3e-06 \tabularnewline
26 & 0.397722 & 4.3568 & 1.4e-05 \tabularnewline
27 & 0.369062 & 4.0429 & 4.7e-05 \tabularnewline
28 & 0.33965 & 3.7207 & 0.000152 \tabularnewline
29 & 0.307994 & 3.3739 & 0.000499 \tabularnewline
30 & 0.274761 & 3.0099 & 0.001593 \tabularnewline
31 & 0.245796 & 2.6926 & 0.004052 \tabularnewline
32 & 0.218906 & 2.398 & 0.009013 \tabularnewline
33 & 0.191997 & 2.1032 & 0.018767 \tabularnewline
34 & 0.166349 & 1.8223 & 0.035453 \tabularnewline
35 & 0.144368 & 1.5815 & 0.058202 \tabularnewline
36 & 0.120544 & 1.3205 & 0.094591 \tabularnewline
37 & 0.091944 & 1.0072 & 0.157933 \tabularnewline
38 & 0.063912 & 0.7001 & 0.242602 \tabularnewline
39 & 0.038911 & 0.4262 & 0.335345 \tabularnewline
40 & 0.013206 & 0.1447 & 0.442609 \tabularnewline
41 & -0.015332 & -0.168 & 0.433449 \tabularnewline
42 & -0.045933 & -0.5032 & 0.307883 \tabularnewline
43 & -0.070215 & -0.7692 & 0.221652 \tabularnewline
44 & -0.092142 & -1.0094 & 0.157416 \tabularnewline
45 & -0.114845 & -1.2581 & 0.105405 \tabularnewline
46 & -0.13595 & -1.4893 & 0.069522 \tabularnewline
47 & -0.153201 & -1.6782 & 0.047952 \tabularnewline
48 & -0.170518 & -1.8679 & 0.032105 \tabularnewline
\hline
\end{tabular}
%Source: https://freestatistics.org/blog/index.php?pk=168979&T=1

[TABLE]
[ROW][C]Autocorrelation Function[/C][/ROW]
[ROW][C]Time lag k[/C][C]ACF(k)[/C][C]T-STAT[/C][C]P-value[/C][/ROW]
[ROW][C]1[/C][C]0.977558[/C][C]10.7086[/C][C]0[/C][/ROW]
[ROW][C]2[/C][C]0.956358[/C][C]10.4764[/C][C]0[/C][/ROW]
[ROW][C]3[/C][C]0.938927[/C][C]10.2854[/C][C]0[/C][/ROW]
[ROW][C]4[/C][C]0.922221[/C][C]10.1024[/C][C]0[/C][/ROW]
[ROW][C]5[/C][C]0.902238[/C][C]9.8835[/C][C]0[/C][/ROW]
[ROW][C]6[/C][C]0.881727[/C][C]9.6588[/C][C]0[/C][/ROW]
[ROW][C]7[/C][C]0.864737[/C][C]9.4727[/C][C]0[/C][/ROW]
[ROW][C]8[/C][C]0.849654[/C][C]9.3075[/C][C]0[/C][/ROW]
[ROW][C]9[/C][C]0.831755[/C][C]9.1114[/C][C]0[/C][/ROW]
[ROW][C]10[/C][C]0.81611[/C][C]8.94[/C][C]0[/C][/ROW]
[ROW][C]11[/C][C]0.801824[/C][C]8.7835[/C][C]0[/C][/ROW]
[ROW][C]12[/C][C]0.782382[/C][C]8.5706[/C][C]0[/C][/ROW]
[ROW][C]13[/C][C]0.752411[/C][C]8.2423[/C][C]0[/C][/ROW]
[ROW][C]14[/C][C]0.722633[/C][C]7.9161[/C][C]0[/C][/ROW]
[ROW][C]15[/C][C]0.696375[/C][C]7.6284[/C][C]0[/C][/ROW]
[ROW][C]16[/C][C]0.669557[/C][C]7.3346[/C][C]0[/C][/ROW]
[ROW][C]17[/C][C]0.640498[/C][C]7.0163[/C][C]0[/C][/ROW]
[ROW][C]18[/C][C]0.610272[/C][C]6.6852[/C][C]0[/C][/ROW]
[ROW][C]19[/C][C]0.584335[/C][C]6.4011[/C][C]0[/C][/ROW]
[ROW][C]20[/C][C]0.560482[/C][C]6.1398[/C][C]0[/C][/ROW]
[ROW][C]21[/C][C]0.534344[/C][C]5.8534[/C][C]0[/C][/ROW]
[ROW][C]22[/C][C]0.510141[/C][C]5.5883[/C][C]0[/C][/ROW]
[ROW][C]23[/C][C]0.48887[/C][C]5.3553[/C][C]0[/C][/ROW]
[ROW][C]24[/C][C]0.462515[/C][C]5.0666[/C][C]1e-06[/C][/ROW]
[ROW][C]25[/C][C]0.429531[/C][C]4.7053[/C][C]3e-06[/C][/ROW]
[ROW][C]26[/C][C]0.397722[/C][C]4.3568[/C][C]1.4e-05[/C][/ROW]
[ROW][C]27[/C][C]0.369062[/C][C]4.0429[/C][C]4.7e-05[/C][/ROW]
[ROW][C]28[/C][C]0.33965[/C][C]3.7207[/C][C]0.000152[/C][/ROW]
[ROW][C]29[/C][C]0.307994[/C][C]3.3739[/C][C]0.000499[/C][/ROW]
[ROW][C]30[/C][C]0.274761[/C][C]3.0099[/C][C]0.001593[/C][/ROW]
[ROW][C]31[/C][C]0.245796[/C][C]2.6926[/C][C]0.004052[/C][/ROW]
[ROW][C]32[/C][C]0.218906[/C][C]2.398[/C][C]0.009013[/C][/ROW]
[ROW][C]33[/C][C]0.191997[/C][C]2.1032[/C][C]0.018767[/C][/ROW]
[ROW][C]34[/C][C]0.166349[/C][C]1.8223[/C][C]0.035453[/C][/ROW]
[ROW][C]35[/C][C]0.144368[/C][C]1.5815[/C][C]0.058202[/C][/ROW]
[ROW][C]36[/C][C]0.120544[/C][C]1.3205[/C][C]0.094591[/C][/ROW]
[ROW][C]37[/C][C]0.091944[/C][C]1.0072[/C][C]0.157933[/C][/ROW]
[ROW][C]38[/C][C]0.063912[/C][C]0.7001[/C][C]0.242602[/C][/ROW]
[ROW][C]39[/C][C]0.038911[/C][C]0.4262[/C][C]0.335345[/C][/ROW]
[ROW][C]40[/C][C]0.013206[/C][C]0.1447[/C][C]0.442609[/C][/ROW]
[ROW][C]41[/C][C]-0.015332[/C][C]-0.168[/C][C]0.433449[/C][/ROW]
[ROW][C]42[/C][C]-0.045933[/C][C]-0.5032[/C][C]0.307883[/C][/ROW]
[ROW][C]43[/C][C]-0.070215[/C][C]-0.7692[/C][C]0.221652[/C][/ROW]
[ROW][C]44[/C][C]-0.092142[/C][C]-1.0094[/C][C]0.157416[/C][/ROW]
[ROW][C]45[/C][C]-0.114845[/C][C]-1.2581[/C][C]0.105405[/C][/ROW]
[ROW][C]46[/C][C]-0.13595[/C][C]-1.4893[/C][C]0.069522[/C][/ROW]
[ROW][C]47[/C][C]-0.153201[/C][C]-1.6782[/C][C]0.047952[/C][/ROW]
[ROW][C]48[/C][C]-0.170518[/C][C]-1.8679[/C][C]0.032105[/C][/ROW]
[/TABLE]
Source: https://freestatistics.org/blog/index.php?pk=168979&T=1

Globally Unique Identifier (entire table): ba.freestatistics.org/blog/index.php?pk=168979&T=1

As an alternative you can also use a QR Code:  

The GUIDs for individual cells are displayed in the table below:

Autocorrelation Function
Time lag kACF(k)T-STATP-value
10.97755810.70860
20.95635810.47640
30.93892710.28540
40.92222110.10240
50.9022389.88350
60.8817279.65880
70.8647379.47270
80.8496549.30750
90.8317559.11140
100.816118.940
110.8018248.78350
120.7823828.57060
130.7524118.24230
140.7226337.91610
150.6963757.62840
160.6695577.33460
170.6404987.01630
180.6102726.68520
190.5843356.40110
200.5604826.13980
210.5343445.85340
220.5101415.58830
230.488875.35530
240.4625155.06661e-06
250.4295314.70533e-06
260.3977224.35681.4e-05
270.3690624.04294.7e-05
280.339653.72070.000152
290.3079943.37390.000499
300.2747613.00990.001593
310.2457962.69260.004052
320.2189062.3980.009013
330.1919972.10320.018767
340.1663491.82230.035453
350.1443681.58150.058202
360.1205441.32050.094591
370.0919441.00720.157933
380.0639120.70010.242602
390.0389110.42620.335345
400.0132060.14470.442609
41-0.015332-0.1680.433449
42-0.045933-0.50320.307883
43-0.070215-0.76920.221652
44-0.092142-1.00940.157416
45-0.114845-1.25810.105405
46-0.13595-1.48930.069522
47-0.153201-1.67820.047952
48-0.170518-1.86790.032105


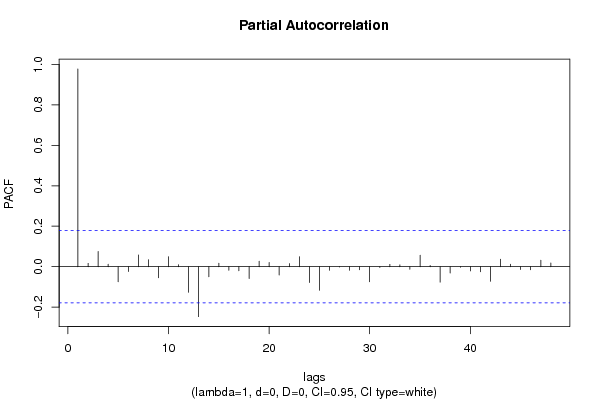
Partial Autocorrelation Function
Time lag kPACF(k)T-STATP-value
10.97755810.70860
20.0166080.18190.427971
30.0748910.82040.206809
40.0121530.13310.447155
5-0.074819-0.81960.207034
6-0.023484-0.25730.398711
70.0575910.63090.26466
80.0342920.37570.353919
9-0.054429-0.59620.276069
100.0494130.54130.294653
110.0094130.10310.45902
12-0.126671-1.38760.083914
13-0.246909-2.70480.003915
14-0.050057-0.54830.292237
150.0167570.18360.427332
16-0.017791-0.19490.422903
17-0.020284-0.22220.412268
18-0.058036-0.63580.263073
190.0267680.29320.384928
200.020560.22520.411096
21-0.040995-0.44910.327094
220.0153920.16860.433192
230.048920.53590.296511
24-0.078695-0.86210.195186
25-0.116542-1.27660.102096
26-0.017672-0.19360.423412
27-0.001877-0.02060.491814
28-0.018066-0.19790.421726
29-0.015041-0.16480.434703
30-0.074652-0.81780.207554
31-0.004404-0.04820.4808
320.0117280.12850.448996
330.009090.09960.460423
34-0.013202-0.14460.442626
350.0569930.62430.266798
360.0062810.06880.47263
37-0.076397-0.83690.202159
38-0.03091-0.33860.36775
39-0.002783-0.03050.487867
40-0.020687-0.22660.410553
41-0.024737-0.2710.393438
42-0.071764-0.78610.216669
430.0366270.40120.344482
440.0119970.13140.447831
45-0.014117-0.15460.438683
46-0.014998-0.16430.434889
470.0320070.35060.363246
480.0186140.20390.419385

\begin{tabular}{lllllllll}
\hline
Partial Autocorrelation Function \tabularnewline
Time lag k & PACF(k) & T-STAT & P-value \tabularnewline
1 & 0.977558 & 10.7086 & 0 \tabularnewline
2 & 0.016608 & 0.1819 & 0.427971 \tabularnewline
3 & 0.074891 & 0.8204 & 0.206809 \tabularnewline
4 & 0.012153 & 0.1331 & 0.447155 \tabularnewline
5 & -0.074819 & -0.8196 & 0.207034 \tabularnewline
6 & -0.023484 & -0.2573 & 0.398711 \tabularnewline
7 & 0.057591 & 0.6309 & 0.26466 \tabularnewline
8 & 0.034292 & 0.3757 & 0.353919 \tabularnewline
9 & -0.054429 & -0.5962 & 0.276069 \tabularnewline
10 & 0.049413 & 0.5413 & 0.294653 \tabularnewline
11 & 0.009413 & 0.1031 & 0.45902 \tabularnewline
12 & -0.126671 & -1.3876 & 0.083914 \tabularnewline
13 & -0.246909 & -2.7048 & 0.003915 \tabularnewline
14 & -0.050057 & -0.5483 & 0.292237 \tabularnewline
15 & 0.016757 & 0.1836 & 0.427332 \tabularnewline
16 & -0.017791 & -0.1949 & 0.422903 \tabularnewline
17 & -0.020284 & -0.2222 & 0.412268 \tabularnewline
18 & -0.058036 & -0.6358 & 0.263073 \tabularnewline
19 & 0.026768 & 0.2932 & 0.384928 \tabularnewline
20 & 0.02056 & 0.2252 & 0.411096 \tabularnewline
21 & -0.040995 & -0.4491 & 0.327094 \tabularnewline
22 & 0.015392 & 0.1686 & 0.433192 \tabularnewline
23 & 0.04892 & 0.5359 & 0.296511 \tabularnewline
24 & -0.078695 & -0.8621 & 0.195186 \tabularnewline
25 & -0.116542 & -1.2766 & 0.102096 \tabularnewline
26 & -0.017672 & -0.1936 & 0.423412 \tabularnewline
27 & -0.001877 & -0.0206 & 0.491814 \tabularnewline
28 & -0.018066 & -0.1979 & 0.421726 \tabularnewline
29 & -0.015041 & -0.1648 & 0.434703 \tabularnewline
30 & -0.074652 & -0.8178 & 0.207554 \tabularnewline
31 & -0.004404 & -0.0482 & 0.4808 \tabularnewline
32 & 0.011728 & 0.1285 & 0.448996 \tabularnewline
33 & 0.00909 & 0.0996 & 0.460423 \tabularnewline
34 & -0.013202 & -0.1446 & 0.442626 \tabularnewline
35 & 0.056993 & 0.6243 & 0.266798 \tabularnewline
36 & 0.006281 & 0.0688 & 0.47263 \tabularnewline
37 & -0.076397 & -0.8369 & 0.202159 \tabularnewline
38 & -0.03091 & -0.3386 & 0.36775 \tabularnewline
39 & -0.002783 & -0.0305 & 0.487867 \tabularnewline
40 & -0.020687 & -0.2266 & 0.410553 \tabularnewline
41 & -0.024737 & -0.271 & 0.393438 \tabularnewline
42 & -0.071764 & -0.7861 & 0.216669 \tabularnewline
43 & 0.036627 & 0.4012 & 0.344482 \tabularnewline
44 & 0.011997 & 0.1314 & 0.447831 \tabularnewline
45 & -0.014117 & -0.1546 & 0.438683 \tabularnewline
46 & -0.014998 & -0.1643 & 0.434889 \tabularnewline
47 & 0.032007 & 0.3506 & 0.363246 \tabularnewline
48 & 0.018614 & 0.2039 & 0.419385 \tabularnewline
\hline
\end{tabular}
%Source: https://freestatistics.org/blog/index.php?pk=168979&T=2

[TABLE]
[ROW][C]Partial Autocorrelation Function[/C][/ROW]
[ROW][C]Time lag k[/C][C]PACF(k)[/C][C]T-STAT[/C][C]P-value[/C][/ROW]
[ROW][C]1[/C][C]0.977558[/C][C]10.7086[/C][C]0[/C][/ROW]
[ROW][C]2[/C][C]0.016608[/C][C]0.1819[/C][C]0.427971[/C][/ROW]
[ROW][C]3[/C][C]0.074891[/C][C]0.8204[/C][C]0.206809[/C][/ROW]
[ROW][C]4[/C][C]0.012153[/C][C]0.1331[/C][C]0.447155[/C][/ROW]
[ROW][C]5[/C][C]-0.074819[/C][C]-0.8196[/C][C]0.207034[/C][/ROW]
[ROW][C]6[/C][C]-0.023484[/C][C]-0.2573[/C][C]0.398711[/C][/ROW]
[ROW][C]7[/C][C]0.057591[/C][C]0.6309[/C][C]0.26466[/C][/ROW]
[ROW][C]8[/C][C]0.034292[/C][C]0.3757[/C][C]0.353919[/C][/ROW]
[ROW][C]9[/C][C]-0.054429[/C][C]-0.5962[/C][C]0.276069[/C][/ROW]
[ROW][C]10[/C][C]0.049413[/C][C]0.5413[/C][C]0.294653[/C][/ROW]
[ROW][C]11[/C][C]0.009413[/C][C]0.1031[/C][C]0.45902[/C][/ROW]
[ROW][C]12[/C][C]-0.126671[/C][C]-1.3876[/C][C]0.083914[/C][/ROW]
[ROW][C]13[/C][C]-0.246909[/C][C]-2.7048[/C][C]0.003915[/C][/ROW]
[ROW][C]14[/C][C]-0.050057[/C][C]-0.5483[/C][C]0.292237[/C][/ROW]
[ROW][C]15[/C][C]0.016757[/C][C]0.1836[/C][C]0.427332[/C][/ROW]
[ROW][C]16[/C][C]-0.017791[/C][C]-0.1949[/C][C]0.422903[/C][/ROW]
[ROW][C]17[/C][C]-0.020284[/C][C]-0.2222[/C][C]0.412268[/C][/ROW]
[ROW][C]18[/C][C]-0.058036[/C][C]-0.6358[/C][C]0.263073[/C][/ROW]
[ROW][C]19[/C][C]0.026768[/C][C]0.2932[/C][C]0.384928[/C][/ROW]
[ROW][C]20[/C][C]0.02056[/C][C]0.2252[/C][C]0.411096[/C][/ROW]
[ROW][C]21[/C][C]-0.040995[/C][C]-0.4491[/C][C]0.327094[/C][/ROW]
[ROW][C]22[/C][C]0.015392[/C][C]0.1686[/C][C]0.433192[/C][/ROW]
[ROW][C]23[/C][C]0.04892[/C][C]0.5359[/C][C]0.296511[/C][/ROW]
[ROW][C]24[/C][C]-0.078695[/C][C]-0.8621[/C][C]0.195186[/C][/ROW]
[ROW][C]25[/C][C]-0.116542[/C][C]-1.2766[/C][C]0.102096[/C][/ROW]
[ROW][C]26[/C][C]-0.017672[/C][C]-0.1936[/C][C]0.423412[/C][/ROW]
[ROW][C]27[/C][C]-0.001877[/C][C]-0.0206[/C][C]0.491814[/C][/ROW]
[ROW][C]28[/C][C]-0.018066[/C][C]-0.1979[/C][C]0.421726[/C][/ROW]
[ROW][C]29[/C][C]-0.015041[/C][C]-0.1648[/C][C]0.434703[/C][/ROW]
[ROW][C]30[/C][C]-0.074652[/C][C]-0.8178[/C][C]0.207554[/C][/ROW]
[ROW][C]31[/C][C]-0.004404[/C][C]-0.0482[/C][C]0.4808[/C][/ROW]
[ROW][C]32[/C][C]0.011728[/C][C]0.1285[/C][C]0.448996[/C][/ROW]
[ROW][C]33[/C][C]0.00909[/C][C]0.0996[/C][C]0.460423[/C][/ROW]
[ROW][C]34[/C][C]-0.013202[/C][C]-0.1446[/C][C]0.442626[/C][/ROW]
[ROW][C]35[/C][C]0.056993[/C][C]0.6243[/C][C]0.266798[/C][/ROW]
[ROW][C]36[/C][C]0.006281[/C][C]0.0688[/C][C]0.47263[/C][/ROW]
[ROW][C]37[/C][C]-0.076397[/C][C]-0.8369[/C][C]0.202159[/C][/ROW]
[ROW][C]38[/C][C]-0.03091[/C][C]-0.3386[/C][C]0.36775[/C][/ROW]
[ROW][C]39[/C][C]-0.002783[/C][C]-0.0305[/C][C]0.487867[/C][/ROW]
[ROW][C]40[/C][C]-0.020687[/C][C]-0.2266[/C][C]0.410553[/C][/ROW]
[ROW][C]41[/C][C]-0.024737[/C][C]-0.271[/C][C]0.393438[/C][/ROW]
[ROW][C]42[/C][C]-0.071764[/C][C]-0.7861[/C][C]0.216669[/C][/ROW]
[ROW][C]43[/C][C]0.036627[/C][C]0.4012[/C][C]0.344482[/C][/ROW]
[ROW][C]44[/C][C]0.011997[/C][C]0.1314[/C][C]0.447831[/C][/ROW]
[ROW][C]45[/C][C]-0.014117[/C][C]-0.1546[/C][C]0.438683[/C][/ROW]
[ROW][C]46[/C][C]-0.014998[/C][C]-0.1643[/C][C]0.434889[/C][/ROW]
[ROW][C]47[/C][C]0.032007[/C][C]0.3506[/C][C]0.363246[/C][/ROW]
[ROW][C]48[/C][C]0.018614[/C][C]0.2039[/C][C]0.419385[/C][/ROW]
[/TABLE]
Source: https://freestatistics.org/blog/index.php?pk=168979&T=2

Globally Unique Identifier (entire table): ba.freestatistics.org/blog/index.php?pk=168979&T=2

As an alternative you can also use a QR Code:  

The GUIDs for individual cells are displayed in the table below:

Partial Autocorrelation Function
Time lag kPACF(k)T-STATP-value
10.97755810.70860
20.0166080.18190.427971
30.0748910.82040.206809
40.0121530.13310.447155
5-0.074819-0.81960.207034
6-0.023484-0.25730.398711
70.0575910.63090.26466
80.0342920.37570.353919
9-0.054429-0.59620.276069
100.0494130.54130.294653
110.0094130.10310.45902
12-0.126671-1.38760.083914
13-0.246909-2.70480.003915
14-0.050057-0.54830.292237
150.0167570.18360.427332
16-0.017791-0.19490.422903
17-0.020284-0.22220.412268
18-0.058036-0.63580.263073
190.0267680.29320.384928
200.020560.22520.411096
21-0.040995-0.44910.327094
220.0153920.16860.433192
230.048920.53590.296511
24-0.078695-0.86210.195186
25-0.116542-1.27660.102096
26-0.017672-0.19360.423412
27-0.001877-0.02060.491814
28-0.018066-0.19790.421726
29-0.015041-0.16480.434703
30-0.074652-0.81780.207554
31-0.004404-0.04820.4808
320.0117280.12850.448996
330.009090.09960.460423
34-0.013202-0.14460.442626
350.0569930.62430.266798
360.0062810.06880.47263
37-0.076397-0.83690.202159
38-0.03091-0.33860.36775
39-0.002783-0.03050.487867
40-0.020687-0.22660.410553
41-0.024737-0.2710.393438
42-0.071764-0.78610.216669
430.0366270.40120.344482
440.0119970.13140.447831
45-0.014117-0.15460.438683
46-0.014998-0.16430.434889
470.0320070.35060.363246
480.0186140.20390.419385


Parameters (Session):
par1 = 48 ; par2 = 1 ; par3 = 0 ; par4 = 0 ; par5 = 12 ; par6 = White Noise ; par7 = 0.95 ;
Parameters (R input):
par1 = 48 ; par2 = 1 ; par3 = 0 ; par4 = 0 ; par5 = 12 ; par6 = White Noise ; par7 = 0.95 ; par8 = ;
R code (references can be found in the software module):
if (par1 == 'Default') {
par1 = 10*log10(length(x))
} else {
par1 <- as.numeric(par1)
}
par2 <- as.numeric(par2)
par3 <- as.numeric(par3)
par4 <- as.numeric(par4)
par5 <- as.numeric(par5)
if (par6 == 'White Noise') par6 <- 'white' else par6 <- 'ma'
par7 <- as.numeric(par7)
if (par8 != '') par8 <- as.numeric(par8)
ox <- x
if (par8 == '') {
if (par2 == 0) {
x <- log(x)
} else {
x <- (x ^ par2 - 1) / par2
}
} else {
x <- log(x,base=par8)
}
if (par3 > 0) x <- diff(x,lag=1,difference=par3)
if (par4 > 0) x <- diff(x,lag=par5,difference=par4)
bitmap(file='picts.png')
op <- par(mfrow=c(2,1))
plot(ox,type='l',main='Original Time Series',xlab='time',ylab='value')
if (par8=='') {
mytitle <- paste('Working Time Series (lambda=',par2,', d=',par3,', D=',par4,')',sep='')
mysub <- paste('(lambda=',par2,', d=',par3,', D=',par4,', CI=', par7, ', CI type=',par6,')',sep='')
} else {
mytitle <- paste('Working Time Series (base=',par8,', d=',par3,', D=',par4,')',sep='')
mysub <- paste('(base=',par8,', d=',par3,', D=',par4,', CI=', par7, ', CI type=',par6,')',sep='')
}
plot(x,type='l', main=mytitle,xlab='time',ylab='value')
par(op)
dev.off()
bitmap(file='pic1.png')
racf <- acf(x, par1, main='Autocorrelation', xlab='time lag', ylab='ACF', ci.type=par6, ci=par7, sub=mysub)
dev.off()
bitmap(file='pic2.png')
rpacf <- pacf(x,par1,main='Partial Autocorrelation',xlab='lags',ylab='PACF',sub=mysub)
dev.off()
(myacf <- c(racf$acf))
(mypacf <- c(rpacf$acf))
lengthx <- length(x)
sqrtn <- sqrt(lengthx)
load(file='createtable')
a<-table.start()
a<-table.row.start(a)
a<-table.element(a,'Autocorrelation Function',4,TRUE)
a<-table.row.end(a)
a<-table.row.start(a)
a<-table.element(a,'Time lag k',header=TRUE)
a<-table.element(a,hyperlink('basics.htm','ACF(k)','click here for more information about the Autocorrelation Function'),header=TRUE)
a<-table.element(a,'T-STAT',header=TRUE)
a<-table.element(a,'P-value',header=TRUE)
a<-table.row.end(a)
for (i in 2:(par1+1)) {
a<-table.row.start(a)
a<-table.element(a,i-1,header=TRUE)
a<-table.element(a,round(myacf[i],6))
mytstat <- myacf[i]*sqrtn
a<-table.element(a,round(mytstat,4))
a<-table.element(a,round(1-pt(abs(mytstat),lengthx),6))
a<-table.row.end(a)
}
a<-table.end(a)
table.save(a,file='mytable.tab')
a<-table.start()
a<-table.row.start(a)
a<-table.element(a,'Partial Autocorrelation Function',4,TRUE)
a<-table.row.end(a)
a<-table.row.start(a)
a<-table.element(a,'Time lag k',header=TRUE)
a<-table.element(a,hyperlink('basics.htm','PACF(k)','click here for more information about the Partial Autocorrelation Function'),header=TRUE)
a<-table.element(a,'T-STAT',header=TRUE)
a<-table.element(a,'P-value',header=TRUE)
a<-table.row.end(a)
for (i in 1:par1) {
a<-table.row.start(a)
a<-table.element(a,i,header=TRUE)
a<-table.element(a,round(mypacf[i],6))
mytstat <- mypacf[i]*sqrtn
a<-table.element(a,round(mytstat,4))
a<-table.element(a,round(1-pt(abs(mytstat),lengthx),6))
a<-table.row.end(a)
}
a<-table.end(a)
table.save(a,file='mytable1.tab')