Free Statistics

of Irreproducible Research!

Author's title

Author*The author of this computation has been verified*
R Software Modulerwasp_hierarchicalclusteringdm.wasp
Title produced by softwareHierarchical Clustering
Date of computationMon, 30 Apr 2012 07:53:57 -0400
Cite this page as followsStatistical Computations at FreeStatistics.org, Office for Research Development and Education, URL https://freestatistics.org/blog/index.php?v=date/2012/Apr/30/t1335786854xazkr3awywwax5l.htm/, Retrieved Sun, 28 Apr 2024 22:24:25 +0000
Statistical Computations at FreeStatistics.org, Office for Research Development and Education, URL https://freestatistics.org/blog/index.php?pk=165223, Retrieved Sun, 28 Apr 2024 22:24:25 +0000
QR Codes:

Original text written by user:
IsPrivate?No (this computation is public)
User-defined keywords
Estimated Impact146
Family? (F = Feedback message, R = changed R code, M = changed R Module, P = changed Parameters, D = changed Data)
-     [Hierarchical Clustering] [Hierarchical Clus...] [2012-04-23 19:51:00] [489eb911c8db04aca1fc54d886fc3144]
-   P   [Hierarchical Clustering] [Hierarchical Clus...] [2012-04-23 19:52:52] [489eb911c8db04aca1fc54d886fc3144]
-   P       [Hierarchical Clustering] [Hierarchical Clus...] [2012-04-30 11:53:57] [d160b678fd2d7bb562db2147d7efddc2] [Current]
Feedback Forum

Post a new message


Summary of computational transaction
Raw Inputview raw input (R code)
Raw Outputview raw output of R engine
Computing time1 seconds
R Server'Gwilym Jenkins' @ jenkins.wessa.net

\begin{tabular}{lllllllll}
\hline
Summary of computational transaction \tabularnewline
Raw Input & view raw input (R code)  \tabularnewline
Raw Output & view raw output of R engine  \tabularnewline
Computing time & 1 seconds \tabularnewline
R Server & 'Gwilym Jenkins' @ jenkins.wessa.net \tabularnewline
\hline
\end{tabular}
%Source: https://freestatistics.org/blog/index.php?pk=165223&T=0

[TABLE]
[ROW][C]Summary of computational transaction[/C][/ROW]
[ROW][C]Raw Input[/C][C]view raw input (R code) [/C][/ROW]
[ROW][C]Raw Output[/C][C]view raw output of R engine [/C][/ROW]
[ROW][C]Computing time[/C][C]1 seconds[/C][/ROW]
[ROW][C]R Server[/C][C]'Gwilym Jenkins' @ jenkins.wessa.net[/C][/ROW]
[/TABLE]
Source: https://freestatistics.org/blog/index.php?pk=165223&T=0

Globally Unique Identifier (entire table): ba.freestatistics.org/blog/index.php?pk=165223&T=0

As an alternative you can also use a QR Code:  

The GUIDs for individual cells are displayed in the table below:

Summary of computational transaction
Raw Inputview raw input (R code)
Raw Outputview raw output of R engine
Computing time1 seconds
R Server'Gwilym Jenkins' @ jenkins.wessa.net


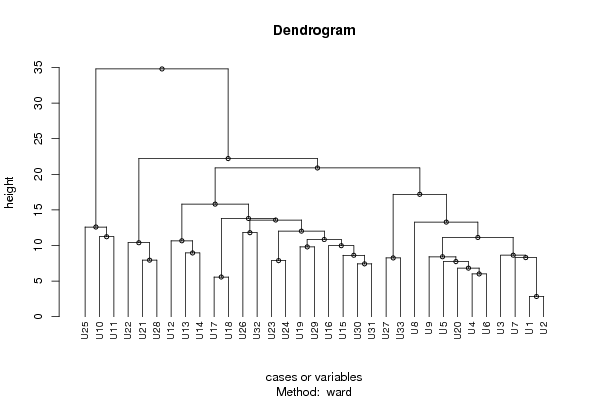
Summary of Dendrogram
LabelHeight
U12.82842712474619
U25.56776436283002
U36
U46.81612730589405
U57.41619848709566
U67.73475935322371
U77.87400787401181
U87.93725393319377
U98.24621125123532
U108.29429402535197
U118.41047079084484
U128.62260753245778
U138.63240676653095
U148.94427190999916
U159.79795897113271
U169.96773853248618
U1710.380510031715
U1810.654871721884
U1910.8311732166014
U2011.1213239179003
U2111.2249721603218
U2211.7898261225516
U2312.011091682361
U2412.5881835086782
U2513.2811580560675
U2613.57110807075
U2713.786820156651
U2815.8042875478907
U2917.1827128706529
U3020.8808332706328
U3122.2048805495323
U3234.7884295434027

\begin{tabular}{lllllllll}
\hline
Summary of Dendrogram \tabularnewline
Label & Height \tabularnewline
U1 & 2.82842712474619 \tabularnewline
U2 & 5.56776436283002 \tabularnewline
U3 & 6 \tabularnewline
U4 & 6.81612730589405 \tabularnewline
U5 & 7.41619848709566 \tabularnewline
U6 & 7.73475935322371 \tabularnewline
U7 & 7.87400787401181 \tabularnewline
U8 & 7.93725393319377 \tabularnewline
U9 & 8.24621125123532 \tabularnewline
U10 & 8.29429402535197 \tabularnewline
U11 & 8.41047079084484 \tabularnewline
U12 & 8.62260753245778 \tabularnewline
U13 & 8.63240676653095 \tabularnewline
U14 & 8.94427190999916 \tabularnewline
U15 & 9.79795897113271 \tabularnewline
U16 & 9.96773853248618 \tabularnewline
U17 & 10.380510031715 \tabularnewline
U18 & 10.654871721884 \tabularnewline
U19 & 10.8311732166014 \tabularnewline
U20 & 11.1213239179003 \tabularnewline
U21 & 11.2249721603218 \tabularnewline
U22 & 11.7898261225516 \tabularnewline
U23 & 12.011091682361 \tabularnewline
U24 & 12.5881835086782 \tabularnewline
U25 & 13.2811580560675 \tabularnewline
U26 & 13.57110807075 \tabularnewline
U27 & 13.786820156651 \tabularnewline
U28 & 15.8042875478907 \tabularnewline
U29 & 17.1827128706529 \tabularnewline
U30 & 20.8808332706328 \tabularnewline
U31 & 22.2048805495323 \tabularnewline
U32 & 34.7884295434027 \tabularnewline
\hline
\end{tabular}
%Source: https://freestatistics.org/blog/index.php?pk=165223&T=1

[TABLE]
[ROW][C]Summary of Dendrogram[/C][/ROW]
[ROW][C]Label[/C][C]Height[/C][/ROW]
[ROW][C]U1[/C][C]2.82842712474619[/C][/ROW]
[ROW][C]U2[/C][C]5.56776436283002[/C][/ROW]
[ROW][C]U3[/C][C]6[/C][/ROW]
[ROW][C]U4[/C][C]6.81612730589405[/C][/ROW]
[ROW][C]U5[/C][C]7.41619848709566[/C][/ROW]
[ROW][C]U6[/C][C]7.73475935322371[/C][/ROW]
[ROW][C]U7[/C][C]7.87400787401181[/C][/ROW]
[ROW][C]U8[/C][C]7.93725393319377[/C][/ROW]
[ROW][C]U9[/C][C]8.24621125123532[/C][/ROW]
[ROW][C]U10[/C][C]8.29429402535197[/C][/ROW]
[ROW][C]U11[/C][C]8.41047079084484[/C][/ROW]
[ROW][C]U12[/C][C]8.62260753245778[/C][/ROW]
[ROW][C]U13[/C][C]8.63240676653095[/C][/ROW]
[ROW][C]U14[/C][C]8.94427190999916[/C][/ROW]
[ROW][C]U15[/C][C]9.79795897113271[/C][/ROW]
[ROW][C]U16[/C][C]9.96773853248618[/C][/ROW]
[ROW][C]U17[/C][C]10.380510031715[/C][/ROW]
[ROW][C]U18[/C][C]10.654871721884[/C][/ROW]
[ROW][C]U19[/C][C]10.8311732166014[/C][/ROW]
[ROW][C]U20[/C][C]11.1213239179003[/C][/ROW]
[ROW][C]U21[/C][C]11.2249721603218[/C][/ROW]
[ROW][C]U22[/C][C]11.7898261225516[/C][/ROW]
[ROW][C]U23[/C][C]12.011091682361[/C][/ROW]
[ROW][C]U24[/C][C]12.5881835086782[/C][/ROW]
[ROW][C]U25[/C][C]13.2811580560675[/C][/ROW]
[ROW][C]U26[/C][C]13.57110807075[/C][/ROW]
[ROW][C]U27[/C][C]13.786820156651[/C][/ROW]
[ROW][C]U28[/C][C]15.8042875478907[/C][/ROW]
[ROW][C]U29[/C][C]17.1827128706529[/C][/ROW]
[ROW][C]U30[/C][C]20.8808332706328[/C][/ROW]
[ROW][C]U31[/C][C]22.2048805495323[/C][/ROW]
[ROW][C]U32[/C][C]34.7884295434027[/C][/ROW]
[/TABLE]
Source: https://freestatistics.org/blog/index.php?pk=165223&T=1

Globally Unique Identifier (entire table): ba.freestatistics.org/blog/index.php?pk=165223&T=1

As an alternative you can also use a QR Code:  

The GUIDs for individual cells are displayed in the table below:

Summary of Dendrogram
LabelHeight
U12.82842712474619
U25.56776436283002
U36
U46.81612730589405
U57.41619848709566
U67.73475935322371
U77.87400787401181
U87.93725393319377
U98.24621125123532
U108.29429402535197
U118.41047079084484
U128.62260753245778
U138.63240676653095
U148.94427190999916
U159.79795897113271
U169.96773853248618
U1710.380510031715
U1810.654871721884
U1910.8311732166014
U2011.1213239179003
U2111.2249721603218
U2211.7898261225516
U2312.011091682361
U2412.5881835086782
U2513.2811580560675
U2613.57110807075
U2713.786820156651
U2815.8042875478907
U2917.1827128706529
U3020.8808332706328
U3122.2048805495323
U3234.7884295434027


Parameters (Session):
par1 = ward ; par2 = ALL ; par3 = FALSE ; par4 = FALSE ; par5 = female ; par6 = bachelor ; par7 = all ; par8 = CSUQ ; par9 = variables ;
Parameters (R input):
par1 = ward ; par2 = ALL ; par3 = FALSE ; par4 = FALSE ; par5 = female ; par6 = bachelor ; par7 = all ; par8 = CSUQ ; par9 = variables ;
R code (references can be found in the software module):
x <- as.data.frame(read.table(file='https://automated.biganalytics.eu/download/utaut.csv',sep=',',header=T))
x$U25 <- 6-x$U25
if(par5 == 'female') x <- x[x$Gender==0,]
if(par5 == 'male') x <- x[x$Gender==1,]
if(par6 == 'prep') x <- x[x$Pop==1,]
if(par6 == 'bachelor') x <- x[x$Pop==0,]
if(par7 != 'all') {
x <- x[x$Year==as.numeric(par7),]
}
cAc <- with(x,cbind( A1, A2, A3, A4, A5, A6, A7, A8, A9,A10))
cAs <- with(x,cbind(A11,A12,A13,A14,A15,A16,A17,A18,A19,A20))
cA <- cbind(cAc,cAs)
cCa <- with(x,cbind(C1,C3,C5,C7, C9,C11,C13,C15,C17,C19,C21,C23,C25,C27,C29,C31,C33,C35,C37,C39,C41,C43,C45,C47))
cCp <- with(x,cbind(C2,C4,C6,C8,C10,C12,C14,C16,C18,C20,C22,C24,C26,C28,C30,C32,C34,C36,C38,C40,C42,C44,C46,C48))
cC <- cbind(cCa,cCp)
cU <- with(x,cbind(U1,U2,U3,U4,U5,U6,U7,U8,U9,U10,U11,U12,U13,U14,U15,U16,U17,U18,U19,U20,U21,U22,U23,U24,U25,U26,U27,U28,U29,U30,U31,U32,U33))
cE <- with(x,cbind(BC,NNZFG,MRT,AFL,LPM,LPC,W,WPA))
cX <- with(x,cbind(X1,X2,X3,X4,X5,X6,X7,X8,X9,X10,X11,X12,X13,X14,X15,X16,X17,X18))
if (par8=='ATTLES connected') x <- cAc
if (par8=='ATTLES separate') x <- cAs
if (par8=='ATTLES all') x <- cA
if (par8=='COLLES actuals') x <- cCa
if (par8=='COLLES preferred') x <- cCp
if (par8=='COLLES all') x <- cC
if (par8=='CSUQ') x <- cU
if (par8=='Learning Activities') x <- cE
if (par8=='Exam Items') x <- cX
ncol <- length(x[1,])
for (jjj in 1:ncol) {
x <- x[!is.na(x[,jjj]),]
}
par3 <- as.logical(par3)
par4 <- as.logical(par4)
if (par3 == TRUE){
dum = xlab
xlab = ylab
ylab = dum
}
if (par9=='variables') {
x <- t(x)
} else {
ncol <- length(x[1,])
colnames(x) <- 1:ncol
}
hc <- hclust(dist(x),method=par1)
d <- as.dendrogram(hc)
str(d)
mysub <- paste('Method: ',par1)
bitmap(file='test1.png')
if (par4 == TRUE){
plot(d,main=main,ylab=ylab,xlab=xlab,horiz=par3, nodePar=list(pch = c(1,NA), cex=0.8, lab.cex = 0.8),type='t',center=T, sub=mysub)
} else {
plot(d,main=main,ylab=ylab,xlab=xlab,horiz=par3, nodePar=list(pch = c(1,NA), cex=0.8, lab.cex = 0.8), sub=mysub)
}
dev.off()
if (par2 != 'ALL'){
if (par3 == TRUE){
ylab = 'cluster'
} else {
xlab = 'cluster'
}
par2 <- as.numeric(par2)
memb <- cutree(hc, k = par2)
cent <- NULL
for(k in 1:par2){
cent <- rbind(cent, colMeans(x[memb == k, , drop = FALSE]))
}
hc1 <- hclust(dist(cent),method=par1, members = table(memb))
de <- as.dendrogram(hc1)
bitmap(file='test2.png')
if (par4 == TRUE){
plot(de,main=main,ylab=ylab,xlab=xlab,horiz=par3, nodePar=list(pch = c(1,NA), cex=0.8, lab.cex = 0.8),type='t',center=T, sub=mysub)
} else {
plot(de,main=main,ylab=ylab,xlab=xlab,horiz=par3, nodePar=list(pch = c(1,NA), cex=0.8, lab.cex = 0.8), sub=mysub)
}
dev.off()
str(de)
}
load(file='createtable')
a<-table.start()
a<-table.row.start(a)
a<-table.element(a,'Summary of Dendrogram',2,TRUE)
a<-table.row.end(a)
a<-table.row.start(a)
a<-table.element(a,'Label',header=TRUE)
a<-table.element(a,'Height',header=TRUE)
a<-table.row.end(a)
num <- length(x[,1])-1
for (i in 1:num)
{
a<-table.row.start(a)
a<-table.element(a,hc$labels[i])
a<-table.element(a,hc$height[i])
a<-table.row.end(a)
}
a<-table.end(a)
table.save(a,file='mytable1.tab')
if (par2 != 'ALL'){
a<-table.start()
a<-table.row.start(a)
a<-table.element(a,'Summary of Cut Dendrogram',2,TRUE)
a<-table.row.end(a)
a<-table.row.start(a)
a<-table.element(a,'Label',header=TRUE)
a<-table.element(a,'Height',header=TRUE)
a<-table.row.end(a)
num <- par2-1
for (i in 1:num)
{
a<-table.row.start(a)
a<-table.element(a,i)
a<-table.element(a,hc1$height[i])
a<-table.row.end(a)
}
a<-table.end(a)
table.save(a,file='mytable2.tab')
}