Free Statistics

of Irreproducible Research!

Author's title

Author*The author of this computation has been verified*
R Software Modulerwasp_hierarchicalclusteringdm.wasp
Title produced by softwareHierarchical Clustering
Date of computationSun, 29 Apr 2012 07:44:30 -0400
Cite this page as followsStatistical Computations at FreeStatistics.org, Office for Research Development and Education, URL https://freestatistics.org/blog/index.php?v=date/2012/Apr/29/t1335699891kpip9s06yci73sc.htm/, Retrieved Sat, 04 May 2024 18:39:07 +0000
Statistical Computations at FreeStatistics.org, Office for Research Development and Education, URL https://freestatistics.org/blog/index.php?pk=165133, Retrieved Sat, 04 May 2024 18:39:07 +0000
QR Codes:

Original text written by user:
IsPrivate?No (this computation is public)
User-defined keywords
Estimated Impact135
Family? (F = Feedback message, R = changed R code, M = changed R Module, P = changed Parameters, D = changed Data)
-     [Hierarchical Clustering] [] [2012-04-26 12:52:58] [729e3e98c2c68b03161978d53cee5b12]
-   P     [Hierarchical Clustering] [] [2012-04-29 11:44:30] [685fae5a377cc1dc51f9f02306b751ce] [Current]
Feedback Forum

Post a new message


Summary of computational transaction
Raw Inputview raw input (R code)
Raw Outputview raw output of R engine
Computing time2 seconds
R Server'Herman Ole Andreas Wold' @ wold.wessa.net

\begin{tabular}{lllllllll}
\hline
Summary of computational transaction \tabularnewline
Raw Input & view raw input (R code)  \tabularnewline
Raw Output & view raw output of R engine  \tabularnewline
Computing time & 2 seconds \tabularnewline
R Server & 'Herman Ole Andreas Wold' @ wold.wessa.net \tabularnewline
\hline
\end{tabular}
%Source: https://freestatistics.org/blog/index.php?pk=165133&T=0

[TABLE]
[ROW][C]Summary of computational transaction[/C][/ROW]
[ROW][C]Raw Input[/C][C]view raw input (R code) [/C][/ROW]
[ROW][C]Raw Output[/C][C]view raw output of R engine [/C][/ROW]
[ROW][C]Computing time[/C][C]2 seconds[/C][/ROW]
[ROW][C]R Server[/C][C]'Herman Ole Andreas Wold' @ wold.wessa.net[/C][/ROW]
[/TABLE]
Source: https://freestatistics.org/blog/index.php?pk=165133&T=0

Globally Unique Identifier (entire table): ba.freestatistics.org/blog/index.php?pk=165133&T=0

As an alternative you can also use a QR Code:  

The GUIDs for individual cells are displayed in the table below:

Summary of computational transaction
Raw Inputview raw input (R code)
Raw Outputview raw output of R engine
Computing time2 seconds
R Server'Herman Ole Andreas Wold' @ wold.wessa.net


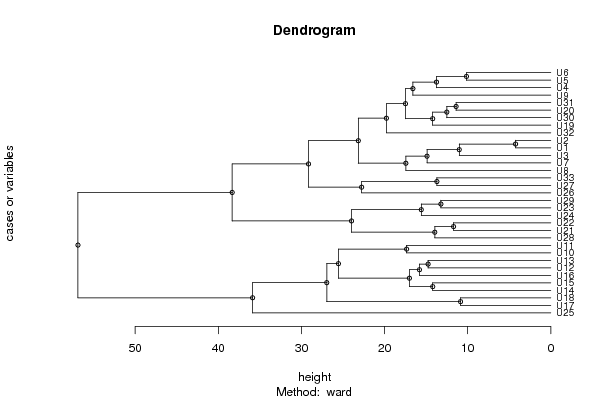
Summary of Dendrogram
LabelHeight
U14.24264068711928
U210.1488915650922
U310.8627804912002
U411.0190034998361
U511.4017542509914
U611.7046999107196
U712.5162567068886
U813.228756555323
U913.7113092008021
U1013.7556469224343
U1113.9616815356815
U1214.2126704035519
U1314.2169736216835
U1414.7648230602334
U1514.8953436025206
U1615.587617077652
U1715.8088421683101
U1816.595126463809
U1917.0154043592595
U2017.3493515728975
U2117.4461714071169
U2217.4881453165639
U2319.7817860349991
U2422.7635897387001
U2523.1628737740546
U2623.9778237782544
U2725.5528822432426
U2826.959472922115
U2929.1538853923861
U3035.8818079177075
U3138.3359294976434
U3256.8903172557803

\begin{tabular}{lllllllll}
\hline
Summary of Dendrogram \tabularnewline
Label & Height \tabularnewline
U1 & 4.24264068711928 \tabularnewline
U2 & 10.1488915650922 \tabularnewline
U3 & 10.8627804912002 \tabularnewline
U4 & 11.0190034998361 \tabularnewline
U5 & 11.4017542509914 \tabularnewline
U6 & 11.7046999107196 \tabularnewline
U7 & 12.5162567068886 \tabularnewline
U8 & 13.228756555323 \tabularnewline
U9 & 13.7113092008021 \tabularnewline
U10 & 13.7556469224343 \tabularnewline
U11 & 13.9616815356815 \tabularnewline
U12 & 14.2126704035519 \tabularnewline
U13 & 14.2169736216835 \tabularnewline
U14 & 14.7648230602334 \tabularnewline
U15 & 14.8953436025206 \tabularnewline
U16 & 15.587617077652 \tabularnewline
U17 & 15.8088421683101 \tabularnewline
U18 & 16.595126463809 \tabularnewline
U19 & 17.0154043592595 \tabularnewline
U20 & 17.3493515728975 \tabularnewline
U21 & 17.4461714071169 \tabularnewline
U22 & 17.4881453165639 \tabularnewline
U23 & 19.7817860349991 \tabularnewline
U24 & 22.7635897387001 \tabularnewline
U25 & 23.1628737740546 \tabularnewline
U26 & 23.9778237782544 \tabularnewline
U27 & 25.5528822432426 \tabularnewline
U28 & 26.959472922115 \tabularnewline
U29 & 29.1538853923861 \tabularnewline
U30 & 35.8818079177075 \tabularnewline
U31 & 38.3359294976434 \tabularnewline
U32 & 56.8903172557803 \tabularnewline
\hline
\end{tabular}
%Source: https://freestatistics.org/blog/index.php?pk=165133&T=1

[TABLE]
[ROW][C]Summary of Dendrogram[/C][/ROW]
[ROW][C]Label[/C][C]Height[/C][/ROW]
[ROW][C]U1[/C][C]4.24264068711928[/C][/ROW]
[ROW][C]U2[/C][C]10.1488915650922[/C][/ROW]
[ROW][C]U3[/C][C]10.8627804912002[/C][/ROW]
[ROW][C]U4[/C][C]11.0190034998361[/C][/ROW]
[ROW][C]U5[/C][C]11.4017542509914[/C][/ROW]
[ROW][C]U6[/C][C]11.7046999107196[/C][/ROW]
[ROW][C]U7[/C][C]12.5162567068886[/C][/ROW]
[ROW][C]U8[/C][C]13.228756555323[/C][/ROW]
[ROW][C]U9[/C][C]13.7113092008021[/C][/ROW]
[ROW][C]U10[/C][C]13.7556469224343[/C][/ROW]
[ROW][C]U11[/C][C]13.9616815356815[/C][/ROW]
[ROW][C]U12[/C][C]14.2126704035519[/C][/ROW]
[ROW][C]U13[/C][C]14.2169736216835[/C][/ROW]
[ROW][C]U14[/C][C]14.7648230602334[/C][/ROW]
[ROW][C]U15[/C][C]14.8953436025206[/C][/ROW]
[ROW][C]U16[/C][C]15.587617077652[/C][/ROW]
[ROW][C]U17[/C][C]15.8088421683101[/C][/ROW]
[ROW][C]U18[/C][C]16.595126463809[/C][/ROW]
[ROW][C]U19[/C][C]17.0154043592595[/C][/ROW]
[ROW][C]U20[/C][C]17.3493515728975[/C][/ROW]
[ROW][C]U21[/C][C]17.4461714071169[/C][/ROW]
[ROW][C]U22[/C][C]17.4881453165639[/C][/ROW]
[ROW][C]U23[/C][C]19.7817860349991[/C][/ROW]
[ROW][C]U24[/C][C]22.7635897387001[/C][/ROW]
[ROW][C]U25[/C][C]23.1628737740546[/C][/ROW]
[ROW][C]U26[/C][C]23.9778237782544[/C][/ROW]
[ROW][C]U27[/C][C]25.5528822432426[/C][/ROW]
[ROW][C]U28[/C][C]26.959472922115[/C][/ROW]
[ROW][C]U29[/C][C]29.1538853923861[/C][/ROW]
[ROW][C]U30[/C][C]35.8818079177075[/C][/ROW]
[ROW][C]U31[/C][C]38.3359294976434[/C][/ROW]
[ROW][C]U32[/C][C]56.8903172557803[/C][/ROW]
[/TABLE]
Source: https://freestatistics.org/blog/index.php?pk=165133&T=1

Globally Unique Identifier (entire table): ba.freestatistics.org/blog/index.php?pk=165133&T=1

As an alternative you can also use a QR Code:  

The GUIDs for individual cells are displayed in the table below:

Summary of Dendrogram
LabelHeight
U14.24264068711928
U210.1488915650922
U310.8627804912002
U411.0190034998361
U511.4017542509914
U611.7046999107196
U712.5162567068886
U813.228756555323
U913.7113092008021
U1013.7556469224343
U1113.9616815356815
U1214.2126704035519
U1314.2169736216835
U1414.7648230602334
U1514.8953436025206
U1615.587617077652
U1715.8088421683101
U1816.595126463809
U1917.0154043592595
U2017.3493515728975
U2117.4461714071169
U2217.4881453165639
U2319.7817860349991
U2422.7635897387001
U2523.1628737740546
U2623.9778237782544
U2725.5528822432426
U2826.959472922115
U2929.1538853923861
U3035.8818079177075
U3138.3359294976434
U3256.8903172557803


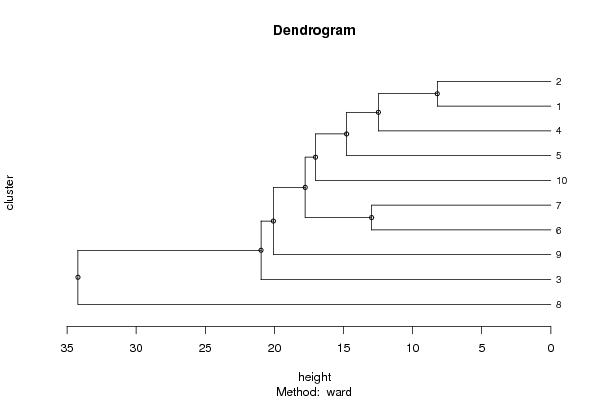
Summary of Cut Dendrogram
LabelHeight
18.21750615499662
212.4786353384967
312.9700509722292
414.7772972039957
517.0269610692751
617.7709895117846
720.075231807654
820.9705237276311
934.2158255866345

\begin{tabular}{lllllllll}
\hline
Summary of Cut Dendrogram \tabularnewline
Label & Height \tabularnewline
1 & 8.21750615499662 \tabularnewline
2 & 12.4786353384967 \tabularnewline
3 & 12.9700509722292 \tabularnewline
4 & 14.7772972039957 \tabularnewline
5 & 17.0269610692751 \tabularnewline
6 & 17.7709895117846 \tabularnewline
7 & 20.075231807654 \tabularnewline
8 & 20.9705237276311 \tabularnewline
9 & 34.2158255866345 \tabularnewline
\hline
\end{tabular}
%Source: https://freestatistics.org/blog/index.php?pk=165133&T=2

[TABLE]
[ROW][C]Summary of Cut Dendrogram[/C][/ROW]
[ROW][C]Label[/C][C]Height[/C][/ROW]
[ROW][C]1[/C][C]8.21750615499662[/C][/ROW]
[ROW][C]2[/C][C]12.4786353384967[/C][/ROW]
[ROW][C]3[/C][C]12.9700509722292[/C][/ROW]
[ROW][C]4[/C][C]14.7772972039957[/C][/ROW]
[ROW][C]5[/C][C]17.0269610692751[/C][/ROW]
[ROW][C]6[/C][C]17.7709895117846[/C][/ROW]
[ROW][C]7[/C][C]20.075231807654[/C][/ROW]
[ROW][C]8[/C][C]20.9705237276311[/C][/ROW]
[ROW][C]9[/C][C]34.2158255866345[/C][/ROW]
[/TABLE]
Source: https://freestatistics.org/blog/index.php?pk=165133&T=2

Globally Unique Identifier (entire table): ba.freestatistics.org/blog/index.php?pk=165133&T=2

As an alternative you can also use a QR Code:  

The GUIDs for individual cells are displayed in the table below:

Summary of Cut Dendrogram
LabelHeight
18.21750615499662
212.4786353384967
312.9700509722292
414.7772972039957
517.0269610692751
617.7709895117846
720.075231807654
820.9705237276311
934.2158255866345


Parameters (Session):
par1 = ward ; par2 = 10 ; par3 = TRUE ; par4 = FALSE ; par5 = male ; par6 = all ; par7 = all ; par8 = CSUQ ; par9 = variables ;
Parameters (R input):
par1 = ward ; par2 = 10 ; par3 = TRUE ; par4 = FALSE ; par5 = male ; par6 = all ; par7 = all ; par8 = CSUQ ; par9 = variables ;
R code (references can be found in the software module):
x <- as.data.frame(read.table(file='https://automated.biganalytics.eu/download/utaut.csv',sep=',',header=T))
x$U25 <- 6-x$U25
if(par5 == 'female') x <- x[x$Gender==0,]
if(par5 == 'male') x <- x[x$Gender==1,]
if(par6 == 'prep') x <- x[x$Pop==1,]
if(par6 == 'bachelor') x <- x[x$Pop==0,]
if(par7 != 'all') {
x <- x[x$Year==as.numeric(par7),]
}
cAc <- with(x,cbind( A1, A2, A3, A4, A5, A6, A7, A8, A9,A10))
cAs <- with(x,cbind(A11,A12,A13,A14,A15,A16,A17,A18,A19,A20))
cA <- cbind(cAc,cAs)
cCa <- with(x,cbind(C1,C3,C5,C7, C9,C11,C13,C15,C17,C19,C21,C23,C25,C27,C29,C31,C33,C35,C37,C39,C41,C43,C45,C47))
cCp <- with(x,cbind(C2,C4,C6,C8,C10,C12,C14,C16,C18,C20,C22,C24,C26,C28,C30,C32,C34,C36,C38,C40,C42,C44,C46,C48))
cC <- cbind(cCa,cCp)
cU <- with(x,cbind(U1,U2,U3,U4,U5,U6,U7,U8,U9,U10,U11,U12,U13,U14,U15,U16,U17,U18,U19,U20,U21,U22,U23,U24,U25,U26,U27,U28,U29,U30,U31,U32,U33))
cE <- with(x,cbind(BC,NNZFG,MRT,AFL,LPM,LPC,W,WPA))
cX <- with(x,cbind(X1,X2,X3,X4,X5,X6,X7,X8,X9,X10,X11,X12,X13,X14,X15,X16,X17,X18))
if (par8=='ATTLES connected') x <- cAc
if (par8=='ATTLES separate') x <- cAs
if (par8=='ATTLES all') x <- cA
if (par8=='COLLES actuals') x <- cCa
if (par8=='COLLES preferred') x <- cCp
if (par8=='COLLES all') x <- cC
if (par8=='CSUQ') x <- cU
if (par8=='Learning Activities') x <- cE
if (par8=='Exam Items') x <- cX
ncol <- length(x[1,])
for (jjj in 1:ncol) {
x <- x[!is.na(x[,jjj]),]
}
par3 <- as.logical(par3)
par4 <- as.logical(par4)
if (par3 == TRUE){
dum = xlab
xlab = ylab
ylab = dum
}
if (par9=='variables') {
x <- t(x)
} else {
ncol <- length(x[1,])
colnames(x) <- 1:ncol
}
hc <- hclust(dist(x),method=par1)
d <- as.dendrogram(hc)
str(d)
mysub <- paste('Method: ',par1)
bitmap(file='test1.png')
if (par4 == TRUE){
plot(d,main=main,ylab=ylab,xlab=xlab,horiz=par3, nodePar=list(pch = c(1,NA), cex=0.8, lab.cex = 0.8),type='t',center=T, sub=mysub)
} else {
plot(d,main=main,ylab=ylab,xlab=xlab,horiz=par3, nodePar=list(pch = c(1,NA), cex=0.8, lab.cex = 0.8), sub=mysub)
}
dev.off()
if (par2 != 'ALL'){
if (par3 == TRUE){
ylab = 'cluster'
} else {
xlab = 'cluster'
}
par2 <- as.numeric(par2)
memb <- cutree(hc, k = par2)
cent <- NULL
for(k in 1:par2){
cent <- rbind(cent, colMeans(x[memb == k, , drop = FALSE]))
}
hc1 <- hclust(dist(cent),method=par1, members = table(memb))
de <- as.dendrogram(hc1)
bitmap(file='test2.png')
if (par4 == TRUE){
plot(de,main=main,ylab=ylab,xlab=xlab,horiz=par3, nodePar=list(pch = c(1,NA), cex=0.8, lab.cex = 0.8),type='t',center=T, sub=mysub)
} else {
plot(de,main=main,ylab=ylab,xlab=xlab,horiz=par3, nodePar=list(pch = c(1,NA), cex=0.8, lab.cex = 0.8), sub=mysub)
}
dev.off()
str(de)
}
load(file='createtable')
a<-table.start()
a<-table.row.start(a)
a<-table.element(a,'Summary of Dendrogram',2,TRUE)
a<-table.row.end(a)
a<-table.row.start(a)
a<-table.element(a,'Label',header=TRUE)
a<-table.element(a,'Height',header=TRUE)
a<-table.row.end(a)
num <- length(x[,1])-1
for (i in 1:num)
{
a<-table.row.start(a)
a<-table.element(a,hc$labels[i])
a<-table.element(a,hc$height[i])
a<-table.row.end(a)
}
a<-table.end(a)
table.save(a,file='mytable1.tab')
if (par2 != 'ALL'){
a<-table.start()
a<-table.row.start(a)
a<-table.element(a,'Summary of Cut Dendrogram',2,TRUE)
a<-table.row.end(a)
a<-table.row.start(a)
a<-table.element(a,'Label',header=TRUE)
a<-table.element(a,'Height',header=TRUE)
a<-table.row.end(a)
num <- par2-1
for (i in 1:num)
{
a<-table.row.start(a)
a<-table.element(a,i)
a<-table.element(a,hc1$height[i])
a<-table.row.end(a)
}
a<-table.end(a)
table.save(a,file='mytable2.tab')
}