Free Statistics

of Irreproducible Research!

Author's title

Author*The author of this computation has been verified*
R Software Modulerwasp_hierarchicalclusteringdm.wasp
Title produced by softwareHierarchical Clustering
Date of computationSun, 29 Apr 2012 07:43:34 -0400
Cite this page as followsStatistical Computations at FreeStatistics.org, Office for Research Development and Education, URL https://freestatistics.org/blog/index.php?v=date/2012/Apr/29/t133569983478j402n0mize4ct.htm/, Retrieved Sat, 04 May 2024 17:04:04 +0000
Statistical Computations at FreeStatistics.org, Office for Research Development and Education, URL https://freestatistics.org/blog/index.php?pk=165128, Retrieved Sat, 04 May 2024 17:04:04 +0000
QR Codes:

Original text written by user:
IsPrivate?No (this computation is public)
User-defined keywords
Estimated Impact143
Family? (F = Feedback message, R = changed R code, M = changed R Module, P = changed Parameters, D = changed Data)
-     [Hierarchical Clustering] [] [2012-04-26 12:52:58] [729e3e98c2c68b03161978d53cee5b12]
-   P     [Hierarchical Clustering] [] [2012-04-29 11:43:34] [685fae5a377cc1dc51f9f02306b751ce] [Current]
Feedback Forum

Post a new message


Summary of computational transaction
Raw Inputview raw input (R code)
Raw Outputview raw output of R engine
Computing time3 seconds
R Server'AstonUniversity' @ aston.wessa.net

\begin{tabular}{lllllllll}
\hline
Summary of computational transaction \tabularnewline
Raw Input & view raw input (R code)  \tabularnewline
Raw Output & view raw output of R engine  \tabularnewline
Computing time & 3 seconds \tabularnewline
R Server & 'AstonUniversity' @ aston.wessa.net \tabularnewline
\hline
\end{tabular}
%Source: https://freestatistics.org/blog/index.php?pk=165128&T=0

[TABLE]
[ROW][C]Summary of computational transaction[/C][/ROW]
[ROW][C]Raw Input[/C][C]view raw input (R code) [/C][/ROW]
[ROW][C]Raw Output[/C][C]view raw output of R engine [/C][/ROW]
[ROW][C]Computing time[/C][C]3 seconds[/C][/ROW]
[ROW][C]R Server[/C][C]'AstonUniversity' @ aston.wessa.net[/C][/ROW]
[/TABLE]
Source: https://freestatistics.org/blog/index.php?pk=165128&T=0

Globally Unique Identifier (entire table): ba.freestatistics.org/blog/index.php?pk=165128&T=0

As an alternative you can also use a QR Code:  

The GUIDs for individual cells are displayed in the table below:

Summary of computational transaction
Raw Inputview raw input (R code)
Raw Outputview raw output of R engine
Computing time3 seconds
R Server'AstonUniversity' @ aston.wessa.net


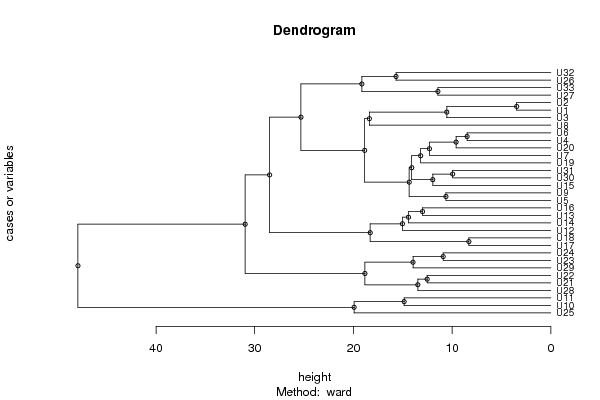
Summary of Dendrogram
LabelHeight
U13.46410161513775
U28.30662386291807
U38.48528137423857
U49.60067338258245
U59.9498743710662
U610.5452519781436
U710.6301458127346
U810.9087121146357
U911.4455231422596
U1011.9651725913837
U1112.3014060238565
U1212.5299640861417
U1313
U1413.1920262801471
U1513.4756483283566
U1613.9643406530354
U1714.0931904821339
U1814.3470310312337
U1914.4243544465609
U2014.8660687473185
U2115.0369166267487
U2215.6843871413581
U2318.3014485504115
U2418.3881898359293
U2518.8385220749832
U2618.8664948458592
U2719.1476713086521
U2819.9321275586912
U2925.3164359694848
U3028.4940416054293
U3130.9679683215082
U3247.9110894669883

\begin{tabular}{lllllllll}
\hline
Summary of Dendrogram \tabularnewline
Label & Height \tabularnewline
U1 & 3.46410161513775 \tabularnewline
U2 & 8.30662386291807 \tabularnewline
U3 & 8.48528137423857 \tabularnewline
U4 & 9.60067338258245 \tabularnewline
U5 & 9.9498743710662 \tabularnewline
U6 & 10.5452519781436 \tabularnewline
U7 & 10.6301458127346 \tabularnewline
U8 & 10.9087121146357 \tabularnewline
U9 & 11.4455231422596 \tabularnewline
U10 & 11.9651725913837 \tabularnewline
U11 & 12.3014060238565 \tabularnewline
U12 & 12.5299640861417 \tabularnewline
U13 & 13 \tabularnewline
U14 & 13.1920262801471 \tabularnewline
U15 & 13.4756483283566 \tabularnewline
U16 & 13.9643406530354 \tabularnewline
U17 & 14.0931904821339 \tabularnewline
U18 & 14.3470310312337 \tabularnewline
U19 & 14.4243544465609 \tabularnewline
U20 & 14.8660687473185 \tabularnewline
U21 & 15.0369166267487 \tabularnewline
U22 & 15.6843871413581 \tabularnewline
U23 & 18.3014485504115 \tabularnewline
U24 & 18.3881898359293 \tabularnewline
U25 & 18.8385220749832 \tabularnewline
U26 & 18.8664948458592 \tabularnewline
U27 & 19.1476713086521 \tabularnewline
U28 & 19.9321275586912 \tabularnewline
U29 & 25.3164359694848 \tabularnewline
U30 & 28.4940416054293 \tabularnewline
U31 & 30.9679683215082 \tabularnewline
U32 & 47.9110894669883 \tabularnewline
\hline
\end{tabular}
%Source: https://freestatistics.org/blog/index.php?pk=165128&T=1

[TABLE]
[ROW][C]Summary of Dendrogram[/C][/ROW]
[ROW][C]Label[/C][C]Height[/C][/ROW]
[ROW][C]U1[/C][C]3.46410161513775[/C][/ROW]
[ROW][C]U2[/C][C]8.30662386291807[/C][/ROW]
[ROW][C]U3[/C][C]8.48528137423857[/C][/ROW]
[ROW][C]U4[/C][C]9.60067338258245[/C][/ROW]
[ROW][C]U5[/C][C]9.9498743710662[/C][/ROW]
[ROW][C]U6[/C][C]10.5452519781436[/C][/ROW]
[ROW][C]U7[/C][C]10.6301458127346[/C][/ROW]
[ROW][C]U8[/C][C]10.9087121146357[/C][/ROW]
[ROW][C]U9[/C][C]11.4455231422596[/C][/ROW]
[ROW][C]U10[/C][C]11.9651725913837[/C][/ROW]
[ROW][C]U11[/C][C]12.3014060238565[/C][/ROW]
[ROW][C]U12[/C][C]12.5299640861417[/C][/ROW]
[ROW][C]U13[/C][C]13[/C][/ROW]
[ROW][C]U14[/C][C]13.1920262801471[/C][/ROW]
[ROW][C]U15[/C][C]13.4756483283566[/C][/ROW]
[ROW][C]U16[/C][C]13.9643406530354[/C][/ROW]
[ROW][C]U17[/C][C]14.0931904821339[/C][/ROW]
[ROW][C]U18[/C][C]14.3470310312337[/C][/ROW]
[ROW][C]U19[/C][C]14.4243544465609[/C][/ROW]
[ROW][C]U20[/C][C]14.8660687473185[/C][/ROW]
[ROW][C]U21[/C][C]15.0369166267487[/C][/ROW]
[ROW][C]U22[/C][C]15.6843871413581[/C][/ROW]
[ROW][C]U23[/C][C]18.3014485504115[/C][/ROW]
[ROW][C]U24[/C][C]18.3881898359293[/C][/ROW]
[ROW][C]U25[/C][C]18.8385220749832[/C][/ROW]
[ROW][C]U26[/C][C]18.8664948458592[/C][/ROW]
[ROW][C]U27[/C][C]19.1476713086521[/C][/ROW]
[ROW][C]U28[/C][C]19.9321275586912[/C][/ROW]
[ROW][C]U29[/C][C]25.3164359694848[/C][/ROW]
[ROW][C]U30[/C][C]28.4940416054293[/C][/ROW]
[ROW][C]U31[/C][C]30.9679683215082[/C][/ROW]
[ROW][C]U32[/C][C]47.9110894669883[/C][/ROW]
[/TABLE]
Source: https://freestatistics.org/blog/index.php?pk=165128&T=1

Globally Unique Identifier (entire table): ba.freestatistics.org/blog/index.php?pk=165128&T=1

As an alternative you can also use a QR Code:  

The GUIDs for individual cells are displayed in the table below:

Summary of Dendrogram
LabelHeight
U13.46410161513775
U28.30662386291807
U38.48528137423857
U49.60067338258245
U59.9498743710662
U610.5452519781436
U710.6301458127346
U810.9087121146357
U911.4455231422596
U1011.9651725913837
U1112.3014060238565
U1212.5299640861417
U1313
U1413.1920262801471
U1513.4756483283566
U1613.9643406530354
U1714.0931904821339
U1814.3470310312337
U1914.4243544465609
U2014.8660687473185
U2115.0369166267487
U2215.6843871413581
U2318.3014485504115
U2418.3881898359293
U2518.8385220749832
U2618.8664948458592
U2719.1476713086521
U2819.9321275586912
U2925.3164359694848
U3028.4940416054293
U3130.9679683215082
U3247.9110894669883


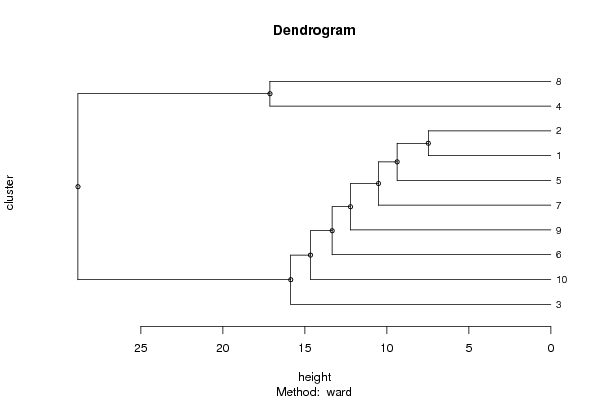
Summary of Cut Dendrogram
LabelHeight
17.46941913553004
29.36997872850449
310.5067056845127
412.2143014412652
513.3327821516485
614.6543707748535
715.8582640122111
817.1245437895437
928.8315431673204

\begin{tabular}{lllllllll}
\hline
Summary of Cut Dendrogram \tabularnewline
Label & Height \tabularnewline
1 & 7.46941913553004 \tabularnewline
2 & 9.36997872850449 \tabularnewline
3 & 10.5067056845127 \tabularnewline
4 & 12.2143014412652 \tabularnewline
5 & 13.3327821516485 \tabularnewline
6 & 14.6543707748535 \tabularnewline
7 & 15.8582640122111 \tabularnewline
8 & 17.1245437895437 \tabularnewline
9 & 28.8315431673204 \tabularnewline
\hline
\end{tabular}
%Source: https://freestatistics.org/blog/index.php?pk=165128&T=2

[TABLE]
[ROW][C]Summary of Cut Dendrogram[/C][/ROW]
[ROW][C]Label[/C][C]Height[/C][/ROW]
[ROW][C]1[/C][C]7.46941913553004[/C][/ROW]
[ROW][C]2[/C][C]9.36997872850449[/C][/ROW]
[ROW][C]3[/C][C]10.5067056845127[/C][/ROW]
[ROW][C]4[/C][C]12.2143014412652[/C][/ROW]
[ROW][C]5[/C][C]13.3327821516485[/C][/ROW]
[ROW][C]6[/C][C]14.6543707748535[/C][/ROW]
[ROW][C]7[/C][C]15.8582640122111[/C][/ROW]
[ROW][C]8[/C][C]17.1245437895437[/C][/ROW]
[ROW][C]9[/C][C]28.8315431673204[/C][/ROW]
[/TABLE]
Source: https://freestatistics.org/blog/index.php?pk=165128&T=2

Globally Unique Identifier (entire table): ba.freestatistics.org/blog/index.php?pk=165128&T=2

As an alternative you can also use a QR Code:  

The GUIDs for individual cells are displayed in the table below:

Summary of Cut Dendrogram
LabelHeight
17.46941913553004
29.36997872850449
310.5067056845127
412.2143014412652
513.3327821516485
614.6543707748535
715.8582640122111
817.1245437895437
928.8315431673204


Parameters (Session):
par1 = ward ; par2 = 10 ; par3 = TRUE ; par4 = FALSE ; par5 = female ; par6 = all ; par7 = all ; par8 = CSUQ ; par9 = variables ;
Parameters (R input):
par1 = ward ; par2 = 10 ; par3 = TRUE ; par4 = FALSE ; par5 = female ; par6 = all ; par7 = all ; par8 = CSUQ ; par9 = variables ;
R code (references can be found in the software module):
x <- as.data.frame(read.table(file='https://automated.biganalytics.eu/download/utaut.csv',sep=',',header=T))
x$U25 <- 6-x$U25
if(par5 == 'female') x <- x[x$Gender==0,]
if(par5 == 'male') x <- x[x$Gender==1,]
if(par6 == 'prep') x <- x[x$Pop==1,]
if(par6 == 'bachelor') x <- x[x$Pop==0,]
if(par7 != 'all') {
x <- x[x$Year==as.numeric(par7),]
}
cAc <- with(x,cbind( A1, A2, A3, A4, A5, A6, A7, A8, A9,A10))
cAs <- with(x,cbind(A11,A12,A13,A14,A15,A16,A17,A18,A19,A20))
cA <- cbind(cAc,cAs)
cCa <- with(x,cbind(C1,C3,C5,C7, C9,C11,C13,C15,C17,C19,C21,C23,C25,C27,C29,C31,C33,C35,C37,C39,C41,C43,C45,C47))
cCp <- with(x,cbind(C2,C4,C6,C8,C10,C12,C14,C16,C18,C20,C22,C24,C26,C28,C30,C32,C34,C36,C38,C40,C42,C44,C46,C48))
cC <- cbind(cCa,cCp)
cU <- with(x,cbind(U1,U2,U3,U4,U5,U6,U7,U8,U9,U10,U11,U12,U13,U14,U15,U16,U17,U18,U19,U20,U21,U22,U23,U24,U25,U26,U27,U28,U29,U30,U31,U32,U33))
cE <- with(x,cbind(BC,NNZFG,MRT,AFL,LPM,LPC,W,WPA))
cX <- with(x,cbind(X1,X2,X3,X4,X5,X6,X7,X8,X9,X10,X11,X12,X13,X14,X15,X16,X17,X18))
if (par8=='ATTLES connected') x <- cAc
if (par8=='ATTLES separate') x <- cAs
if (par8=='ATTLES all') x <- cA
if (par8=='COLLES actuals') x <- cCa
if (par8=='COLLES preferred') x <- cCp
if (par8=='COLLES all') x <- cC
if (par8=='CSUQ') x <- cU
if (par8=='Learning Activities') x <- cE
if (par8=='Exam Items') x <- cX
ncol <- length(x[1,])
for (jjj in 1:ncol) {
x <- x[!is.na(x[,jjj]),]
}
par3 <- as.logical(par3)
par4 <- as.logical(par4)
if (par3 == TRUE){
dum = xlab
xlab = ylab
ylab = dum
}
if (par9=='variables') {
x <- t(x)
} else {
ncol <- length(x[1,])
colnames(x) <- 1:ncol
}
hc <- hclust(dist(x),method=par1)
d <- as.dendrogram(hc)
str(d)
mysub <- paste('Method: ',par1)
bitmap(file='test1.png')
if (par4 == TRUE){
plot(d,main=main,ylab=ylab,xlab=xlab,horiz=par3, nodePar=list(pch = c(1,NA), cex=0.8, lab.cex = 0.8),type='t',center=T, sub=mysub)
} else {
plot(d,main=main,ylab=ylab,xlab=xlab,horiz=par3, nodePar=list(pch = c(1,NA), cex=0.8, lab.cex = 0.8), sub=mysub)
}
dev.off()
if (par2 != 'ALL'){
if (par3 == TRUE){
ylab = 'cluster'
} else {
xlab = 'cluster'
}
par2 <- as.numeric(par2)
memb <- cutree(hc, k = par2)
cent <- NULL
for(k in 1:par2){
cent <- rbind(cent, colMeans(x[memb == k, , drop = FALSE]))
}
hc1 <- hclust(dist(cent),method=par1, members = table(memb))
de <- as.dendrogram(hc1)
bitmap(file='test2.png')
if (par4 == TRUE){
plot(de,main=main,ylab=ylab,xlab=xlab,horiz=par3, nodePar=list(pch = c(1,NA), cex=0.8, lab.cex = 0.8),type='t',center=T, sub=mysub)
} else {
plot(de,main=main,ylab=ylab,xlab=xlab,horiz=par3, nodePar=list(pch = c(1,NA), cex=0.8, lab.cex = 0.8), sub=mysub)
}
dev.off()
str(de)
}
load(file='createtable')
a<-table.start()
a<-table.row.start(a)
a<-table.element(a,'Summary of Dendrogram',2,TRUE)
a<-table.row.end(a)
a<-table.row.start(a)
a<-table.element(a,'Label',header=TRUE)
a<-table.element(a,'Height',header=TRUE)
a<-table.row.end(a)
num <- length(x[,1])-1
for (i in 1:num)
{
a<-table.row.start(a)
a<-table.element(a,hc$labels[i])
a<-table.element(a,hc$height[i])
a<-table.row.end(a)
}
a<-table.end(a)
table.save(a,file='mytable1.tab')
if (par2 != 'ALL'){
a<-table.start()
a<-table.row.start(a)
a<-table.element(a,'Summary of Cut Dendrogram',2,TRUE)
a<-table.row.end(a)
a<-table.row.start(a)
a<-table.element(a,'Label',header=TRUE)
a<-table.element(a,'Height',header=TRUE)
a<-table.row.end(a)
num <- par2-1
for (i in 1:num)
{
a<-table.row.start(a)
a<-table.element(a,i)
a<-table.element(a,hc1$height[i])
a<-table.row.end(a)
}
a<-table.end(a)
table.save(a,file='mytable2.tab')
}