Free Statistics

of Irreproducible Research!

Author's title

Author*Unverified author*
R Software Modulerwasp_smp.wasp
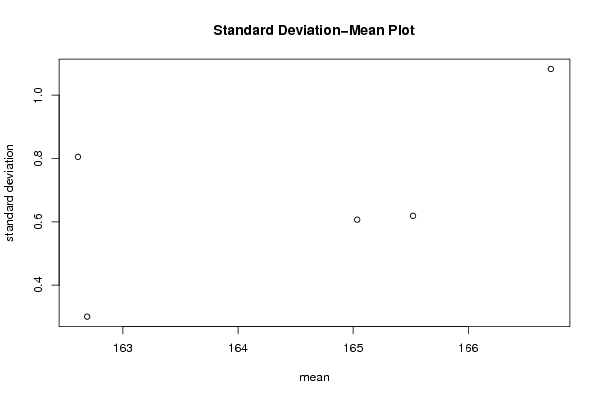
Title produced by softwareStandard Deviation-Mean Plot
Date of computationWed, 25 Apr 2012 17:54:46 -0400
Cite this page as followsStatistical Computations at FreeStatistics.org, Office for Research Development and Education, URL https://freestatistics.org/blog/index.php?v=date/2012/Apr/25/t1335390942bhb1hf1ih195fcm.htm/, Retrieved Mon, 06 May 2024 11:53:15 +0000
Statistical Computations at FreeStatistics.org, Office for Research Development and Education, URL https://freestatistics.org/blog/index.php?pk=164869, Retrieved Mon, 06 May 2024 11:53:15 +0000
QR Codes:

Original text written by user:
IsPrivate?No (this computation is public)
User-defined keywordsKDGP2W81
Estimated Impact74
Family? (F = Feedback message, R = changed R code, M = changed R Module, P = changed Parameters, D = changed Data)
-       [Standard Deviation-Mean Plot] [sportvesten] [2012-04-25 21:54:46] [f6a7b86b75cb82ac7a5a766dce297b13] [Current]
Feedback Forum

Post a new message
Dataseries X:
162.32
162.76
163.39
162.58
162.66
162.66
162.66
162.89
163.03
162.38
162.44
162.51
162.51
162.42
162.07
161.45
162.22
162.21
162.21
162.21
162.41
163.96
163.79
163.86
163.86
164.39
164.74
164.27
165.2
165.42
165.42
165.5
165.71
165.74
165.29
164.88
164.88
164.57
164.53
165.03
165.92
165.92
165.92
165.92
166.12
166.34
165.48
165.61
165.61
165.94
165.88
166.23
166.32
166.43
166.43
166.2
166.21
168.02
168.68
168.65


Summary of computational transaction
Raw Inputview raw input (R code)
Raw Outputview raw output of R engine
Computing time11 seconds
R Server'AstonUniversity' @ aston.wessa.net

\begin{tabular}{lllllllll}
\hline
Summary of computational transaction \tabularnewline
Raw Input & view raw input (R code)  \tabularnewline
Raw Output & view raw output of R engine  \tabularnewline
Computing time & 11 seconds \tabularnewline
R Server & 'AstonUniversity' @ aston.wessa.net \tabularnewline
\hline
\end{tabular}
%Source: https://freestatistics.org/blog/index.php?pk=164869&T=0

[TABLE]
[ROW][C]Summary of computational transaction[/C][/ROW]
[ROW][C]Raw Input[/C][C]view raw input (R code) [/C][/ROW]
[ROW][C]Raw Output[/C][C]view raw output of R engine [/C][/ROW]
[ROW][C]Computing time[/C][C]11 seconds[/C][/ROW]
[ROW][C]R Server[/C][C]'AstonUniversity' @ aston.wessa.net[/C][/ROW]
[/TABLE]
Source: https://freestatistics.org/blog/index.php?pk=164869&T=0

Globally Unique Identifier (entire table): ba.freestatistics.org/blog/index.php?pk=164869&T=0

As an alternative you can also use a QR Code:  

The GUIDs for individual cells are displayed in the table below:

Summary of computational transaction
Raw Inputview raw input (R code)
Raw Outputview raw output of R engine
Computing time11 seconds
R Server'AstonUniversity' @ aston.wessa.net


Standard Deviation-Mean Plot
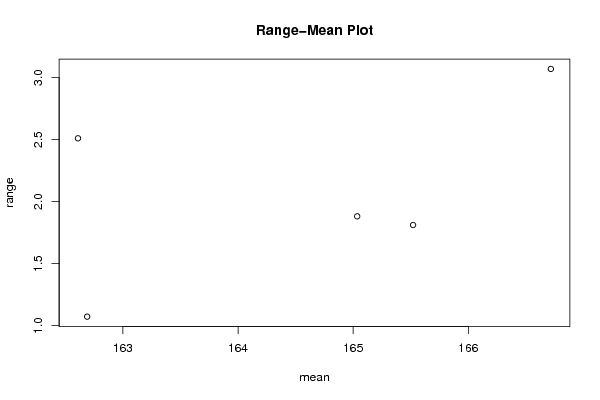
SectionMeanStandard DeviationRange
1162.690.3004844573200211.06999999999999
2162.610.8052554648286282.51000000000002
3165.0350.6068173306088661.88
4165.520.6189727560460731.81
5166.7166666666671.082978496666683.06999999999999

\begin{tabular}{lllllllll}
\hline
Standard Deviation-Mean Plot \tabularnewline
Section & Mean & Standard Deviation & Range \tabularnewline
1 & 162.69 & 0.300484457320021 & 1.06999999999999 \tabularnewline
2 & 162.61 & 0.805255464828628 & 2.51000000000002 \tabularnewline
3 & 165.035 & 0.606817330608866 & 1.88 \tabularnewline
4 & 165.52 & 0.618972756046073 & 1.81 \tabularnewline
5 & 166.716666666667 & 1.08297849666668 & 3.06999999999999 \tabularnewline
\hline
\end{tabular}
%Source: https://freestatistics.org/blog/index.php?pk=164869&T=1

[TABLE]
[ROW][C]Standard Deviation-Mean Plot[/C][/ROW]
[ROW][C]Section[/C][C]Mean[/C][C]Standard Deviation[/C][C]Range[/C][/ROW]
[ROW][C]1[/C][C]162.69[/C][C]0.300484457320021[/C][C]1.06999999999999[/C][/ROW]
[ROW][C]2[/C][C]162.61[/C][C]0.805255464828628[/C][C]2.51000000000002[/C][/ROW]
[ROW][C]3[/C][C]165.035[/C][C]0.606817330608866[/C][C]1.88[/C][/ROW]
[ROW][C]4[/C][C]165.52[/C][C]0.618972756046073[/C][C]1.81[/C][/ROW]
[ROW][C]5[/C][C]166.716666666667[/C][C]1.08297849666668[/C][C]3.06999999999999[/C][/ROW]
[/TABLE]
Source: https://freestatistics.org/blog/index.php?pk=164869&T=1

Globally Unique Identifier (entire table): ba.freestatistics.org/blog/index.php?pk=164869&T=1

As an alternative you can also use a QR Code:  

The GUIDs for individual cells are displayed in the table below:

Standard Deviation-Mean Plot
SectionMeanStandard DeviationRange
1162.690.3004844573200211.06999999999999
2162.610.8052554648286282.51000000000002
3165.0350.6068173306088661.88
4165.520.6189727560460731.81
5166.7166666666671.082978496666683.06999999999999


Regression: S.E.(k) = alpha + beta * Mean(k)
alpha-14.9276949828816
beta0.0948889763443652
S.D.0.0737090499243367
T-STAT1.28734499280306
p-value0.288300663002148

\begin{tabular}{lllllllll}
\hline
Regression: S.E.(k) = alpha + beta * Mean(k) \tabularnewline
alpha & -14.9276949828816 \tabularnewline
beta & 0.0948889763443652 \tabularnewline
S.D. & 0.0737090499243367 \tabularnewline
T-STAT & 1.28734499280306 \tabularnewline
p-value & 0.288300663002148 \tabularnewline
\hline
\end{tabular}
%Source: https://freestatistics.org/blog/index.php?pk=164869&T=2

[TABLE]
[ROW][C]Regression: S.E.(k) = alpha + beta * Mean(k)[/C][/ROW]
[ROW][C]alpha[/C][C]-14.9276949828816[/C][/ROW]
[ROW][C]beta[/C][C]0.0948889763443652[/C][/ROW]
[ROW][C]S.D.[/C][C]0.0737090499243367[/C][/ROW]
[ROW][C]T-STAT[/C][C]1.28734499280306[/C][/ROW]
[ROW][C]p-value[/C][C]0.288300663002148[/C][/ROW]
[/TABLE]
Source: https://freestatistics.org/blog/index.php?pk=164869&T=2

Globally Unique Identifier (entire table): ba.freestatistics.org/blog/index.php?pk=164869&T=2

As an alternative you can also use a QR Code:  

The GUIDs for individual cells are displayed in the table below:

Regression: S.E.(k) = alpha + beta * Mean(k)
alpha-14.9276949828816
beta0.0948889763443652
S.D.0.0737090499243367
T-STAT1.28734499280306
p-value0.288300663002148


Regression: ln S.E.(k) = alpha + beta * ln Mean(k)
alpha-130.980342912814
beta25.576709149761
S.D.20.1092246579225
T-STAT1.2718893734018
p-value0.29305543502788
Lambda-24.576709149761

\begin{tabular}{lllllllll}
\hline
Regression: ln S.E.(k) = alpha + beta * ln Mean(k) \tabularnewline
alpha & -130.980342912814 \tabularnewline
beta & 25.576709149761 \tabularnewline
S.D. & 20.1092246579225 \tabularnewline
T-STAT & 1.2718893734018 \tabularnewline
p-value & 0.29305543502788 \tabularnewline
Lambda & -24.576709149761 \tabularnewline
\hline
\end{tabular}
%Source: https://freestatistics.org/blog/index.php?pk=164869&T=3

[TABLE]
[ROW][C]Regression: ln S.E.(k) = alpha + beta * ln Mean(k)[/C][/ROW]
[ROW][C]alpha[/C][C]-130.980342912814[/C][/ROW]
[ROW][C]beta[/C][C]25.576709149761[/C][/ROW]
[ROW][C]S.D.[/C][C]20.1092246579225[/C][/ROW]
[ROW][C]T-STAT[/C][C]1.2718893734018[/C][/ROW]
[ROW][C]p-value[/C][C]0.29305543502788[/C][/ROW]
[ROW][C]Lambda[/C][C]-24.576709149761[/C][/ROW]
[/TABLE]
Source: https://freestatistics.org/blog/index.php?pk=164869&T=3

Globally Unique Identifier (entire table): ba.freestatistics.org/blog/index.php?pk=164869&T=3

As an alternative you can also use a QR Code:  

The GUIDs for individual cells are displayed in the table below:

Regression: ln S.E.(k) = alpha + beta * ln Mean(k)
alpha-130.980342912814
beta25.576709149761
S.D.20.1092246579225
T-STAT1.2718893734018
p-value0.29305543502788
Lambda-24.576709149761


Parameters (Session):
par1 = 12 ;
Parameters (R input):
par1 = 12 ;
R code (references can be found in the software module):
par1 <- as.numeric(par1)
(n <- length(x))
(np <- floor(n / par1))
arr <- array(NA,dim=c(par1,np))
j <- 0
k <- 1
for (i in 1:(np*par1))
{
j = j + 1
arr[j,k] <- x[i]
if (j == par1) {
j = 0
k=k+1
}
}
arr
arr.mean <- array(NA,dim=np)
arr.sd <- array(NA,dim=np)
arr.range <- array(NA,dim=np)
for (j in 1:np)
{
arr.mean[j] <- mean(arr[,j],na.rm=TRUE)
arr.sd[j] <- sd(arr[,j],na.rm=TRUE)
arr.range[j] <- max(arr[,j],na.rm=TRUE) - min(arr[,j],na.rm=TRUE)
}
arr.mean
arr.sd
arr.range
(lm1 <- lm(arr.sd~arr.mean))
(lnlm1 <- lm(log(arr.sd)~log(arr.mean)))
(lm2 <- lm(arr.range~arr.mean))
bitmap(file='test1.png')
plot(arr.mean,arr.sd,main='Standard Deviation-Mean Plot',xlab='mean',ylab='standard deviation')
dev.off()
bitmap(file='test2.png')
plot(arr.mean,arr.range,main='Range-Mean Plot',xlab='mean',ylab='range')
dev.off()
load(file='createtable')
a<-table.start()
a<-table.row.start(a)
a<-table.element(a,'Standard Deviation-Mean Plot',4,TRUE)
a<-table.row.end(a)
a<-table.row.start(a)
a<-table.element(a,'Section',header=TRUE)
a<-table.element(a,'Mean',header=TRUE)
a<-table.element(a,'Standard Deviation',header=TRUE)
a<-table.element(a,'Range',header=TRUE)
a<-table.row.end(a)
for (j in 1:np) {
a<-table.row.start(a)
a<-table.element(a,j,header=TRUE)
a<-table.element(a,arr.mean[j])
a<-table.element(a,arr.sd[j] )
a<-table.element(a,arr.range[j] )
a<-table.row.end(a)
}
a<-table.end(a)
table.save(a,file='mytable.tab')
a<-table.start()
a<-table.row.start(a)
a<-table.element(a,'Regression: S.E.(k) = alpha + beta * Mean(k)',2,TRUE)
a<-table.row.end(a)
a<-table.row.start(a)
a<-table.element(a,'alpha',header=TRUE)
a<-table.element(a,lm1$coefficients[[1]])
a<-table.row.end(a)
a<-table.row.start(a)
a<-table.element(a,'beta',header=TRUE)
a<-table.element(a,lm1$coefficients[[2]])
a<-table.row.end(a)
a<-table.row.start(a)
a<-table.element(a,'S.D.',header=TRUE)
a<-table.element(a,summary(lm1)$coefficients[2,2])
a<-table.row.end(a)
a<-table.row.start(a)
a<-table.element(a,'T-STAT',header=TRUE)
a<-table.element(a,summary(lm1)$coefficients[2,3])
a<-table.row.end(a)
a<-table.row.start(a)
a<-table.element(a,'p-value',header=TRUE)
a<-table.element(a,summary(lm1)$coefficients[2,4])
a<-table.row.end(a)
a<-table.end(a)
table.save(a,file='mytable1.tab')
a<-table.start()
a<-table.row.start(a)
a<-table.element(a,'Regression: ln S.E.(k) = alpha + beta * ln Mean(k)',2,TRUE)
a<-table.row.end(a)
a<-table.row.start(a)
a<-table.element(a,'alpha',header=TRUE)
a<-table.element(a,lnlm1$coefficients[[1]])
a<-table.row.end(a)
a<-table.row.start(a)
a<-table.element(a,'beta',header=TRUE)
a<-table.element(a,lnlm1$coefficients[[2]])
a<-table.row.end(a)
a<-table.row.start(a)
a<-table.element(a,'S.D.',header=TRUE)
a<-table.element(a,summary(lnlm1)$coefficients[2,2])
a<-table.row.end(a)
a<-table.row.start(a)
a<-table.element(a,'T-STAT',header=TRUE)
a<-table.element(a,summary(lnlm1)$coefficients[2,3])
a<-table.row.end(a)
a<-table.row.start(a)
a<-table.element(a,'p-value',header=TRUE)
a<-table.element(a,summary(lnlm1)$coefficients[2,4])
a<-table.row.end(a)
a<-table.row.start(a)
a<-table.element(a,'Lambda',header=TRUE)
a<-table.element(a,1-lnlm1$coefficients[[2]])
a<-table.row.end(a)
a<-table.end(a)
table.save(a,file='mytable2.tab')