| Multiple Linear Regression - Estimated Regression Equation |
| 50%in[t] = + 495.024743526173 + 0.669707434644624Temp[t] + 0.580536253348876Sunset[t] -14.7335700675909Rain[t] + e[t] |
| Multiple Linear Regression - Ordinary Least Squares | |||||
| Variable | Parameter | S.D. | T-STAT H0: parameter = 0 | 2-tail p-value | 1-tail p-value |
| (Intercept) | 495.024743526173 | 163.050032 | 3.036 | 0.004922 | 0.002461 |
| Temp | 0.669707434644624 | 0.397825 | 1.6834 | 0.102673 | 0.051336 |
| Sunset | 0.580536253348876 | 0.142263 | 4.0807 | 0.000306 | 0.000153 |
| Rain | -14.7335700675909 | 5.676743 | -2.5954 | 0.014483 | 0.007242 |
| Multiple Linear Regression - Regression Statistics | |
| Multiple R | 0.778769864380509 |
| R-squared | 0.606482501667236 |
| Adjusted R-squared | 0.56713075183396 |
| F-TEST (value) | 15.4118305853425 |
| F-TEST (DF numerator) | 3 |
| F-TEST (DF denominator) | 30 |
| p-value | 2.98919304897449e-06 |
| Multiple Linear Regression - Residual Statistics | |
| Residual Standard Deviation | 10.7466658613588 |
| Sum Squared Residuals | 3464.72481407083 |
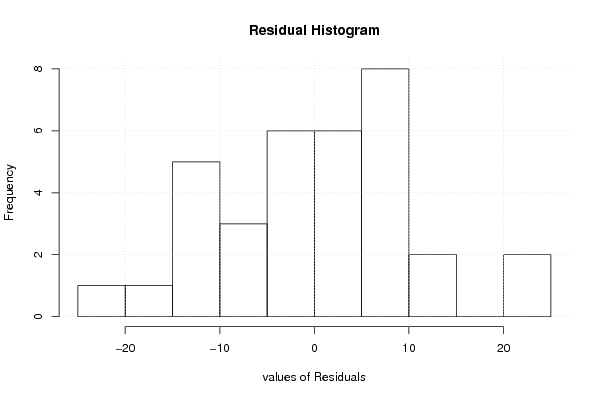
| Multiple Linear Regression - Actuals, Interpolation, and Residuals | |||
| Time or Index | Actuals | Interpolation Forecast | Residuals Prediction Error |
| 1 | 1225 | 1218.2345405523 | 6.76545944770401 |
| 2 | 1214 | 1219.93100957674 | -5.93100957673903 |
| 3 | 1205 | 1219.57358599161 | -14.5735859916148 |
| 4 | 1196 | 1217.11786892126 | -21.117868921261 |
| 5 | 1209 | 1194.86100571785 | 14.1389942821515 |
| 6 | 1192 | 1204.79488269383 | -12.7948826938293 |
| 7 | 1196 | 1190.90936242347 | 5.09063757652543 |
| 8 | 1174 | 1187.53825538245 | -13.5382553824496 |
| 9 | 1183 | 1202.4279673748 | -19.4279673748006 |
| 10 | 1210 | 1203.54390014589 | 6.45609985410539 |
| 11 | 1205 | 1204.77157396609 | 0.228426033913781 |
| 12 | 1218 | 1206.89206788915 | 11.1079321108529 |
| 13 | 1224 | 1203.58793159159 | 20.4120684084134 |
| 14 | 1215 | 1205.55228358989 | 9.44771641011273 |
| 15 | 1206 | 1199.97114201453 | 6.028857985465 |
| 16 | 1202 | 1194.90356594907 | 7.09643405093285 |
| 17 | 1215 | 1193.74249344237 | 21.2575065576306 |
| 18 | 1203 | 1195.19327993079 | 7.80672006921432 |
| 19 | 1194 | 1195.01456813822 | -1.01456813822358 |
| 20 | 1170 | 1180.482279731 | -10.4822797309967 |
| 21 | 1184 | 1179.20909674523 | 4.7909032547693 |
| 22 | 1199 | 1193.5852432277 | 5.41475677230263 |
| 23 | 1196 | 1192.424170721 | 3.57582927900038 |
| 24 | 1189 | 1188.09327283364 | 0.906727166359152 |
| 25 | 1185 | 1189.11966499347 | -4.11966499346846 |
| 26 | 1192 | 1187.46759684469 | 4.53240315531181 |
| 27 | 1188 | 1184.76619723831 | 3.2338027616922 |
| 28 | 1176 | 1183.11412908953 | -7.11412908952753 |
| 29 | 1177 | 1178.91680325913 | -1.91680325912708 |
| 30 | 1166 | 1175.72440801066 | -9.72440801066417 |
| 31 | 1176 | 1178.6485508553 | -2.64855085529863 |
| 32 | 1181 | 1181.08169805785 | -0.0816980578505574 |
| 33 | 1176 | 1179.11697662958 | -3.11697662957926 |
| 34 | 1172 | 1182.68862647103 | -10.688626471027 |
| Goldfeld-Quandt test for Heteroskedasticity | |||
| p-values | Alternative Hypothesis | ||
| breakpoint index | greater | 2-sided | less |
| 7 | 0.0329836539857675 | 0.0659673079715349 | 0.967016346014233 |
| 8 | 0.117837664092727 | 0.235675328185455 | 0.882162335907273 |
| 9 | 0.775494926286583 | 0.449010147426833 | 0.224505073713417 |
| 10 | 0.995573496933185 | 0.00885300613362977 | 0.00442650306681488 |
| 11 | 0.997251316914085 | 0.00549736617183043 | 0.00274868308591522 |
| 12 | 0.995576514879381 | 0.00884697024123854 | 0.00442348512061927 |
| 13 | 0.996924414175377 | 0.00615117164924614 | 0.00307558582462307 |
| 14 | 0.993349096969948 | 0.0133018060601034 | 0.00665090303005172 |
| 15 | 0.987356822726968 | 0.0252863545460635 | 0.0126431772730317 |
| 16 | 0.975631748656793 | 0.0487365026864136 | 0.0243682513432068 |
| 17 | 0.995211596593493 | 0.00957680681301345 | 0.00478840340650673 |
| 18 | 0.992182981504532 | 0.0156340369909367 | 0.00781701849546837 |
| 19 | 0.991855965445788 | 0.0162880691084235 | 0.00814403455421176 |
| 20 | 0.999194929250372 | 0.00161014149925661 | 0.000805070749628307 |
| 21 | 0.997659135407826 | 0.00468172918434864 | 0.00234086459217432 |
| 22 | 0.993818241768772 | 0.0123635164624562 | 0.00618175823122808 |
| 23 | 0.984588839614297 | 0.0308223207714055 | 0.0154111603857028 |
| 24 | 0.96388133610743 | 0.07223732778514 | 0.03611866389257 |
| 25 | 0.954593801160307 | 0.0908123976793851 | 0.0454061988396925 |
| 26 | 0.899179790058023 | 0.201640419883954 | 0.100820209941977 |
| 27 | 0.846138381496307 | 0.307723237007386 | 0.153861618503693 |
| Meta Analysis of Goldfeld-Quandt test for Heteroskedasticity | |||
| Description | # significant tests | % significant tests | OK/NOK |
| 1% type I error level | 7 | 0.333333333333333 | NOK |
| 5% type I error level | 14 | 0.666666666666667 | NOK |
| 10% type I error level | 17 | 0.80952380952381 | NOK |


