Free Statistics
of Irreproducible Research!
Description of Statistical Computation | |||||||||||||||||||||||||||||||||||||||||
|---|---|---|---|---|---|---|---|---|---|---|---|---|---|---|---|---|---|---|---|---|---|---|---|---|---|---|---|---|---|---|---|---|---|---|---|---|---|---|---|---|---|
| Author's title | |||||||||||||||||||||||||||||||||||||||||
| Author | *Unverified author* | ||||||||||||||||||||||||||||||||||||||||
| R Software Module | rwasp_univariatedataseries.wasp | ||||||||||||||||||||||||||||||||||||||||
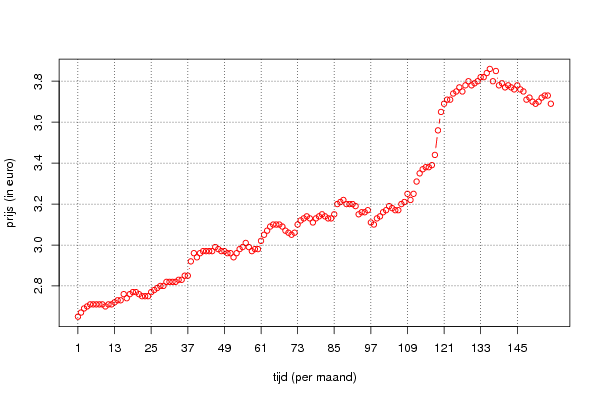
| Title produced by software | Univariate Data Series | ||||||||||||||||||||||||||||||||||||||||
| Date of computation | Thu, 29 Sep 2011 06:55:31 -0400 | ||||||||||||||||||||||||||||||||||||||||
| Cite this page as follows | Statistical Computations at FreeStatistics.org, Office for Research Development and Education, URL https://freestatistics.org/blog/index.php?v=date/2011/Sep/29/t1317293813qajmbmxvsk5r4cf.htm/, Retrieved Fri, 17 May 2024 21:11:34 +0000 | ||||||||||||||||||||||||||||||||||||||||
| Statistical Computations at FreeStatistics.org, Office for Research Development and Education, URL https://freestatistics.org/blog/index.php?pk=124518, Retrieved Fri, 17 May 2024 21:11:34 +0000 | |||||||||||||||||||||||||||||||||||||||||
| QR Codes: | |||||||||||||||||||||||||||||||||||||||||
|
| |||||||||||||||||||||||||||||||||||||||||
| Original text written by user: | |||||||||||||||||||||||||||||||||||||||||
| IsPrivate? | No (this computation is public) | ||||||||||||||||||||||||||||||||||||||||
| User-defined keywords | KDGP1W1 | ||||||||||||||||||||||||||||||||||||||||
| Estimated Impact | 163 | ||||||||||||||||||||||||||||||||||||||||
Tree of Dependent Computations | |||||||||||||||||||||||||||||||||||||||||
| Family? (F = Feedback message, R = changed R code, M = changed R Module, P = changed Parameters, D = changed Data) | |||||||||||||||||||||||||||||||||||||||||
| - [Univariate Data Series] [Prijsevolutie van...] [2011-09-29 10:55:31] [27830603f12132457d99d827849f2486] [Current] - RMPD [Histogram] [Prijsevolutie van...] [2011-10-04 17:57:20] [ea8887999792335f4eb146b4b504ba78] - RMPD [Histogram] [Prijsevolutie van...] [2011-10-04 18:01:39] [ea8887999792335f4eb146b4b504ba78] - RMPD [Histogram] [Prijsevolutie van...] [2011-10-04 18:04:01] [ea8887999792335f4eb146b4b504ba78] - RMPD [Kernel Density Estimation] [Prijsevolutie van...] [2011-10-04 18:10:41] [ea8887999792335f4eb146b4b504ba78] | |||||||||||||||||||||||||||||||||||||||||
| Feedback Forum | |||||||||||||||||||||||||||||||||||||||||
Post a new message | |||||||||||||||||||||||||||||||||||||||||
Dataset | |||||||||||||||||||||||||||||||||||||||||
| Dataseries X: | |||||||||||||||||||||||||||||||||||||||||
2.65 2.67 2.69 2.7 2.71 2.71 2.71 2.71 2.71 2.7 2.71 2.71 2.72 2.73 2.73 2.76 2.74 2.76 2.77 2.77 2.76 2.75 2.75 2.75 2.77 2.78 2.79 2.8 2.8 2.82 2.82 2.82 2.82 2.83 2.83 2.85 2.85 2.92 2.96 2.94 2.96 2.97 2.97 2.97 2.97 2.99 2.98 2.97 2.97 2.96 2.96 2.94 2.96 2.98 2.99 3.01 2.99 2.97 2.98 2.98 3.02 3.05 3.07 3.09 3.1 3.1 3.1 3.09 3.07 3.06 3.05 3.06 3.1 3.12 3.13 3.14 3.13 3.11 3.13 3.14 3.15 3.14 3.13 3.13 3.15 3.2 3.21 3.22 3.2 3.2 3.2 3.19 3.15 3.16 3.16 3.17 3.11 3.1 3.13 3.14 3.16 3.17 3.19 3.18 3.17 3.17 3.2 3.21 3.25 3.22 3.25 3.31 3.35 3.37 3.38 3.38 3.39 3.44 3.56 3.65 3.69 3.71 3.71 3.74 3.75 3.77 3.75 3.78 3.8 3.78 3.79 3.8 3.82 3.82 3.84 3.86 3.8 3.85 3.78 3.79 3.77 3.78 3.77 3.76 3.78 3.76 3.75 3.71 3.72 3.7 3.69 3.7 3.72 3.73 3.73 3.69 | |||||||||||||||||||||||||||||||||||||||||
Tables (Output of Computation) | |||||||||||||||||||||||||||||||||||||||||
| |||||||||||||||||||||||||||||||||||||||||
Figures (Output of Computation) | |||||||||||||||||||||||||||||||||||||||||
Input Parameters & R Code | |||||||||||||||||||||||||||||||||||||||||
| Parameters (Session): | |||||||||||||||||||||||||||||||||||||||||
| par1 = Prijsevolutie van 1 kg speculaas (januari 1998-december 2010) ; par2 = Belgostat ; par3 = Prijsevolutie van 1 kg speculaas per maand (januari 1998-december 2010) ; par4 = 12 ; | |||||||||||||||||||||||||||||||||||||||||
| Parameters (R input): | |||||||||||||||||||||||||||||||||||||||||
| par1 = Prijsevolutie van 1 kg speculaas (januari 1998-december 2010) ; par2 = Belgostat ; par3 = Prijsevolutie van 1 kg speculaas per maand (januari 1998-december 2010) ; par4 = 12 ; | |||||||||||||||||||||||||||||||||||||||||
| R code (references can be found in the software module): | |||||||||||||||||||||||||||||||||||||||||
if (par4 != 'No season') { | |||||||||||||||||||||||||||||||||||||||||